Free Pictogram Template
Free Download this Free Pictogram Template Design in Lucidchart Format. Easily Editable, Printable, Downloadable.
Free Lucidchart Pictogram Template: Visualize Data with Icons and Graphics
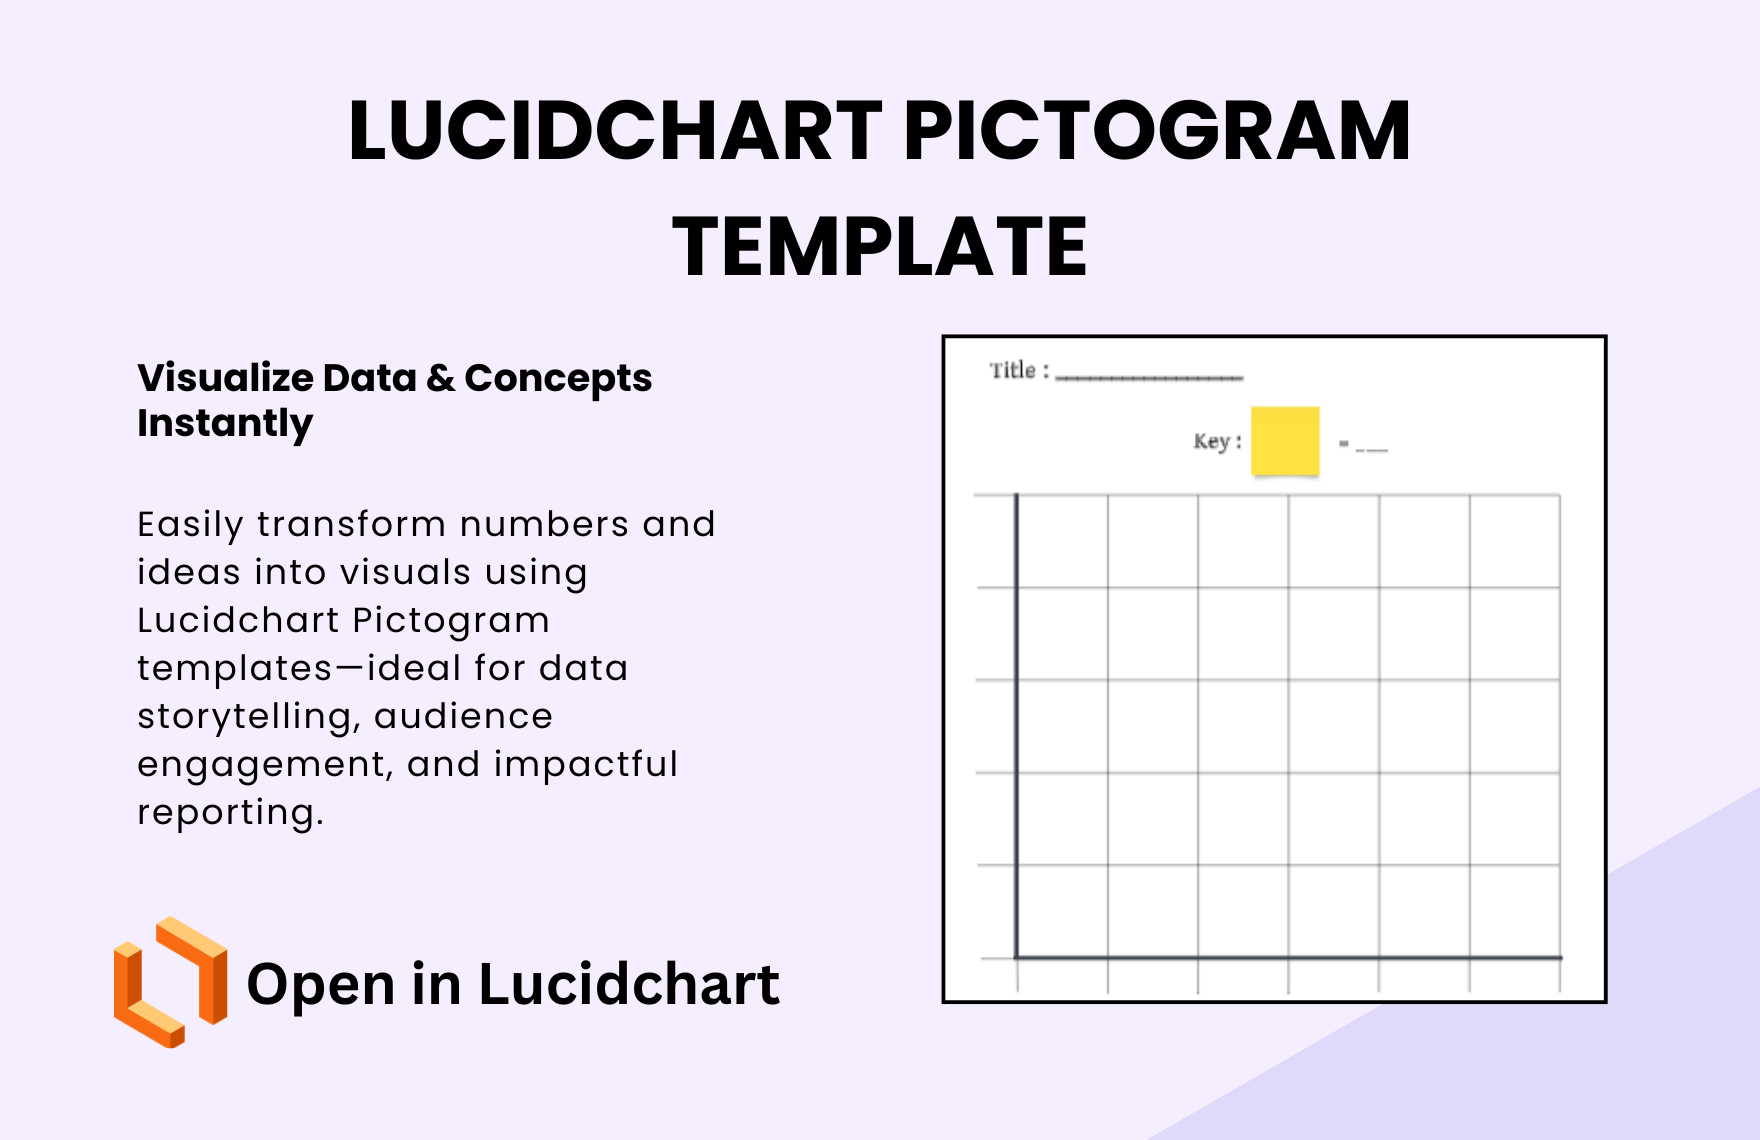
Lucidchart’s Pictogram Templates allow you to represent complex data and information visually by using icons or images in place of traditional numbers and text. These templates are perfect for creating engaging, easy-to-understand diagrams that represent statistics, processes, or other data-driven information. With six unique variations to choose from, you can find a style that best fits your data visualization needs and easily start customizing to communicate your message effectively.
Key Benefits of Using Pictogram Templates:
-
Engage Your Audience: Use visually appealing icons and images to represent data, making it easier for your audience to digest and understand.
-
Simplify Complex Information: Pictograms break down complex information into simple, relatable visuals, helping you communicate even complicated data clearly.
-
Customizable Designs: Adapt the templates by adding or changing icons, adjusting colors, and modifying the layout to match your project’s requirements.
-
Interactive and Clear: Pictograms offer a dynamic and clear representation of data, ensuring that it’s not just informative but also easy to interpret at a glance.
-
Creative Storytelling: Elevate your presentations or reports with creative, data-driven visuals that capture the attention of your audience.
6 Template Styles to Choose From:
-
Simple Grid Layout: This straightforward design uses a grid system where each cell can be filled with an icon or image, making it easy to represent data by category or group.
-
Column-Based Pictogram: Perfect for representing various data sets across multiple categories, using pictograms in vertical columns for comparison and analysis.
-
Categorical Pictograms: Organize data by categories, with each category represented by a specific pictogram, providing clarity in segmented data presentation.
-
Percentage Representation: Represent numerical data with icons, where the number of icons corresponds to the percentage value, making it perfect for illustrating percentages or proportions.
-
Color-Coded Pictogram: Use different colored pictograms to represent various data groups, which is ideal for multi-faceted datasets or when you want to highlight trends or comparisons.
-
Icon and Text Combination: Combine icons with short descriptions to represent each data point. This layout is ideal when you need both visuals and labels for more detailed communication.
Where These Templates Help Most:
-
Data Presentation: Great for presentations or reports where you need to represent statistical data, survey results, or key performance indicators (KPIs) in a visually engaging manner.
-
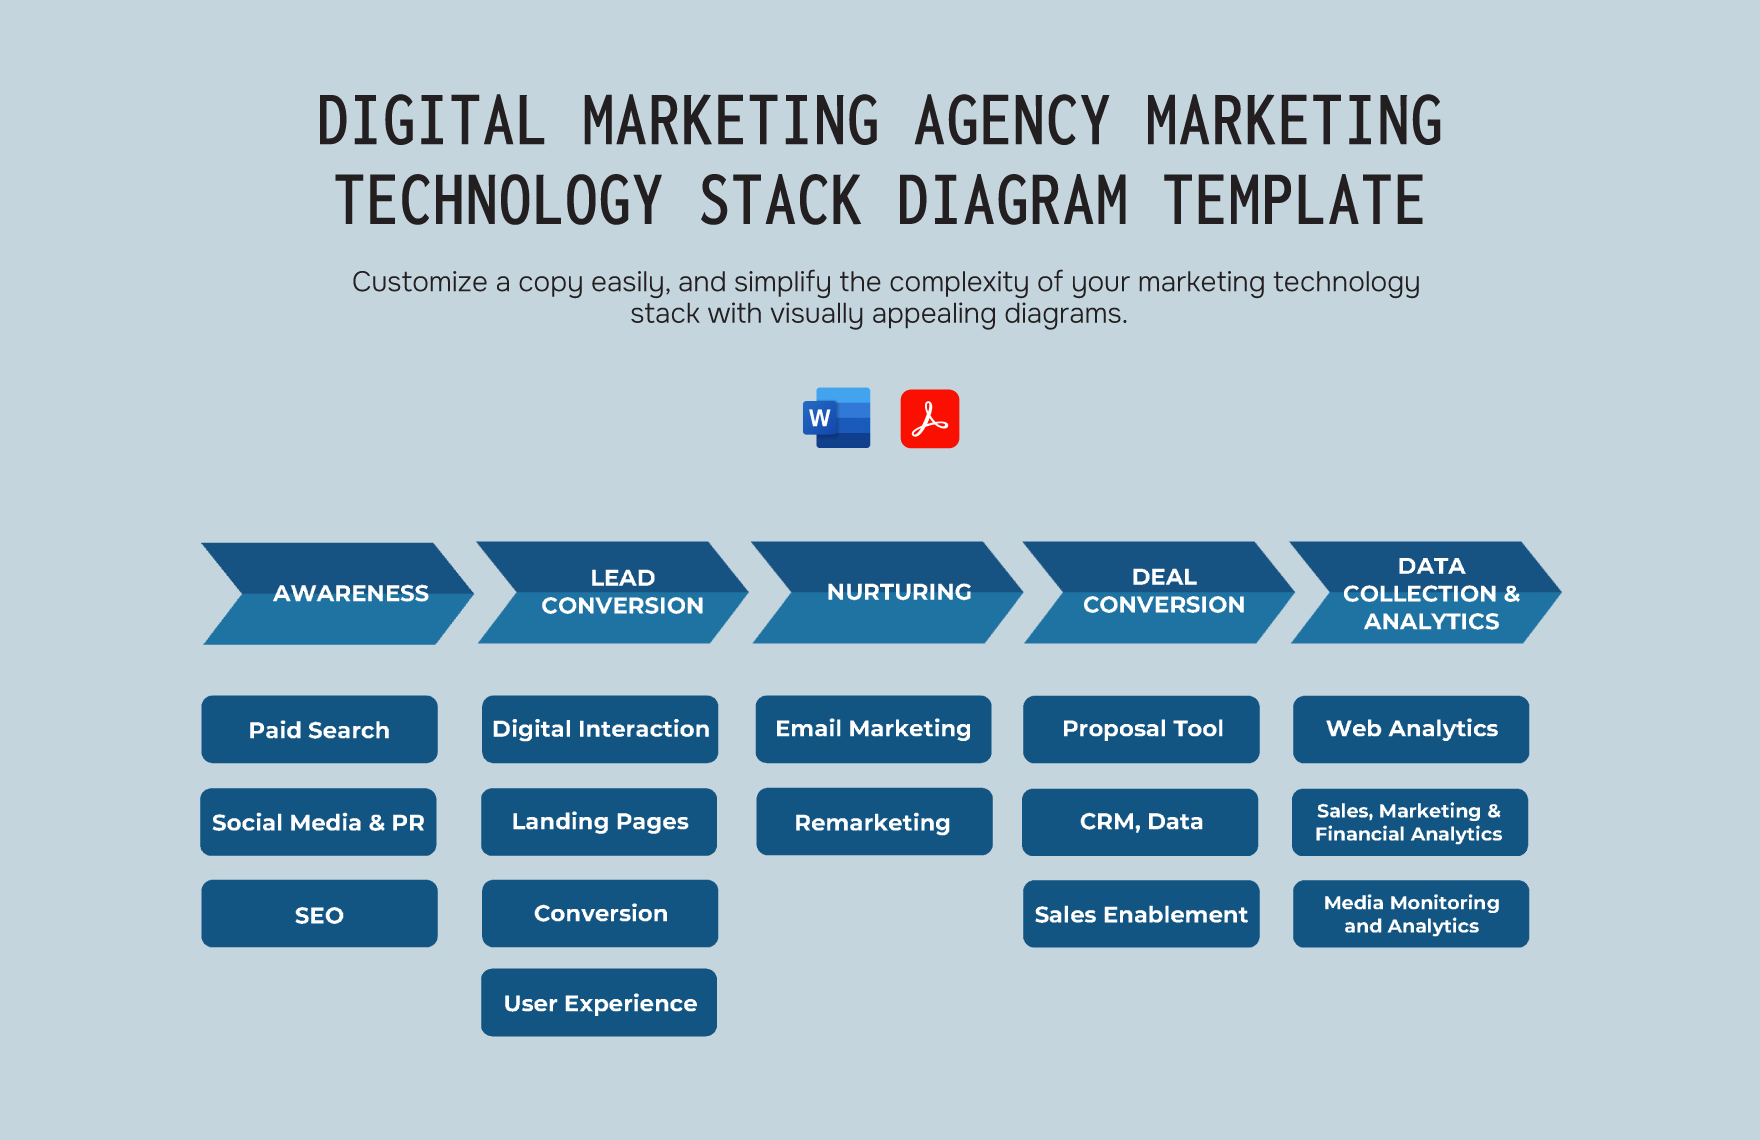
Marketing Campaigns: Use pictograms to visually represent campaign performance, customer insights, or marketing analytics for easier comprehension.
-
Business Strategy & Planning: Visualize business data, such as project timelines, resource allocation, or sales growth, in an easy-to-follow format.
-
Education and Learning: Educators can use pictograms to simplify concepts and data for students, making learning more visual and interactive.
-
Product Development: Use pictograms to represent product features, progress reports, or timelines, allowing teams to better visualize development stages.
Compatibility:
-
Lucidchart
-
Lucidspark
-
Desktop & Web Access
-
Real-time Collaboration
