Free Quarterly Financial Policy Report
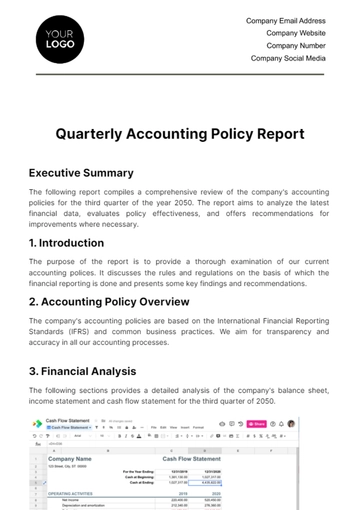
This report aims to present a comprehensive analysis of the financial performance of [Your Company Name] over the previous quarter, from January to March 2050.
Revenue Growth
One of the indispensable factors that gauge the success of any business entity including [Your Company Name] is its revenue growth. It is a critical financial parameter that reflects how effectively a company can engage its customer base and generate profit out of its operations. Observing this important factor for [Your Company Name], it is crucial to note that there has been an upward trend in the first quarter of 2050. Specifically, the company witnessed a positive shift in its revenue by 10% from what the totals were in the immediately preceding quarter. This surely implies a great deal about [Your Company Name]'s successful strides towards better customer engagement and increased profitability.
Table 1.0 below shows a detailed comparison of quarterly revenue for [Your Company Name].
Quarter | Revenue ($) | Growth (%) |
|---|---|---|
Q4 2049 | 5,000,000 | - |
Q1 2050 | 5,500,000 | 10 |
Profitability
The profitability margin is an index that allows us to analyze [Your Company Name]'s ability to generate profits. As demonstrated in Q1 of 2050, [Your Company Name] has proven it is adept at turning revenues into profits by enhancing its profitability ratio. This capability shone brightly as the company reached an outstanding profitability ratio of 60%. This impressive figure surpasses the profitability ratio of the previous quarter by a significant 10% increase. The trend indicates a steady upward trajectory in the company's profit-making ability, signifying a potentially prosperous future for [Your Company Name].
Liquidity
It is absolutely critical to engage in a thorough evaluation of the ability of [Your Company Name] to fulfill its short-term obligations, which is essentially its liquidity. The current ratio, a widely used financial indicator to measure liquidity, was documented at 1.8 in the first three months of the year 2050. This is a significant improvement from the previous quarter of the year 2049, where it stood at 1.5. Such turnaround in the company's liquidity position is noteworthy as it measures the company's ability to pay off its short-term liabilities with its short-term assets.
Additional Financial Metrics
In addition to revenue growth, profitability, and liquidity, other key financial metrics have been evaluated. This includes Earning Before Interest & Taxes (EBIT), return on equity (ROE) and net profit margin.
Metrics | Q4 2049 | Q1 2050 |
|---|---|---|
EBIT($) | 900,000 | 950,000 |
ROE(%) | 15 | 16 |
Net Profit Margin(%) | 30 | 32 |
Conclusion
In the first quarter of the year 2050, [Your Company Name] demonstrated a robust performance that was clearly evident through improvements in several important metrics. This includes an uptick in growth related to revenue, an increase in profitability, and enhancement in liquidity. These key performance indicators clearly depict the strong and healthy state of the company during this period.
- 100% Customizable, free editor
- Access 1 Million+ Templates, photo’s & graphics
- Download or share as a template
- Click and replace photos, graphics, text, backgrounds
- Resize, crop, AI write & more
- Access advanced editor
Elevate your financial reporting with Template.net's Quarterly Financial Policy Report Template. This editable and customizable template, powered by an advanced AI Editor Tool, streamlines the creation of comprehensive reports. Crafted for precision and efficiency, it ensures a professional presentation of your quarterly performance, seamlessly adapting to your unique needs. Upgrade your reporting process effortlessly with Template.net.
You may also like
- HR Policy
- Restaurant Policy
- Company Policy
- Accounting Policies and Procedures
- Website Policy
- Privacy Policy
- Safety Policy
- School Policy
- IT and Software Policy
- Law Firm Policy
- Construction Policy
- Interior Design Policy
- Travel Agency Policy
- Education Academic Policy
- Security Policy
- Real Estate Policy
- Expense Policy
- Software Policy


