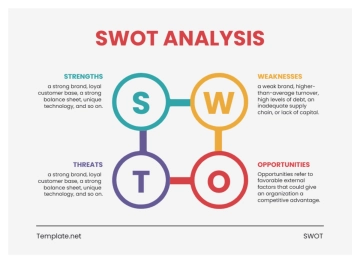
Free Sales SWOT Analysis of Presentation Content
I. Introduction
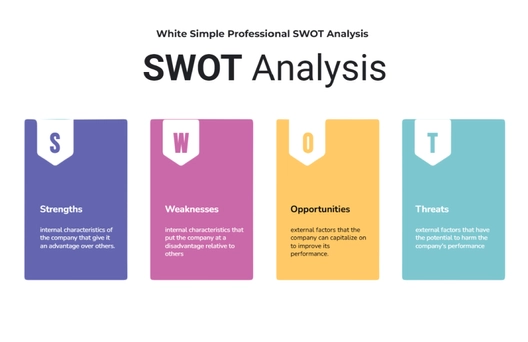
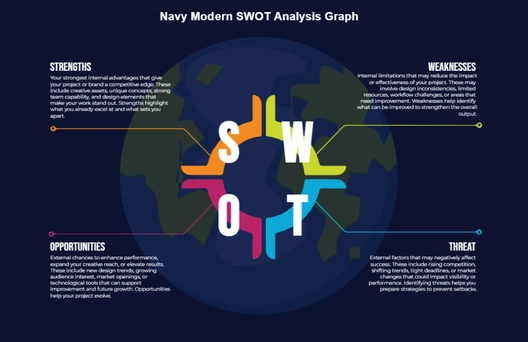
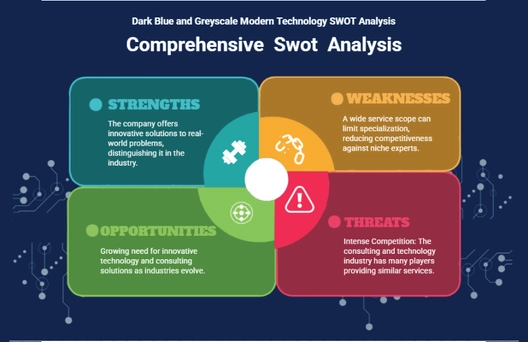
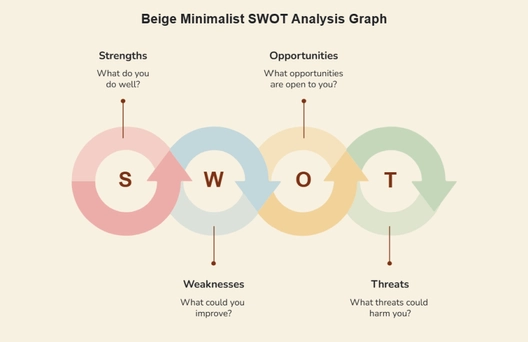
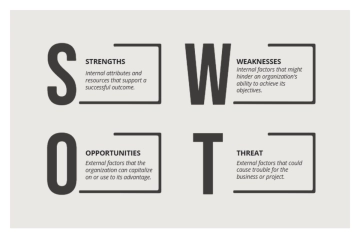
The importance of presentation content in driving sales and influencing customer decisions cannot be overstated. In an increasingly competitive market, the quality of your sales presentations can serve as a differentiator between you and your competitors. This document provides a comprehensive SWOT (Strengths, Weaknesses, Opportunities, Threats) Analysis focusing on presentation content for [Your Company Name].
II. Objective
The overarching objective of this SWOT analysis is to perform a meticulous evaluation of the presentation content currently being utilized by [Your Company Name] in its sales endeavors. This includes not only assessing the effectiveness of the content itself but also the way it is delivered and how it resonates with various audience segments. The following are the specific objectives:
Recognize the inherent strengths in the current presentation content that have led to successful sales conversions. The intent is to reinforce these attributes and integrate them into future sales strategies.
Highlight any vulnerabilities or shortcomings in the presentation content that could be undermining sales performance. Propose actionable remedies for these weaknesses.
Discover untapped opportunities where innovative content or delivery methods can provide a competitive advantage. Evaluate the feasibility of implementing these changes.
Examine external factors that pose a risk to the effectiveness of the company’s presentation content. Develop strategies to preempt or mitigate these risks.
III. Methodology
The methodology employed in conducting this SWOT analysis is rooted in both qualitative and quantitative research techniques. The aim is to provide a holistic view of [Your Company Name]'s presentation content. The following are the key steps undertaken:
A. Data Collection
Various sources such as internal records, customer feedback surveys, and third-party market research reports were consulted. Additional insights were obtained through interviews with sales teams and clients.
B. KPI Measurement
A range of Key Performance Indicators, including audience engagement, clarity of message, and visual effectiveness, were quantified. This data is compiled in tables and presented alongside each SWOT element.
C. Competitive Benchmarking
An analysis was performed to compare the company's presentation content with that of competitors. Features, design aesthetics, and information depth were among the aspects considered.
D. Risk Assessment
Various risks, including technological and market-driven threats, were identified. Each was rated based on its potential impact on presentation effectiveness.
E. Analysis and Synthesis
All collected data and insights were synthesized to form the SWOT analysis. Recommendations were developed based on observed patterns and disparities.
IV. Strengths
The presentation content for [Your Company Name] showcases several distinct strengths that contribute to effective sales initiatives. These strengths not only set the company apart in the marketplace but also contribute to customer engagement and sales conversion.
Strengths | Data Scores Gathered (over 10) |
Content Clarity | 8.5 |
Visual Elements | 9 |
Technical Data | 7.5 |
A. Content Clarity
[Your Company Name] has demonstrated proficiency in generating presentations characterized by high levels of content clarity, as reflected by the score of 8.5. Such presentations are pivotal for streamlining the sales process, providing a direct and coherent flow of information. This aligns well with strategic goals related to customer trust and ease of decision-making. The score of 8.5 has a twofold implication. Firstly, it signifies that the company has a strong footing in this aspect, making it a competitive advantage. Secondly, the room for improvement is minimal but not negligible. A potential area for action could be the further simplification of complex jargon without compromising on content quality.
B. Visual Elements
With a near-perfect score of 9.0 in Visual Elements, the company excels at incorporating well-designed graphics and visual aids into its presentations. These visuals are highly effective in facilitating audience comprehension and engagement. A 9.0 score reveals that the company is significantly above industry standards in the effective use of visual elements. The score suggests that maintaining this level of excellence is essential for sustained competitive advantage. There may be limited opportunities for improvement, such as periodic updates to align with changing design trends, but the primary focus should be on maintaining current standards.
C. Technical Depth
The company's presentations stand out for their depth of technical information, evidenced by a score of 7.5. The 7.5 score is commendable but indicates room for improvement. It suggests that while the company does well in incorporating detailed technical data, the execution might benefit from further refinement. This could involve a more strategic alignment of technical content with customer needs and the broader industry context.
V. Weaknesses
The identification and interpretation of these weaknesses offer [Your Company Name] the opportunity to apply focused efforts for improvement. By addressing these shortcomings, the company can better position itself to create compelling and effective presentations that align more closely with diverse audience needs and expectations.
Weaknesses | Data Scores Gathered (over 10) |
Content Length | 6 |
Audience Adaptability | 5.5 |
Real-Time Responsiveness | 4 |
A. Content Length
Presentations from the company often include extensive material, which may overwhelm or disengage the audience. While thoroughness is appreciated, the length of the content sometimes counteracts the benefits of clarity and visual effectiveness. A score of 6.0 indicates a moderate level of concern that needs immediate attention. The score suggests that there's a significant opportunity to improve audience engagement by refining the content length. Streamlining the presentations could enhance the overall effectiveness and contribute to better sales outcomes.
B. Audience Adaptability
Despite the use of well-crafted content and visuals, presentations are not always adapted to suit different audience profiles, leading to a score of 5.5. This can result in a disconnect, especially when dealing with diverse or international clienteles. The 5.5 score is indicative of a substantial weakness that may hinder the effectiveness of sales efforts. Addressing this weakness could involve incorporating more adaptable content and delivering more customized presentations to different audience segments.
C. Real-Time Responsiveness
[Your Company Name] presentations lack interactive elements that allow for real-time audience feedback or questions, which is reflected in the low score of 4.0. This makes it challenging to address immediate concerns or objections that could arise during the presentation. A low score of 4.0 reveals a critical area that requires urgent improvement. The introduction of interactive elements such as live polls or Q&A sessions can significantly enhance real-time engagement and responsiveness, thereby augmenting the overall impact of the presentation.
VI. Opportunities
In a dynamically evolving business landscape, opportunities for improvement abound. By seizing these opportunities, [Your Company Name] can refine its presentation content and, consequently, bolster its sales performance. The following table outlines these potential avenues for growth.
Opportunities | Data Scores Gathered (over 10) |
Interactivity | 8.5 |
Personalization | 9.0 |
Data-Driven Insights | 7 |
A. Interactivity
The incorporation of interactive features into the company's presentations can vastly improve audience engagement and attentiveness. Elements such as clickable infographics, live Q&A sessions, or real-time demonstrations offer the audience a more dynamic and participatory experience. An impact score of 8.5 suggests a high potential for differentiation and competitive advantage in the market. The high score indicates that even small enhancements in this area could yield significant benefits. Therefore, strategies that focus on increasing presentation interactivity should be prioritized.
B. Personalization
In a digital ecosystem where personalization is increasingly pivotal for customer satisfaction, adapting presentation content to suit individual audience preferences is essential. Employing advanced technologies like AI-driven analytics for real-time content adaptation can significantly improve viewer engagement. A near-maximum score of 9.0 underscores the crucial importance of this opportunity. Given the high impact score, it is imperative that the company must invest in technologies and methodologies that allow for robust personalization in its presentations.
C. Data-Driven Insights
The integration of real-time data analytics tools into the company's presentations can provide both the presenter and the audience with actionable insights during the sales dialogue. This capability not only strengthens the sales pitch but also showcases the company's commitment to data-backed decision-making. A score of 7.0 indicates a moderate to high level of opportunity. It suggests that the company would do well to explore partnerships with data analytics providers or invest in in-house solutions to make its presentations more insightful and responsive to real-time data.
VII. Threats
By thoroughly understanding and interpreting these threats, [Your Company Name] can develop strategies to safeguard against potential challenges. Such proactive measures will be pivotal in maintaining the effectiveness of the presentation content, ensuring its continued contribution to successful sales efforts.
Threats | Data Scores Gathered (over 10) |
Market Saturation | 5 |
Technological Obsolescence | 4 |
Regulatory Changes | 6.5 |
A. Market Saturation
With an increasing number of competitors investing in high-quality presentations, the market for impactful sales content is becoming saturated. This places a threat on [Your Company Name]'s ability to stand out and capture attention. A score of 5.0 implies a moderate level of threat. The company must continually innovate its presentation content to maintain a competitive edge. While the threat level is not critical, it does warrant ongoing attention and strategic adaptations.
B. Technological Obsolescence
The fast-paced nature of technological advancements poses a threat to the relevancy of [Your Company Name]'s presentation content, reflected by a score of 4.0. Failing to update or adapt to new formats or platforms could render the content outdated. A low score of 4.0 suggests an immediate need for action. The company should invest in updating its presentation technologies and platforms regularly to ensure that the content remains fresh and aligned with current standards.
C. Regulatory Changes
Changes in regulations regarding data privacy or copyright could affect how information is presented or sourced. The score of 6.5 signifies a moderate to high level of threat. Continuous monitoring of legal and regulatory updates is essential to mitigate this risk. Preparedness for quick adjustments to presentation content in response to regulatory shifts is highly advised.
VIII. Recommendations
The following part outlines targeted recommendations designed to address the specific areas identified in the SWOT analysis. These suggestions are grounded in the data interpretations of the company's strengths, weaknesses, opportunities, and threats. Each recommendation aims to offer actionable strategies that [Your Company Name] can implement to improve the effectiveness and impact of its presentation content.
A. Interactivity
Given the high potential impact score of 8.5, it is strongly recommended that the company should invest in interactive elements such as clickable infographics and real-time Q&A sessions to boost audience engagement and set the company apart in a saturated marketplace.
B. Personalization
Due to the critical importance signified by a score of 9.0, the company should expedite the adoption of AI-driven analytics for real-time content adaptation to individual audience preferences. Partnering with technology providers specialized in personalization algorithms would be a prudent approach.
C. Data-Driven Insights
With a noteworthy score of 7.0, the company should explore integrating real-time data analytics tools into its presentations. This could involve partnerships with analytics service providers or the development of in-house capabilities.
D. Content Length
In light of the moderate concern raised by a score of 6.0 in the Weaknesses section, strategies for content streamlining should be developed and implemented to enhance presentation effectiveness.
E. Regulatory Monitoring
Due to the score of 6.5 in the Threats section regarding Regulatory Changes, continuous legal and regulatory monitoring is advised. Preparedness plans should be put in place to allow for quick adjustments to presentation content as required.
IX. Conclusion
The SWOT analysis of presentation content for [Your Company Name] reveals several key strengths, weaknesses, opportunities, and threats that have significant implications for the company's success. Strengths such as high Content Clarity and effective use of Visual Elements position the company well in the marketplace. However, weaknesses like Content Length and Audience Adaptability require immediate attention to maintain a competitive edge. Moving forward, it is imperative that the company follows the recommended actions outlined above to optimize its presentation content. Doing so will not only fortify its current market position but also pave the way for future successes.
- 100% Customizable, free editor
- Access 1 Million+ Templates, photo’s & graphics
- Download or share as a template
- Click and replace photos, graphics, text, backgrounds
- Resize, crop, AI write & more
- Access advanced editor
Analyze your presentation content effectively with this editable and customizable Sales SWOT Analysis of Presentation Content Template from Template.net! This versatile tool, which can be easily modified using our AI Editor Tool, ensures a comprehensive SWOT analysis of your presentation content! Generate your analysis with ease! Try it out now!
