Get Access to World’s largest Template Library & Tools

How to Find a P-Value in Microsoft Excel

Microsoft Excel provides valuable tools for statistical analysis, including the ability to calculate P-values, which are crucial for determining the significance of your experimental results. Mastering the calculation of P-values in Excel can significantly aid your decision-making process.

How to Find a P-Value in Microsoft Excel


Finding a P-value in Microsoft Excel is an essential task when you need to test hypotheses and determine the significance of your data. This guide will show you how to use Excel to calculate P-values effectively.

  • Step 1. Prepare Your Data

    Ensure your data is correctly organized and input into Excel. Typically, you will need two sets of data for comparison. Arrange these in two adjacent columns to simplify analysis.

  • Step 2. Select the Appropriate Test

    Choose the statistical test that fits your data type and hypothesis. Common tests include the T-test for comparing means, the F-test for variances, and chi-square tests for categorical data. Each test has its own requirements and assumptions so select accordingly.

  • Step 3. Use the Data Analysis ToolPak

    If not already enabled, activate the Data Analysis ToolPak by going to “File” > “Options” > “Add-Ins.” Under “Manage,” select “Excel Add-ins” and check “Analysis ToolPak,” then click “OK.” This add-in includes various statistical tools, including those needed to calculate P-values.

  • Step 4. Perform the Test

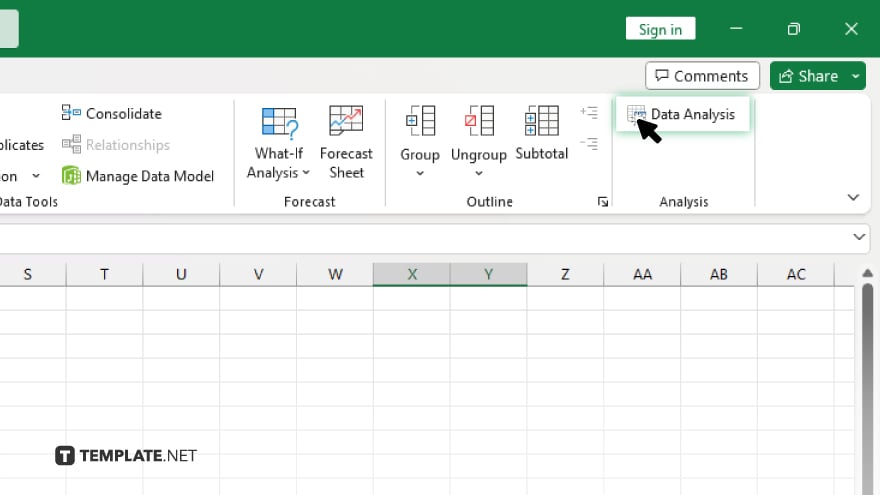
    step 4 perform the test

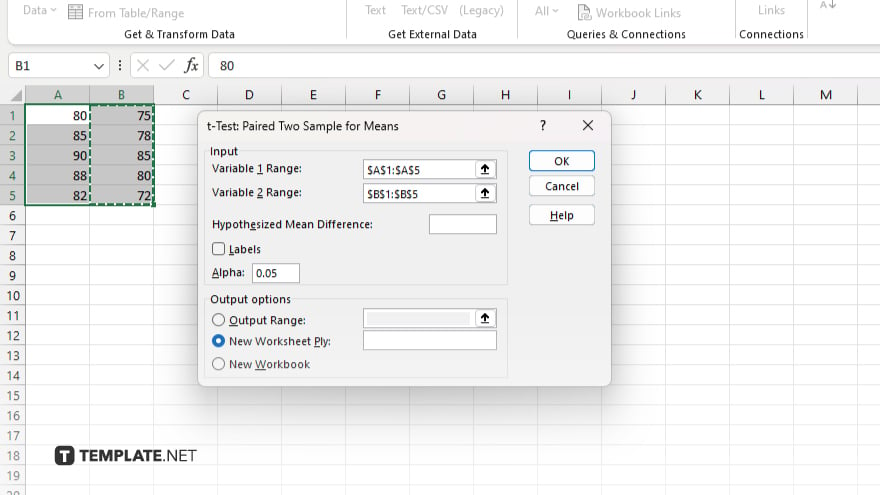
    Go to the “Data” tab, click “Data Analysis,” and select your chosen statistical test from the list. Input the ranges for your data sets, specify the output range, and fill in other necessary parameters. Excel will calculate the test statistic and the P-value.

  • Step 5. Interpret the P-Value

    step 5 interpret the p value

    Once Excel provides the P-value, interpret it in the context of your hypothesis test. A P-value less than the significance level (commonly 0.05) suggests that you reject the null hypothesis, indicating significant differences or effects within your data.

You may also find valuable insights in the following articles offering tips for Microsoft Excel:

note iconNote

Unlock Your Productivity with Over 100,000 Microsoft Excel Templates! Exclusively Available at Template.net – Download Now and Transform Your Data Handling Experience!

FAQs

What is the significance level commonly used when interpreting P-values?

The most commonly used significance level for interpreting P-values is 0.05.

Can I calculate a P-value in Excel without the Data Analysis ToolPak?

Yes, you can calculate P-values using formulas like the T.TEST function or CHISQ.TEST function, but the Data Analysis ToolPak simplifies the process with ready-to-use functions.

Does Excel provide P-values for all types of statistical tests?

Excel provides P-values for common statistical tests such as T-tests, chi-square tests, and the ANOVA function through the Data Analysis ToolPak.

How accurate are P-values calculated in Excel compared to specialized statistical software?

While Excel is suitable for basic to moderate statistical analysis, specialized statistical software may provide more accuracy and options for complex analyses.

Can I use Excel to calculate P-values for paired data?

Yes, Excel can calculate P-values for paired data using the paired T-test option within the Data Analysis ToolPak.

More in Excel

How to Unhide Everything in Microsoft ExcelHow to Sign in on Microsoft Excel
How to Insert a Formula in Microsoft ExcelHow to Make Rows the Same Size in Microsoft Excel
How to Type a Check Mark in Microsoft ExcelHow to Create a Timesheet in Microsoft Excel
How to Rotate a Pie Chart in Microsoft ExcelHow to Use Filters in Microsoft Excel
How to Add Arrows in Microsoft ExcelHow to Delete Blank Spaces in Microsoft Excel
How to Delete Excess Rows in Microsoft ExcelHow to Match Data in Microsoft Excel
How to Change the Color of an Excel CellHow to Auto-Adjust Column Width in Microsoft Excel
How to Make Boxes in Microsoft ExcelHow to Round Up a Number in Microsoft Excel
How to Show the Toolbar in Microsoft ExcelHow to Add a New Line in Microsoft Excel
How to Merge on Microsoft ExcelHow to See Changes Made in Microsoft Excel
How to Add Comma to Numbers in Microsoft ExcelHow to Make a Hyperlink in Microsoft Excel
How to Insert Arrows in Microsoft ExcelHow to Add Headers on Microsoft Excel
How to Make Comparison Charts in Microsoft ExcelHow to Code in Microsoft Excel
How to Write a Paragraph in Microsoft ExcelHow to Find on Microsoft Excel
How to Select All Rows in Microsoft ExcelHow to Create a Weekly Schedule in Microsoft Excel
How To Add 2 Columns in Microsoft ExcelHow to Export Microsoft Excel to PDF
How to Add Vertical Lines in an Excel GraphHow to Wrap a Cell in Microsoft Excel
How to Add Dates in Microsoft Excel AutomaticallyHow to Create a Flowchart in Microsoft Excel
How to Change the Y Axis in Microsoft ExcelHow to Add Cells Together in Microsoft Excel
How to Switch Axes in Microsoft ExcelHow to Compare Two Tabs in Microsoft Excel
How to Make a Scatter Plot on Microsoft ExcelHow to Remove Autofilter in Microsoft Excel
How to Do a Line Graph in Microsoft ExcelHow to Convert Date to Month in Microsoft Excel
How to Make a Balance Sheet in Microsoft ExcelHow to Refresh Microsoft Excel Formulas
How to Do a Histogram in Microsoft ExcelHow to Change the Microsoft Excel Theme
How to Learn Microsoft Excel for FreeHow to Create Address Labels in Microsoft Excel
How to Sort a Table in Microsoft ExcelHow to Find the Mean, Median, and Mode in Microsoft Excel
How to Sum Random Cells in Microsoft ExcelHow to Add a Whole Column in Microsoft Excel
How to Make a Copy of a Microsoft Excel WorkbookHow to Subtract a Column in Microsoft Excel
How to Remove Parentheses in Microsoft ExcelHow to Fix Rows in Microsoft Excel
How to Make a Timesheet in Microsoft ExcelHow to Create a Flow Chart in Microsoft Excel
How to Make Square Cells in Microsoft ExcelHow to Apply a Filter in Microsoft Excel
How to Insert a Note in Microsoft ExcelHow to Make a Graph in Microsoft Excel With Data
How to Create a Sparkline in Microsoft ExcelHow to Set Margins in Microsoft Excel
How to Copy Filtered Data in Microsoft ExcelHow to Set Default Font in Microsoft Excel
How to Edit Footer in Microsoft ExcelHow to Unhide All Sheets in Microsoft Excel
How to Get Rid of Spaces in Microsoft ExcelHow to Calculate Columns in Microsoft Excel
How to Change a Formula to a Value in Microsoft ExcelHow to Flip Rows and Columns in Microsoft Excel
How to Make a Box in Microsoft ExcelHow to Use NPV in Microsoft Excel
How to Make a List of Numbers in Microsoft ExcelHow to Make a Sensitivity Table in Microsoft Excel
How to Keep 0 in Front of a Number in Microsoft ExcelHow to Do an Absolute Reference in Microsoft Excel
How to Put a Drop Down in Microsoft ExcelHow to Change a Negative Number to Positive in Excel
How to Combine Tables in Microsoft ExcelHow to Highlight Blank Cells in Microsoft Excel
How to Save a Macro in Microsoft ExcelHow to Sort by Month in Microsoft Excel
How to Do a Percentage Increase in Microsoft ExcelHow to Apply Filter in Microsoft Excel
How to Delete Multiple Sheets in Microsoft ExcelHow to Create a Slicer in Microsoft Excel
How to Turn Microsoft Excel Data Into a GraphHow to Move a Page Break in Microsoft Excel
How to Clear Table Format in Microsoft ExcelHow to Extract the Year From a Date in Microsoft Excel
How to Do a Bar Graph in Microsoft ExcelHow to Change Theme in Microsoft Excel
How to Calculate Cells in Microsoft ExcelHow to Label X and Y Axis on Microsoft Excel
How to Change Print Area in Microsoft ExcelHow to Add 2 Cells in Microsoft Excel
bottom banner