![How To Make/Create an Invitation in Google Docs [Templates + Examples]](https://images.template.net/wp-content/uploads/2023/07/How-To-Make_Create-an-Invitation-in-Google-Docs-Templates-Examples-788x443.png)
How To Make/Create an Invitation in Google Docs [Templates + Examples]
To formally invite someone or a group of people to an event or activity, you will need to send out…
Jul 28, 2023


Sep 02, 2025
Diagrams are generally used in many aspects of our daily lives such as for business, school, personal projects, and many others. Structuring a clear and well-defined diagrams for your business, professional work, or personal project is fundamental in representing a specific concept, idea, relationship, anatomy, statistical data, or any topic in an organized manner.

A diagram refers to a basic drawing or illustration composed of lines and shapes to represent a particular concept, idea, knowledge, or topic.
Diagrams are essential visual communication tools for many people, businesses, and organizations as they are widely used for problem-solving with the application of geometry and space.
A diagram is a simple abstract and pictorial graphic representation that serves to encode integral information through visualization methods such as graphs, bar charts, drawings, maps, engineering blueprints, architectural sketches, flowcharts, and tables. It demonstrates qualitative data with shapes connected by arrows, lines, and other visual links.
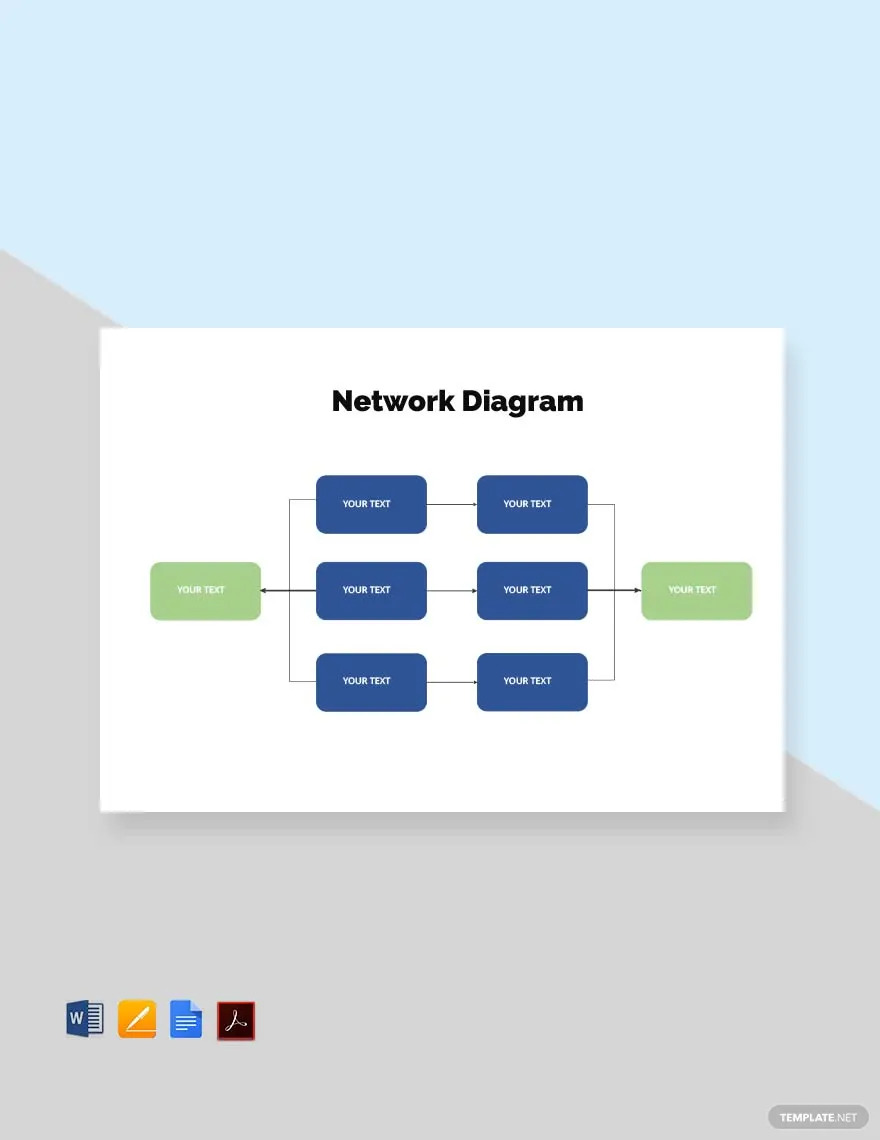
From engineering to computer programming to project management, network diagrams are used in multiple ways such as for scheduling, showing the logical relationships between the activities on the schedule for a certain project. A network diagram is important to delineate the sequence of activities so that the actual schedule dates can be calculated.
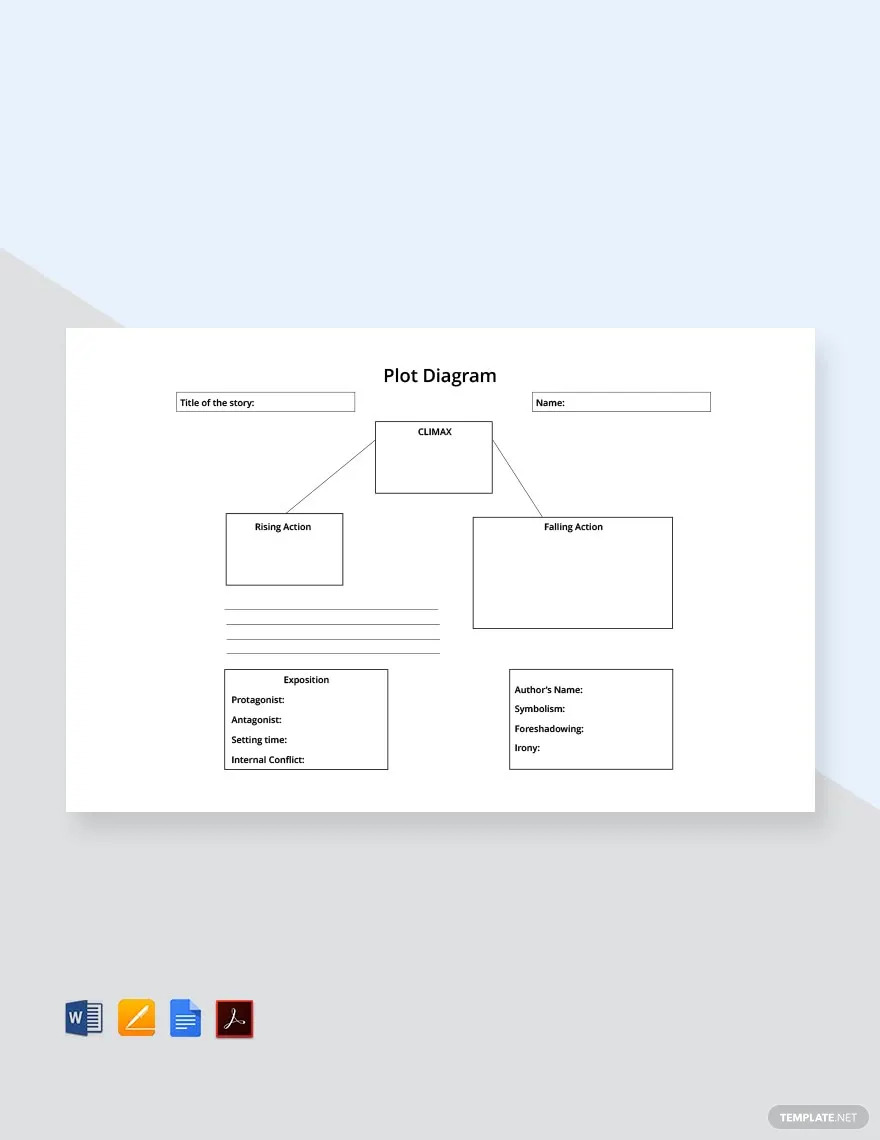
Plot diagrams like scatter or probability distributions are mainly used to display correlations between variables along a trend line. As an organizational tool, a plot diagram focuses on depicting a pyramid or triangular shape to map the events in a story, guiding students and others to build literary comprehension and appreciation.
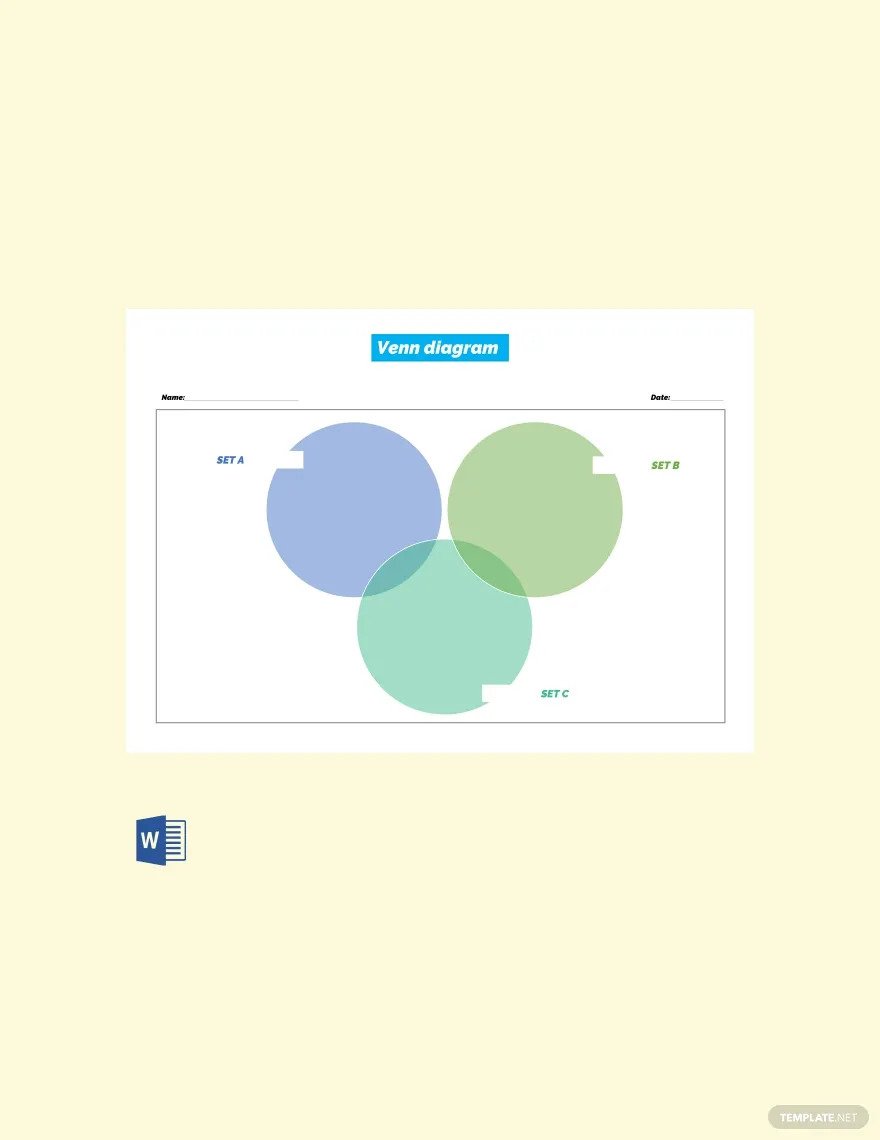
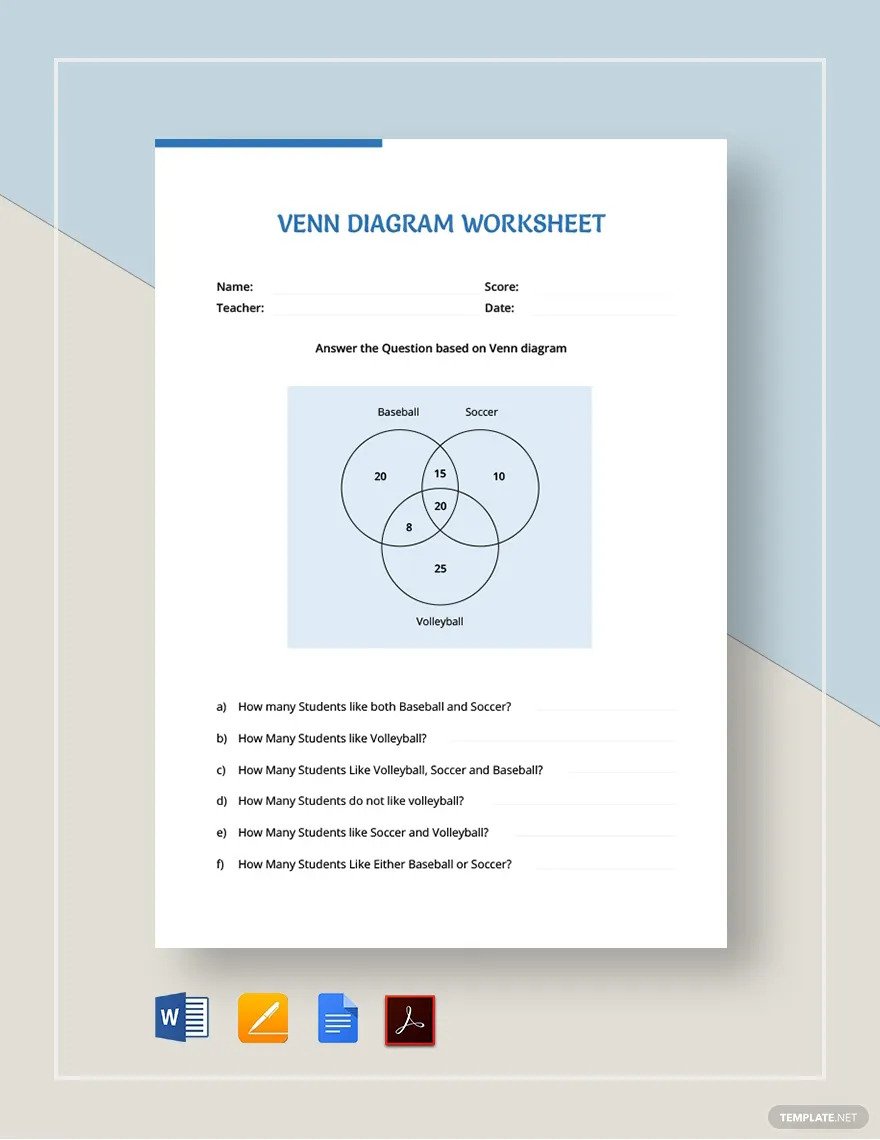
With the use of overlapping circles, a Venn diagram is a type of diagram that clearly illustrates the logical relationships between two or more groups of ideas, concepts, topics, or other things. Each circle demonstrates something that you want to make a comparison and contrast, while you write the similarities of the two things in the area where the two circles intersect.
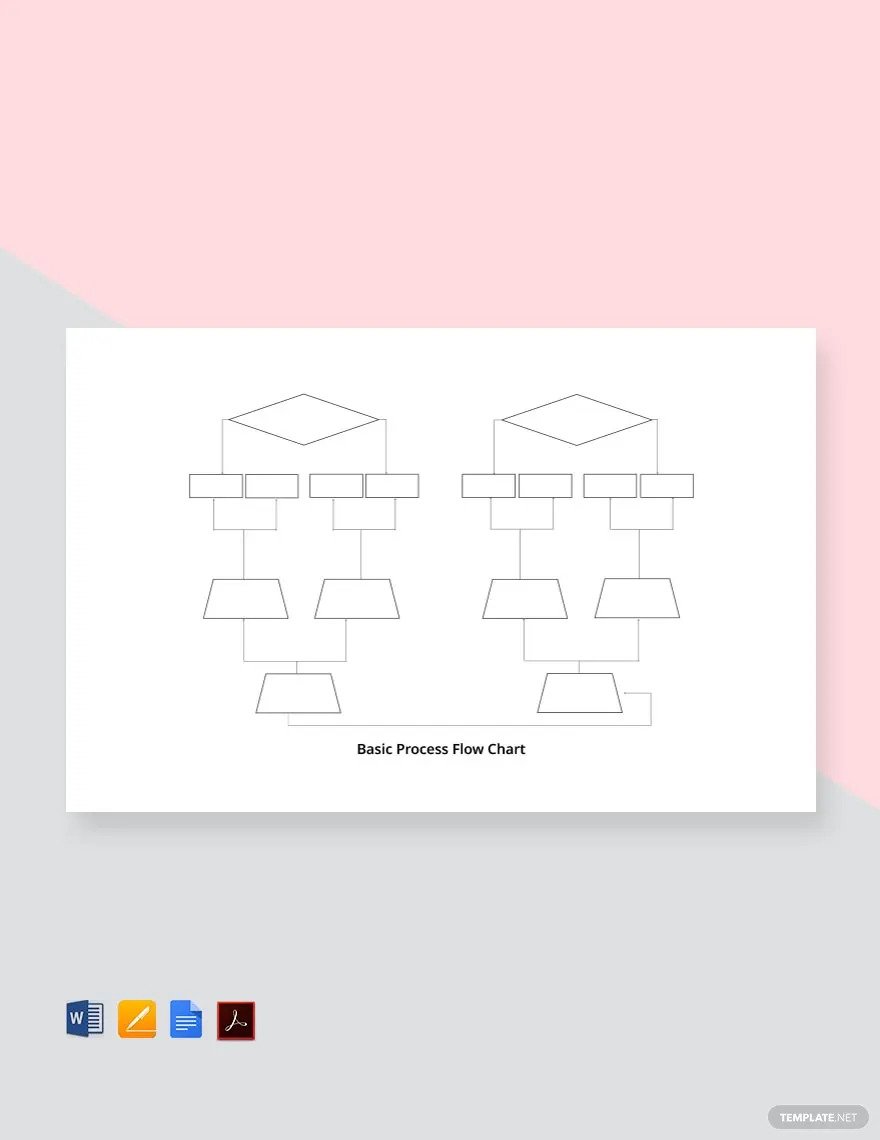
One of the extensively used quality management tools is the process flow diagram or flow chart as it captures the flow of a process using the standard flow chart shapes such as diamonds for decision points and rectangles for processes. It is an effective visual representation of a process from beginning to end which enables the user to manipulate the tasks within the process flow for optimal results, especially to design and improve processes.
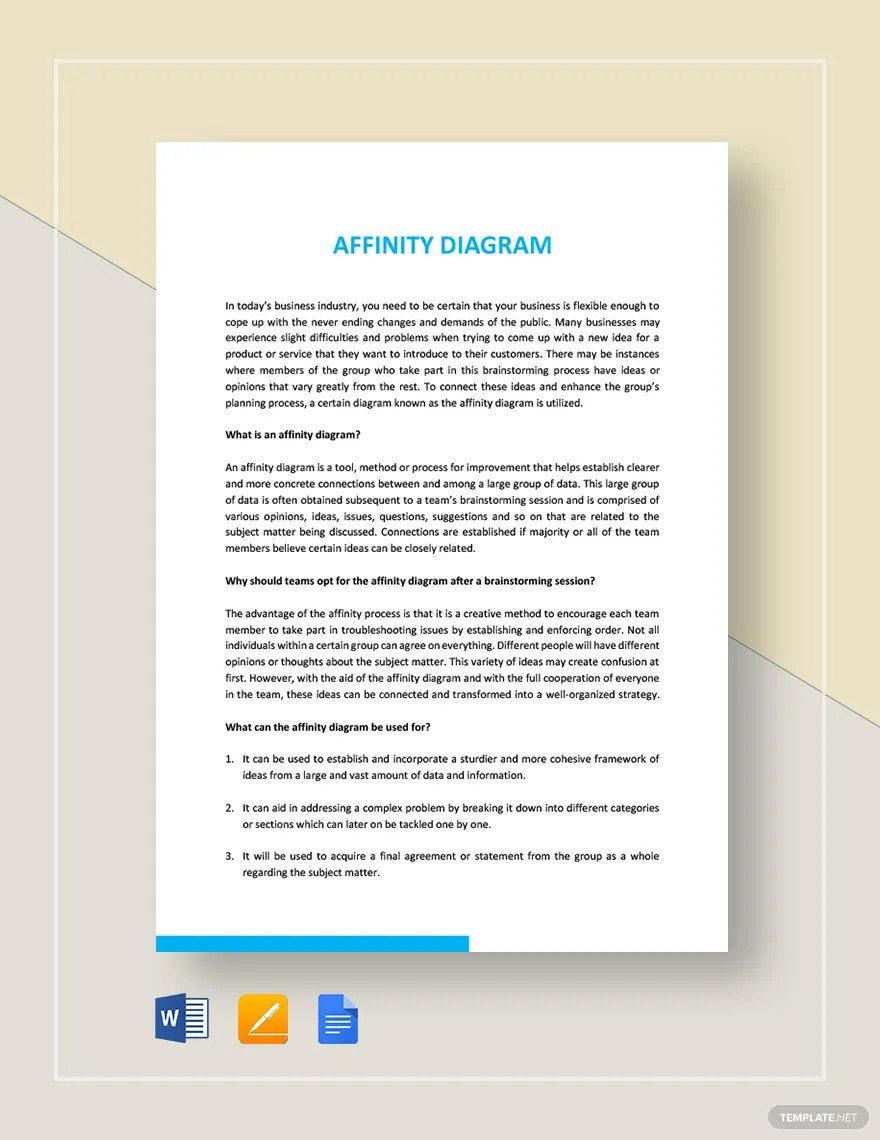
An affinity diagram is a type of diagram that is used for wide-ranging projects for the organization of ideas on customer requirements and for solving quality problems. Mostly used in a brainstorming session, it generates, arranges, and centralizes information associated with a complicated issue, product, or process.
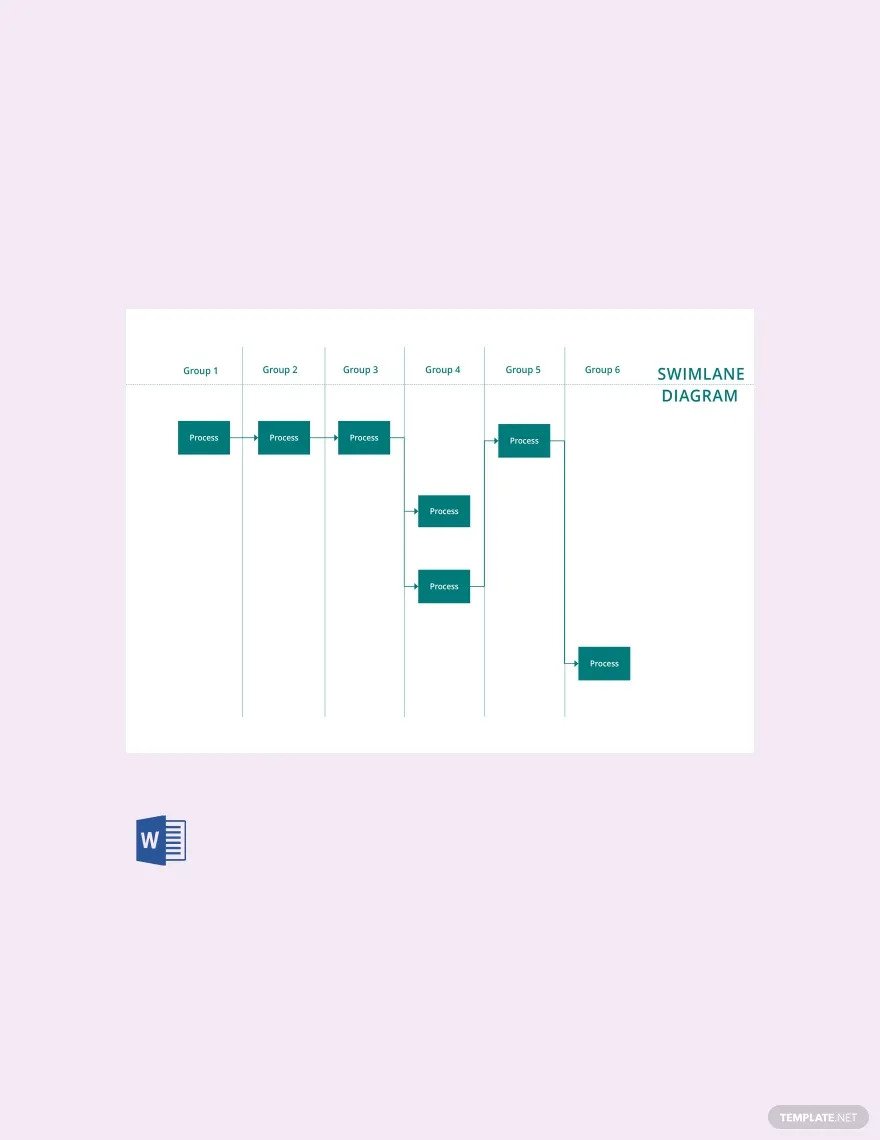
A swim lane diagram is used by businesses and professionals to portray a workflow process from start to finish and informs who is responsible for each method or step in the process. It is also used to record and analyze current conditions of processes and to make a proposal of desired future conditions which eradicate constraints and wasteful practices.
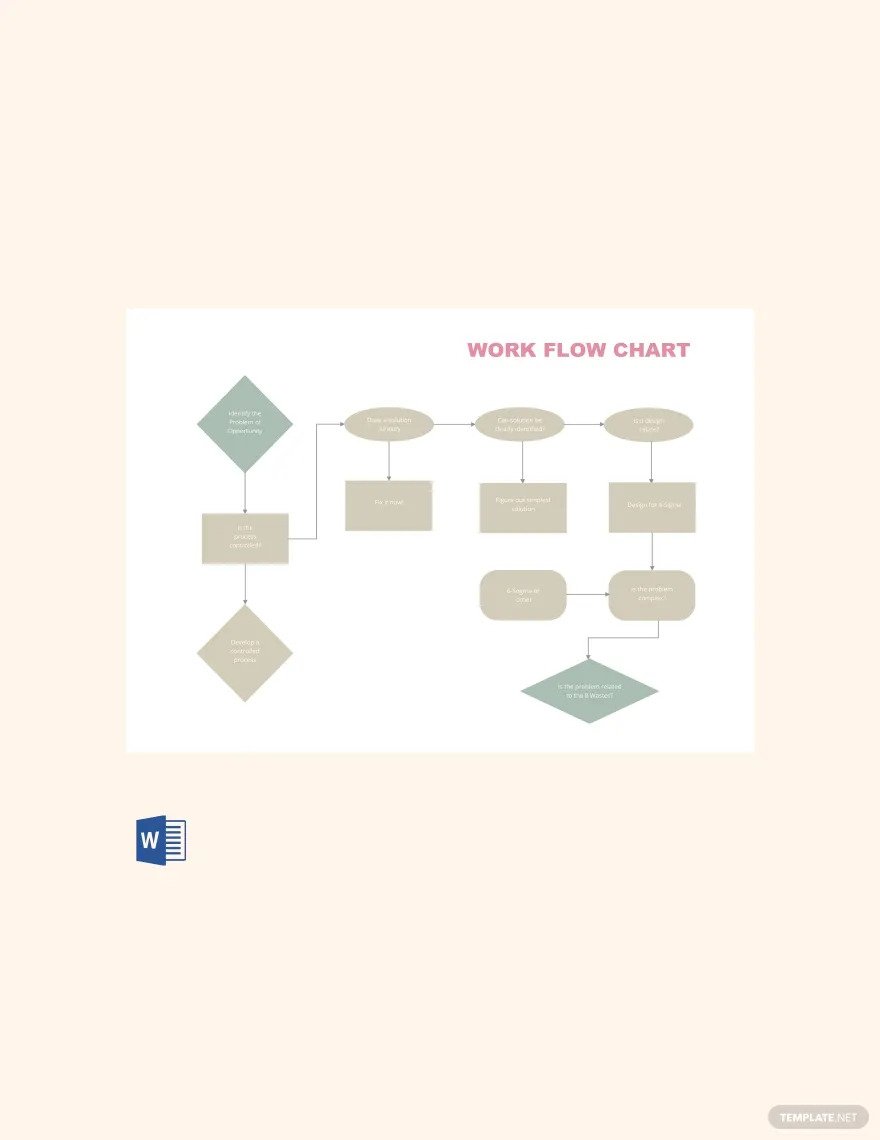
A workflow diagram is essential for many companies, organizations, professionals, and individuals as it gives a clear graphic representation of the business process with the use of standardized shapes and symbols to depict step by step how one’s work is accomplished from the start to finish. It is a crucial management tool for comprehensive work analysis and evaluation.
Use a simple and concise Venn diagram worksheet for students in your school. It is commonly used to establish theory on logical relationships for mathematics, and other subjects while using overlapping circles.
A diagram offers various uses based on the purpose of a business firm, an individual, or a professional. You can see different types of diagrams like dimensional diagrams, circuit diagrams, infographic diagrams, software diagrams, school diagrams, system diagrams, and mapping diagrams in a wide array of fields and industries such as in academic institutions, companies, and others. Below is a list of the common uses, purposes, and importance of diagrams.
Developing a compelling diagram for your presentation is fundamental for businesses and professionals because it maintains the attention of your audience. It provides the viewers with a birds-eye perspective of the information for them to easily absorb the information that you want to convey in your presentation, making your concepts simple and easy to understand.
Diagrams like landscape diagrams, architecture diagrams, website diagrams, plant cell diagrams, human anatomy diagrams, brain diagrams, and other science diagrams are mainly used to provide effective concept visualization of your topic or material. It allows complex ideas and topics to be simplified through visual representation, helping the audience to fully understand the matter being discussed at a single glance.
Many companies, organizations, and individuals use well-structured diagrams such as UML diagrams to communicate fundamental information through accurate and quick graphic design. They use diagrams to explain data, processes, or system functions quickly without using a long written narrative or other resources.
It is very time-consuming if you will go through numerical data to draw valuable inferences from it. With diagrams, you can save time and effort since they are easily understood.
Creating diagrams is beneficial for making a clear and comprehensive analysis of a specific matter. Whether you are making a diagram for business processes, project activities, or a certain idea or topic, a diagram enables users to make comparisons, in-depth analysis, and detect trends in the data to have a forecast of upcoming trends.
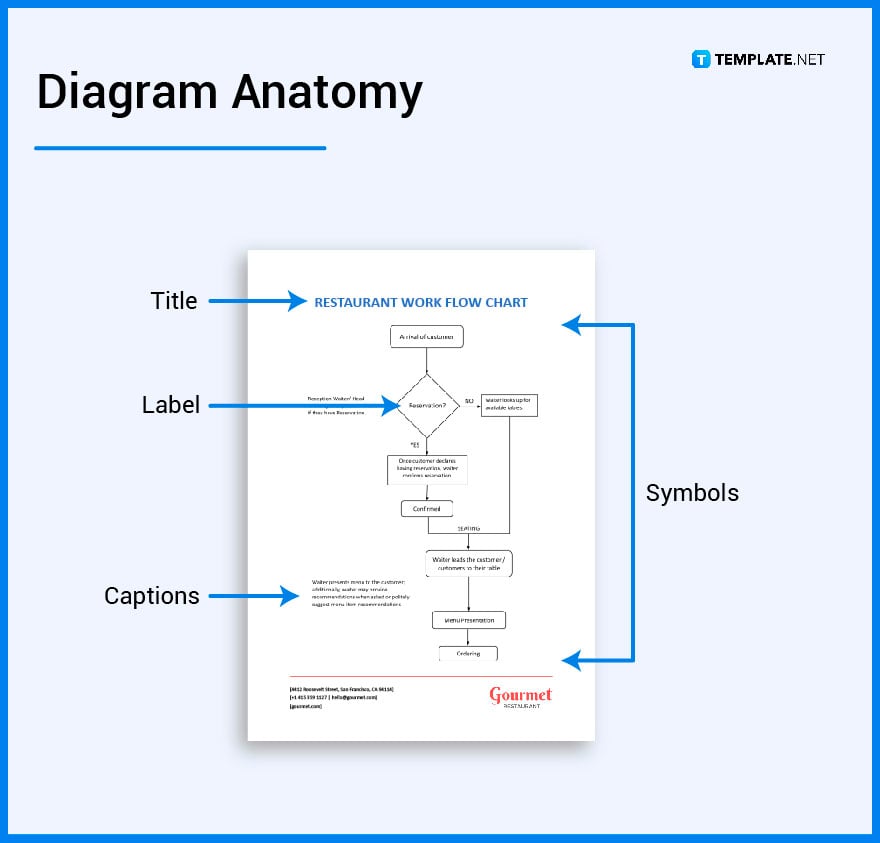
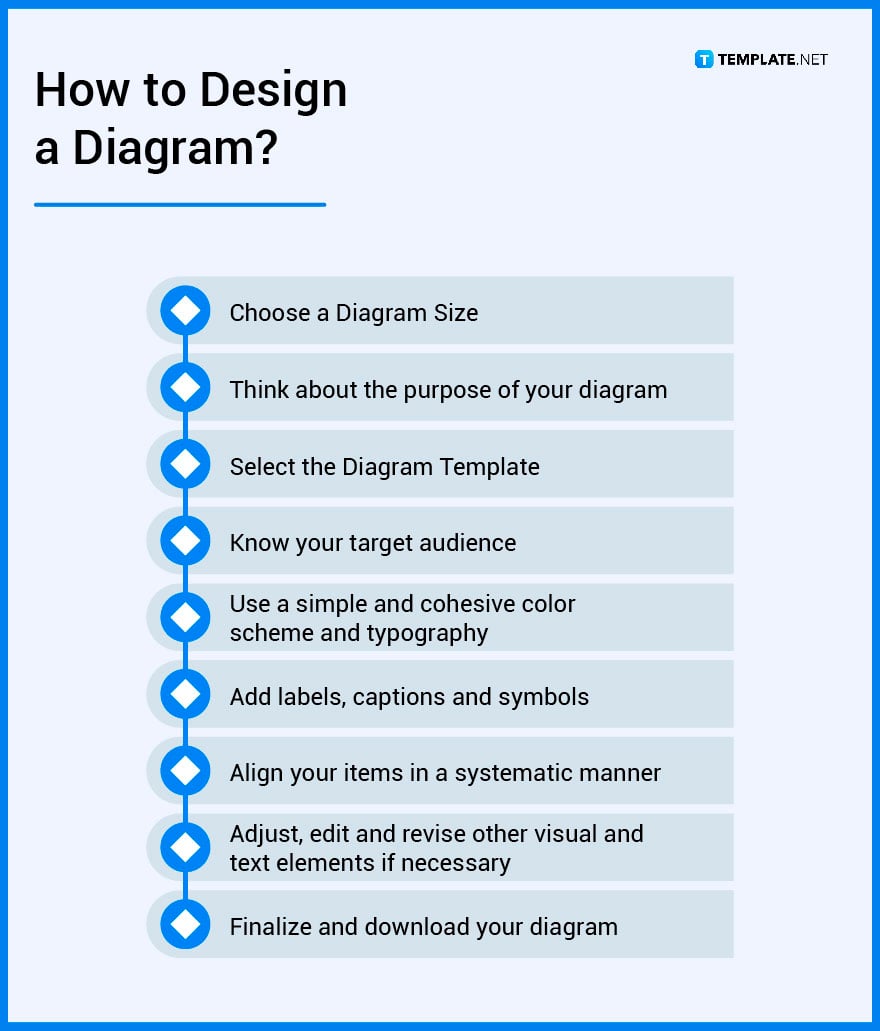
Write the title your diagram. Use clear and simple language when writing your diagram title as it lets you know what the diagram is all about.
Include a label in your diagram. It is a word or phrase assigned to a specific part of a diagram to help your audience identify it. It is usually labeled by an arrow or line connecting the part of the diagram to the word being described as a label.
Add short phrases or sentences to your diagram which are located at the bottom part of the diagram. Provide additional information about what your audience needs to know.
Use some symbols in your diagram to guide your audience in your presentation such as the oval shape, rectangle shape, parallelogram shape, diamond shape, and arrow shape. Draw an oval shape to signify the start or end, or draw a rectangle shape or box to represent a process.
You may refer to the informative article below on how to create diagrams in a different file format:
A diagram is a simple flowchart that explains data, process, system, or workflow in sequence.
A Gantt charts is a type of bar charts that visually depicts the schedule of a project while focusing on tasks and time management.
A diagram is a simple data visualization tool used in project management and quality improvement planning to help businesses, organizations, and individuals to steer projects in the right direction while ensuring optimal quality deliverables.
A Venn diagram is a pictorial representation of overlapping circles which shows similarities and differences between two or more ideas, topics, or things.
A tree diagram is a type of diagram that uses branches to illustrate the varying outcomes of experiments and turns complicated probability questions easy to visualize and comprehend.
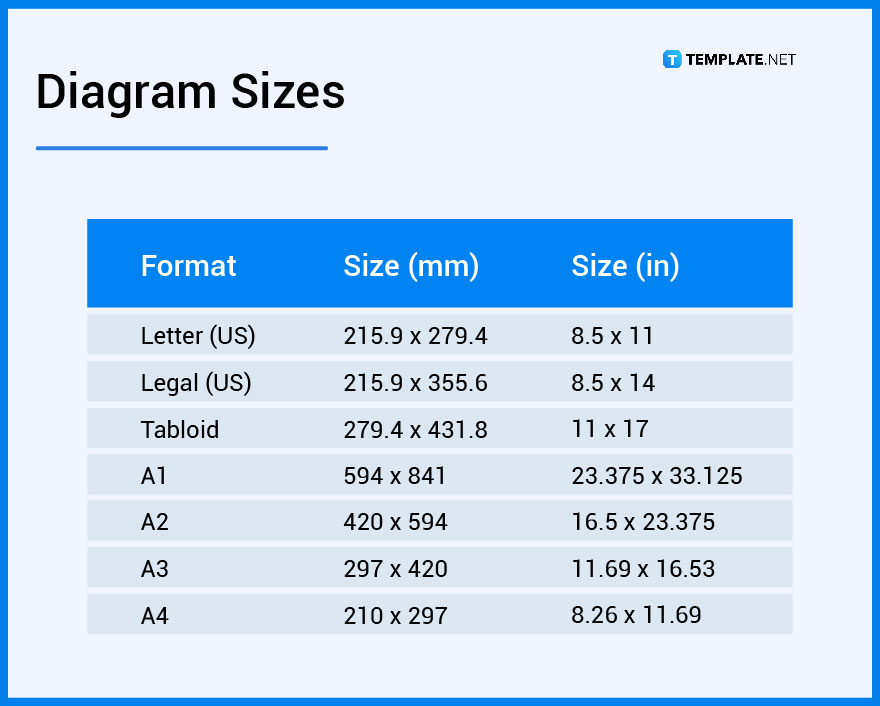
Diagrams have varying standard sizes both in digital and physical formats. The diagram size and format are based on the use and purpose of the business or organization.
There are numerous ways to demonstrate your creativity when it comes to designing diagrams. Check out the following details for more diagram ideas and design inspiration.
The concept of a diagram is a graphic design tool that explains a specific idea, process, or material by using a drawing or illustration to indicate arrangement and relationships.
The essence of a diagram can be observed as a display that portrays relationships and abstract information, a form of visual content formatting devices, and it is composed of building blocks like geometrical shapes and other figures.
To make an effective diagram, choose the appropriate type of diagram according to your project needs, follow the basic standards, use a cohesive color theme, typography, and size, add legends or guides, use consistent lines, align all items, and keep leave whitespaces.
Diagrams usually show different parts of a specific concept, idea, topic, or object and how exactly they work together.
Also known as a level zero data-flow diagram, a context-level diagram is a type of diagram that defines the boundaries of a software system and identifies the information flows between the system and external entities, and other system processes.
When you share diagrams with other people for team collaboration, open the diagram file you have in a document app like Google Drive, right-click on the diagram you want to share, select Share from the context menu, go to the Get Link dialog, click on Change to anyone with the link, and then click done.
A sequence diagram in UML is a type of interactive diagram commonly used by business professionals and software developers as it explains how and in what specific order a group of objects works together.
A data diagram is important because it helps us to fully understand, upgrade, and implement new processes or systems in our business or organization.
Also referred to as a workflow diagram, a working diagram is a graphic overview of business processes and systems.
The common levels in a data flow diagram are 0-level DFD, 1-level DFD, 2-level DFD, and beyond.

To formally invite someone or a group of people to an event or activity, you will need to send out…
![How To Create an ID Card in Google Docs [Template + Example]](https://images.template.net/wp-content/uploads/2023/07/How-To-Create-an-ID-Card-in-Google-Docs-Template-Example-788x443.png)
ID cards are used as a way to represent an individual to the company or organization they work or volunteer…
![How to Make an ID Card in Microsoft Word [Template + Example]](https://images.template.net/wp-content/uploads/2023/07/How-to-Make-an-ID-Card-in-Microsoft-Word-Template-Example-788x443.png)
ID cards are an essential part of any employee working for a company or an organization to be recognized as…
![How To Make/Create a Book Cover in Google Docs [Templates + Examples]](https://images.template.net/wp-content/uploads/2023/07/How-To-Create-a-Book-Cover-in-Google-Docs-788x443.png)
Aside from protecting a book, book covers are specifically designed to attract readers and convey the essence of the book.…
![How To Make/Create a Book Cover in Microsoft Word [Templates + Examples]](https://images.template.net/wp-content/uploads/2023/07/How-To-Create-a-Book-Cover-in-Microsoft-Word-788x443.png)
A book cover is the outer layer of a book that is used to protect its contents. Book covers are…

Job vacancy is a common scenario in companies and organizations. Employees leave for all kinds of reasons and when they…
Save the date sizes are usually the same size as a formal invitation. But there are a number of different…

Script is a popular word that is frequently used in the entertainment world. There are a variety of areas and usages…

Presentations may not look as pleasant as how you design them with pictures, animations, videos, and other graphic designs without…