Free Monthly Financial Summary Report
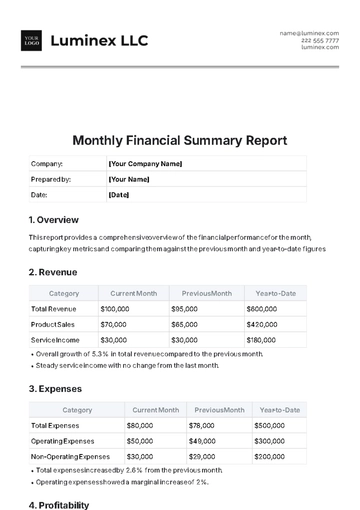
Company: | [Your Company Name] |
Prepared by: | [Your Name] |
Date: | [Date] |
1. Overview
This report provides a comprehensive overview of the financial performance for the month, capturing key metrics and comparing them against the previous month and year-to-date figures.
2. Revenue
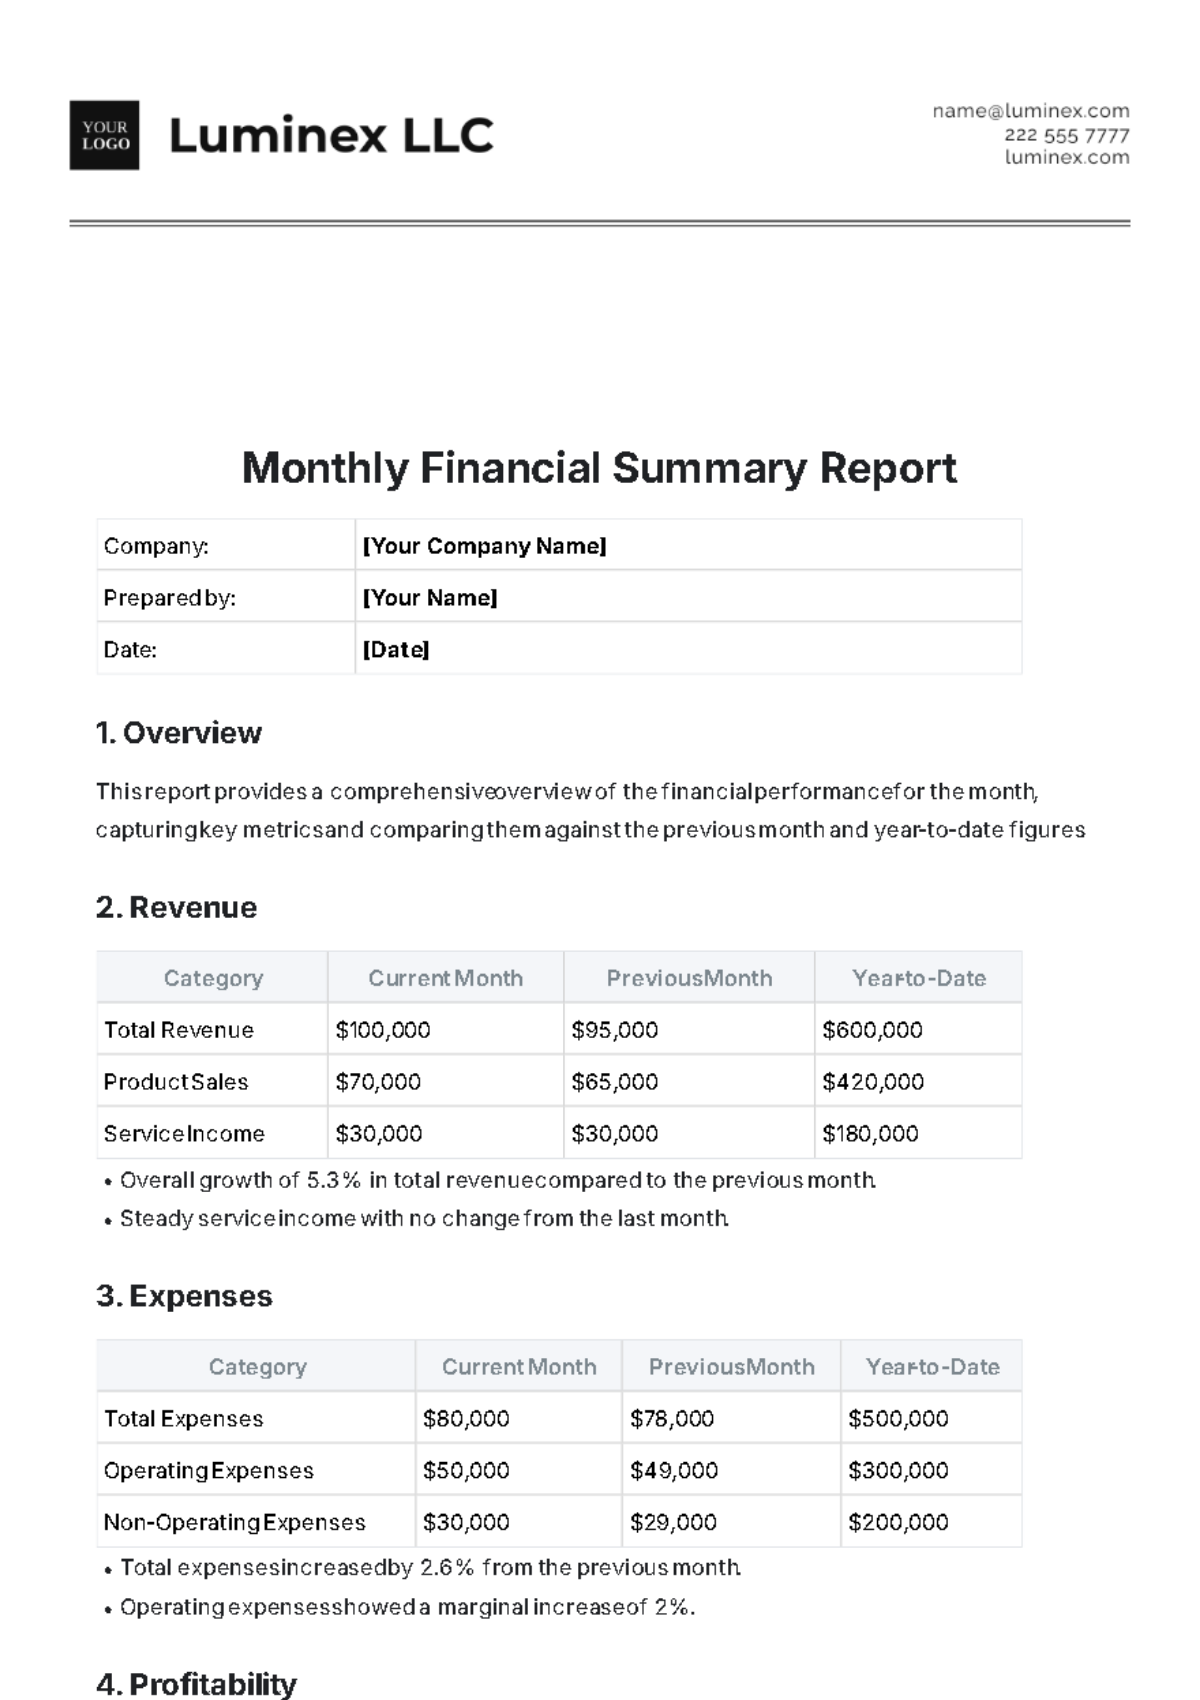
Category | Current Month | Previous Month | Year-to-Date |
|---|---|---|---|
Total Revenue | $100,000 | $95,000 | $600,000 |
Product Sales | $70,000 | $65,000 | $420,000 |
Service Income | $30,000 | $30,000 | $180,000 |
Overall growth of 5.3% in total revenue compared to the previous month.
Steady service income with no change from the last month.
3. Expenses
Category | Current Month | Previous Month | Year-to-Date |
|---|---|---|---|
Total Expenses | $80,000 | $78,000 | $500,000 |
Operating Expenses | $50,000 | $49,000 | $300,000 |
Non-Operating Expenses | $30,000 | $29,000 | $200,000 |
Total expenses increased by 2.6% from the previous month.
Operating expenses showed a marginal increase of 2%.
4. Profitability
Category | Current Month | Previous Month | Year-to-Date |
|---|---|---|---|
Gross Profit | $20,000 | $17,000 | $100,000 |
Net Profit | $10,000 | $9,000 | $50,000 |
Significant increase in gross profit by 17.6% month-over-month.
Net profit growth of 11.1% reflecting effective cost management.
5. Cash Flow
Category | Current Month | Previous Month | Year-to-Date |
|---|---|---|---|
Cash Inflow | $150,000 | $140,000 | $900,000 |
Cash Outflow | $130,000 | $125,000 | $750,000 |
Net Cash Flow | $20,000 | $15,000 | $150,000 |
Positive net cash flow sustained with a 33.3% month-over-month increase.
Improved cash inflow by 7.1% compared to the previous month.
6. Key Highlights
Total revenue grew by 5.3%, driven primarily by product sales.
Maintained steady service income.
Total expenses increased slightly by 2.6%.
Net profit improved by 11.1%, demonstrating effective cost control.
Cash flow remained strong with a month-over-month increase in net cash flow by 33.3%.
- 100% Customizable, free editor
- Access 1 Million+ Templates, photo’s & graphics
- Download or share as a template
- Click and replace photos, graphics, text, backgrounds
- Resize, crop, AI write & more
- Access advanced editor
This Monthly Financial Summary Report Template from Template.net may help you monitor your financial success. This comprehensive structure for recording and evaluating monthly financial data is provided by this editable and configurable template. Create comprehensive, well-structured, and polished financial reports quickly and easily with our AI Editor Tool. Try it today!
You may also like
- Sales Report
- Daily Report
- Project Report
- Business Report
- Weekly Report
- Incident Report
- Annual Report
- Report Layout
- Report Design
- Progress Report
- Marketing Report
- Company Report
- Monthly Report
- Audit Report
- Status Report
- School Report
- Reports Hr
- Management Report
- Project Status Report
- Handover Report
- Health And Safety Report
- Restaurant Report
- Construction Report
- Research Report
- Evaluation Report
- Investigation Report
- Employee Report
- Advertising Report
- Weekly Status Report
- Project Management Report
- Finance Report
- Service Report
- Technical Report
- Meeting Report
- Quarterly Report
- Inspection Report
- Medical Report
- Test Report
- Summary Report
- Inventory Report
- Valuation Report
- Operations Report
- Payroll Report
- Training Report
- Job Report
- Case Report
- Performance Report
- Board Report
- Internal Audit Report
- Student Report
- Monthly Management Report
- Small Business Report
- Accident Report
- Call Center Report
- Activity Report
- IT and Software Report
- Internship Report
- Visit Report
- Product Report
- Book Report
- Property Report
- Recruitment Report
- University Report
- Event Report
- SEO Report
- Conference Report
- Narrative Report
- Nursing Home Report
- Preschool Report
- Call Report
- Customer Report
- Employee Incident Report
- Accomplishment Report
- Social Media Report
- Work From Home Report
- Security Report
- Damage Report
- Quality Report
- Internal Report
- Nurse Report
- Real Estate Report
- Hotel Report
- Equipment Report
- Credit Report
- Field Report
- Non Profit Report
- Maintenance Report
- News Report
- Survey Report
- Executive Report
- Law Firm Report
- Advertising Agency Report
- Interior Design Report
- Travel Agency Report
- Stock Report
- Salon Report
- Bug Report
- Workplace Report
- Action Report
- Investor Report
- Cleaning Services Report
- Consulting Report
- Freelancer Report
- Site Visit Report
- Trip Report
- Classroom Observation Report
- Vehicle Report
- Final Report
- Software Report

