Free Marketing Cost per Lead (CPL) Report
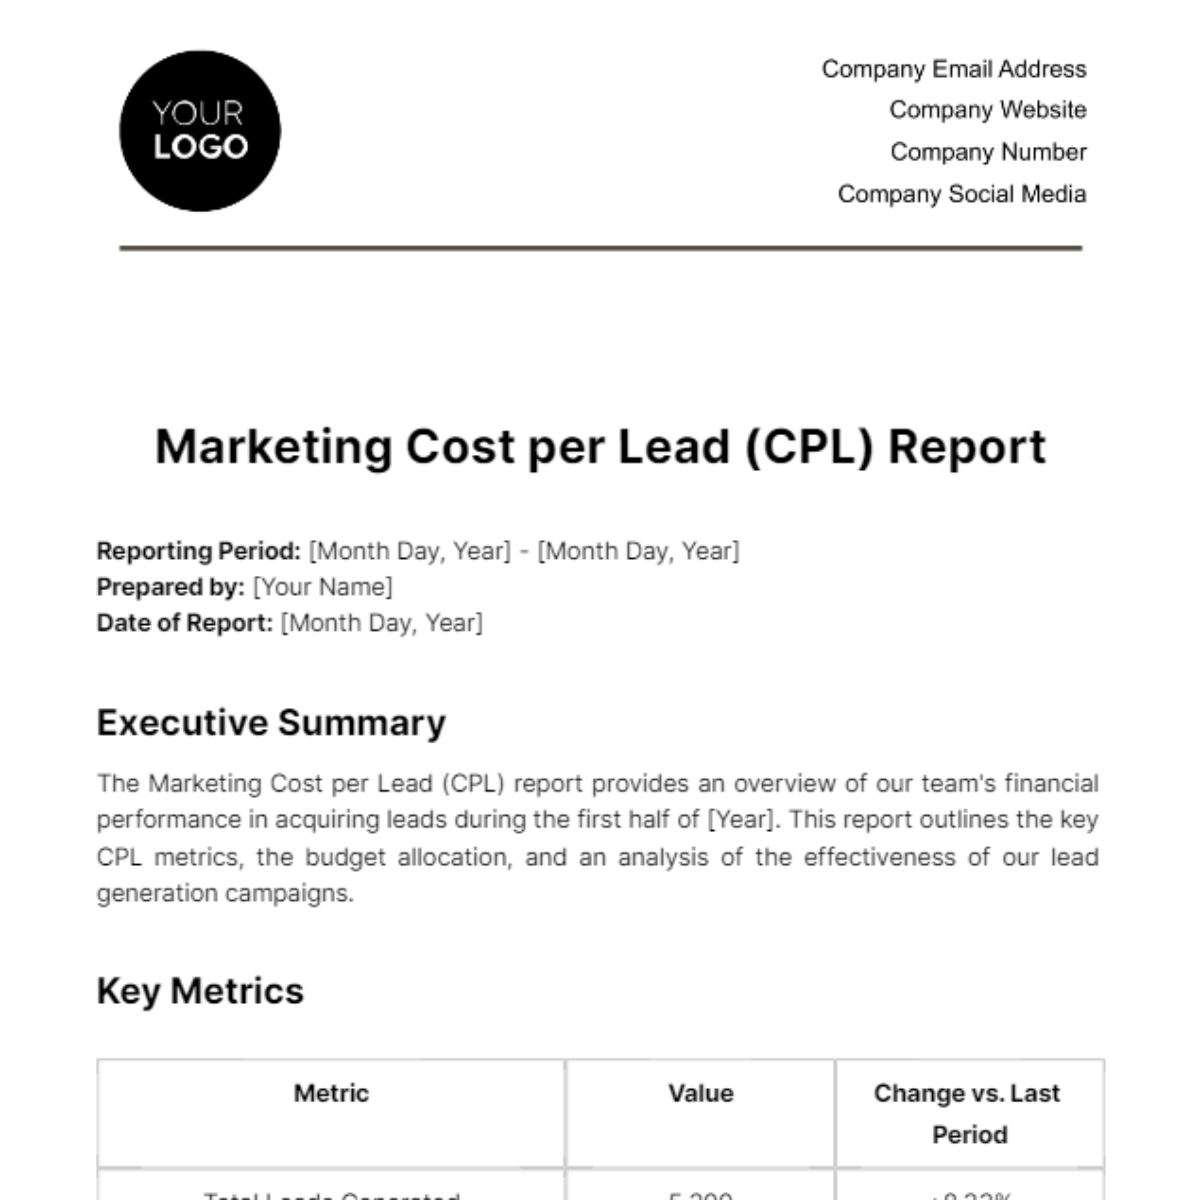
Reporting Period: [Month Day, Year] - [Month Day, Year]
Prepared by: [Your Name]
Date of Report: [Month Day, Year]
Executive Summary
The Marketing Cost per Lead (CPL) report provides an overview of our team's financial performance in acquiring leads during the first half of [Year]. This report outlines the key CPL metrics, the budget allocation, and an analysis of the effectiveness of our lead generation campaigns.
Key Metrics
Metric | Value | Change vs. Last Period |
Total Leads Generated | 5,200 | +8.33% |
Total Marketing Budget | ||
Total CPL | ||
Leads Conversion Rate | ||
Total Revenue Generated |
Budget Allocation
Our marketing budget for the first half of [YYYY] was $[000,000], allocated as follows:
Marketing Channel | Budget Allocation | CPL |
Social Media Advertising | $90,000 | $42.86 |
Content Marketing | ||
Email Marketing | ||
Paid Search Advertising | ||
Event Sponsorship |
Note: The CPL for each channel is calculated by dividing the channel's spend by the number of leads generated.
Analysis
Total Leads Generated: We achieved a total of [0,000] leads, representing an [00]% increase from the previous period. This growth can be attributed to a strategic shift in our content marketing efforts and the successful integration of our various marketing channels.
Total Marketing Budget: The budget increased by [00]% compared to the previous period. This increase allowed us to allocate more resources to effective lead generation channels, resulting in a higher number of leads.
CPL: The overall CPL for the period was $[00.00], which is a [0.00]% decrease from the previous period. This reduction is a positive indicator of improved cost efficiency in our lead generation efforts.
Leads Conversion Rate: Our leads conversion rate increased by [0.00]%, indicating that our lead quality and nurturing processes have improved. This, in turn, contributed to the higher revenue generated.
Total Revenue Generated: We generated a total of $[0,00,000] in revenue, which is a [00.00] % increase from the previous period. This demonstrates that our marketing investments are translating into tangible returns.
Action Plan
Continue to monitor the CPL for each marketing channel and allocate resources to the most cost-effective channels.
Invest further in content marketing and email marketing, which have shown promise in lead generation with relatively low CPL.
Explore opportunities for lead nurturing and conversion optimization to enhance our lead quality and increase the conversion rate.
Evaluate the performance of event sponsorship to ensure that it aligns with our lead generation and revenue objectives.
Continuously monitor the impact of budget allocation on revenue generation to optimize our marketing strategies.
Conclusion
The first half of [Year] has seen a positive trend in lead generation, cost-efficiency, and revenue generation. We are committed to refining our strategies and making data-driven decisions to ensure continued success in the coming months. By effectively managing our marketing budget and CPL, we aim to achieve even greater results in the second half of the year.
For questions or further information, please contact [Your Contact Information].
- 100% Customizable, free editor
- Access 1 Million+ Templates, photo’s & graphics
- Download or share as a template
- Click and replace photos, graphics, text, backgrounds
- Resize, crop, AI write & more
- Access advanced editor
Discover efficiency with Template.net's Marketing CPL Report Template. This editable and customizable template, powered by an advanced AI Editor Tool, simplifies tracking costs per lead. Dive into detailed analyses effortlessly, optimizing your marketing strategy. Elevate your campaigns and budgets with precision. Unleash the power of data-driven decisions for unparalleled marketing success.
You may also like
- Sales Report
- Daily Report
- Project Report
- Business Report
- Weekly Report
- Incident Report
- Annual Report
- Report Layout
- Report Design
- Progress Report
- Marketing Report
- Company Report
- Monthly Report
- Audit Report
- Status Report
- School Report
- Reports Hr
- Management Report
- Project Status Report
- Handover Report
- Health And Safety Report
- Restaurant Report
- Construction Report
- Research Report
- Evaluation Report
- Investigation Report
- Employee Report
- Advertising Report
- Weekly Status Report
- Project Management Report
- Finance Report
- Service Report
- Technical Report
- Meeting Report
- Quarterly Report
- Inspection Report
- Medical Report
- Test Report
- Summary Report
- Inventory Report
- Valuation Report
- Operations Report
- Payroll Report
- Training Report
- Job Report
- Case Report
- Performance Report
- Board Report
- Internal Audit Report
- Student Report
- Monthly Management Report
- Small Business Report
- Accident Report
- Call Center Report
- Activity Report
- IT and Software Report
- Internship Report
- Visit Report
- Product Report
- Book Report
- Property Report
- Recruitment Report
- University Report
- Event Report
- SEO Report
- Conference Report
- Narrative Report
- Nursing Home Report
- Preschool Report
- Call Report
- Customer Report
- Employee Incident Report
- Accomplishment Report
- Social Media Report
- Work From Home Report
- Security Report
- Damage Report
- Quality Report
- Internal Report
- Nurse Report
- Real Estate Report
- Hotel Report
- Equipment Report
- Credit Report
- Field Report
- Non Profit Report
- Maintenance Report
- News Report
- Survey Report
- Executive Report
- Law Firm Report
- Advertising Agency Report
- Interior Design Report
- Travel Agency Report
- Stock Report
- Salon Report
- Bug Report
- Workplace Report
- Action Report
- Investor Report
- Cleaning Services Report
- Consulting Report
- Freelancer Report
- Site Visit Report
- Trip Report
- Classroom Observation Report
- Vehicle Report
- Final Report
- Software Report
