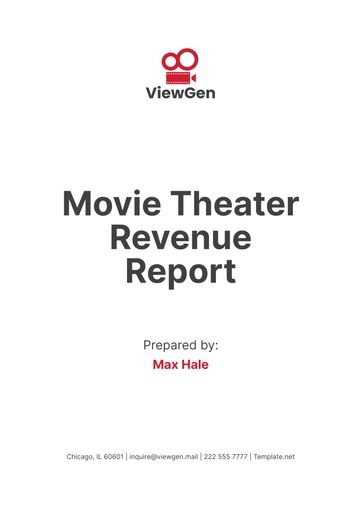
Free Movie Theater Revenue Report
I. Executive Summary
The purpose of this report is to provide a comprehensive overview of the revenue earned by [Your Company Name] for the year [2050]. This report includes detailed revenue breakdowns by different sources, comparative analysis with previous years, and key insights into revenue trends and performance. The objective is to offer a clear understanding of the financial performance of the theater and identify areas of strength and opportunities for growth.
II. Revenue Overview
The revenue overview provides a summary of the total revenue earned by [Your Company Name] throughout the year [2050]. This section highlights the overall financial performance of the theater, offering a snapshot of how various revenue streams have contributed to the annual total.
A. Total Revenue Breakdown
The total revenue earned in [2050] amounts to [$12,500,000]. This figure includes all sources of income generated by the theater throughout the year.
Revenue Source | Amount |
|---|---|
Ticket Sales | $6,000,000 |
Concessions | $3,500,000 |
Private Events | $1,800,000 |
Advertising and Sponsorship | $800,000 |
Merchandise Sales | $400,000 |
B. Percentage of Total Revenue
Short Analysis:
Ticket Sales: Contributed the largest share of revenue, reflecting strong attendance and successful film releases. This indicates a robust market demand and effective programming.
Concessions: Accounted for a significant portion of revenue, underscoring the importance of food and beverage sales in the theater’s overall financial performance.
Private Events: Generated a substantial income, highlighting the theater’s role as a venue for corporate and private functions.
Advertising and Sponsorship: Provided additional revenue, indicating successful partnerships and promotional activities.
Merchandise Sales: Contributed a smaller portion of revenue, suggesting opportunities for growth in this area.
III. Revenue by Quarter
Analyzing revenue by quarter offers insights into seasonal trends and the performance of the theater throughout different times of the year. This section details the revenue earned in each quarter of [2050], providing a comparative view of financial performance over the year.
A. Quarterly Revenue Breakdown
Quarter | Revenue | Percentage of Total Annual Revenue |
|---|---|---|
Q1 | $2,900,000 | 23% |
Q2 | $3,200,000 | 26% |
Q3 | $3,500,000 | 28% |
Q4 | $2,900,000 | 23% |
B. Q1 and Q4 Performance
Q1 Revenue Trends
Seasonal Impact: The first quarter (Q1) typically encompasses the post-holiday period, which often sees a reduction in consumer spending and entertainment budgets. This trend can be attributed to the fact that consumers tend to spend more during the holiday season and may cut back in the subsequent months.
Film Release Schedule: Fewer major film releases are generally scheduled for Q1, leading to lower cinema attendance. Studios often release blockbuster films during peak periods, such as summer and holiday seasons, resulting in less foot traffic and revenue in the early months of the year.
Q4 Revenue Trends
End-of-Year Spending: Although Q4 includes the holiday season, which can boost spending, the revenue in this quarter was relatively flat compared to the mid-year peaks. This may indicate a shift in consumer behavior, where spending on entertainment might be balanced with other holiday expenses.
Post-Holiday Slump: Following the holiday rush, there is often a consumer spending slowdown in early January, impacting Q4 revenue. Additionally, the theater may have fewer high-profile film releases towards the end of the year, contributing to the lower revenue figures.
C. Q2 and Q3 Performance
Q2 Revenue Trends
Successful Film Releases: The second quarter (Q2) often benefits from the release of blockbuster films and major studio productions. These releases draw large audiences and contribute significantly to increased ticket sales and higher overall revenue.
Seasonal Attendance Increase: As Q2 includes the beginning of summer, it aligns with school vacations and increased leisure activities. The warmer weather and extended daylight hours encourage more frequent visits to the theater, driving up attendance and concession sales.
Q3 Revenue Trends
Peak Season Advantage: The third quarter (Q3), which includes summer months, is typically a strong period for theaters due to the release of high-profile movies and family-friendly content. This peak season drives substantial ticket sales and concession revenue, as people are more likely to engage in entertainment activities during the summer.
Event Hosting Success: In addition to increased film attendance, Q3 may also benefit from successful event hosting. During this period, the theater may host a higher number of private events, such as corporate functions and community gatherings, further boosting revenue.
The relatively lower revenue in Q1 and Q4 can be attributed to seasonal factors, including reduced consumer spending after the holiday season and fewer major film releases. These periods typically experience lower foot traffic and spending, impacting overall revenue.
Conversely, Q2 and Q3 show higher revenue, driven by successful film releases, increased attendance during peak seasons, and effective event hosting. The combination of blockbuster films and favorable seasonal conditions contributes to the theater's stronger financial performance during these quarters.
IV. Comparative Analysis
Comparing the current year’s revenue with that of previous years provides valuable insights into the theater's financial growth and performance trends. This section compares the revenue earned in [2050] with that of the previous year, highlighting changes and trends over the past year.
A. Year-over-Year Revenue Comparison
Revenue Source | Previous Year Revenue | Current Year Revenue | Change |
|---|---|---|---|
Ticket Sales | $5,500,000 | $6,000,000 | +9.1% |
Concessions | $3,200,000 | $3,500,000 | +9.4% |
Private Events | $1,500,000 | $1,800,000 | +20.0% |
Advertising and Sponsorship | $700,000 | $800,000 | +14.3% |
Merchandise Sales | $350,000 | $400,000 | +14.3% |
Ticket Sales saw a [9.1%] increase, indicating a positive trend in attendance and market demand. Concessions grew by [9.4%], reflecting successful promotions and product offerings. Private Events experienced a notable [20%] increase, suggesting improved marketing and event management.
Advertising and Sponsorship grew by [14.3%], showing successful partnerships and effective promotional strategies. Merchandise Sales increased by [14.3%], pointing to potential for further growth in this area.
V. Key Insights and Recommendations
Identifying key insights and making recommendations based on the revenue data can help inform strategic decisions and improve future performance. This section highlights the key findings from the revenue analysis and suggests areas for potential growth and improvement.
A. Key Insights
Strong Performance in Ticket Sales: The increase in ticket sales indicates a positive reception of film offerings and successful marketing strategies.
Growth in Private Events: The rise in revenue from private events suggests that the theater is effectively capitalizing on its venue space for various functions.
Opportunity in Merchandise: The growth in merchandise sales presents an opportunity to further enhance product offerings and increase revenue in this area.
B. Recommendations
Enhance Marketing Efforts: Continue to invest in marketing and promotional activities to sustain growth in ticket sales and attract more patrons.
Expand Private Event Offerings: Explore additional opportunities for private events and corporate functions, including new packages and services.
Increase Merchandise Sales: Develop new merchandise items and promotional campaigns to boost merchandise sales and enhance brand visibility.
VI. Conclusion
The revenue earned by [Your Company Name] in [2050] demonstrates a strong financial performance and growth across various revenue streams. The increase in ticket sales, private events, and concessions reflects successful strategies and market demand. By implementing the recommendations provided, [Your Company Name] can continue to build on its success and further enhance its financial performance in the coming years.
- 100% Customizable, free editor
- Access 1 Million+ Templates, photo’s & graphics
- Download or share as a template
- Click and replace photos, graphics, text, backgrounds
- Resize, crop, AI write & more
- Access advanced editor
Keep track of your financial performance with the Movie Theater Revenue Report Template from Template.net. This editable and customizable template features a detailed and organized design, perfect for presenting revenue data clearly and effectively. The layout allows for the inclusion of monthly or quarterly analysis, helping stakeholders understand the financial health of the theater.
You may also like
- Sales Report
- Daily Report
- Project Report
- Business Report
- Weekly Report
- Incident Report
- Annual Report
- Report Layout
- Report Design
- Progress Report
- Marketing Report
- Company Report
- Monthly Report
- Audit Report
- Status Report
- School Report
- Reports Hr
- Management Report
- Project Status Report
- Handover Report
- Health And Safety Report
- Restaurant Report
- Construction Report
- Research Report
- Evaluation Report
- Investigation Report
- Employee Report
- Advertising Report
- Weekly Status Report
- Project Management Report
- Finance Report
- Service Report
- Technical Report
- Meeting Report
- Quarterly Report
- Inspection Report
- Medical Report
- Test Report
- Summary Report
- Inventory Report
- Valuation Report
- Operations Report
- Payroll Report
- Training Report
- Job Report
- Case Report
- Performance Report
- Board Report
- Internal Audit Report
- Student Report
- Monthly Management Report
- Small Business Report
- Accident Report
- Call Center Report
- Activity Report
- IT and Software Report
- Internship Report
- Visit Report
- Product Report
- Book Report
- Property Report
- Recruitment Report
- University Report
- Event Report
- SEO Report
- Conference Report
- Narrative Report
- Nursing Home Report
- Preschool Report
- Call Report
- Customer Report
- Employee Incident Report
- Accomplishment Report
- Social Media Report
- Work From Home Report
- Security Report
- Damage Report
- Quality Report
- Internal Report
- Nurse Report
- Real Estate Report
- Hotel Report
- Equipment Report
- Credit Report
- Field Report
- Non Profit Report
- Maintenance Report
- News Report
- Survey Report
- Executive Report
- Law Firm Report
- Advertising Agency Report
- Interior Design Report
- Travel Agency Report
- Stock Report
- Salon Report
- Bug Report
- Workplace Report
- Action Report
- Investor Report
- Cleaning Services Report
- Consulting Report
- Freelancer Report
- Site Visit Report
- Trip Report
- Classroom Observation Report
- Vehicle Report
- Final Report
- Software Report


