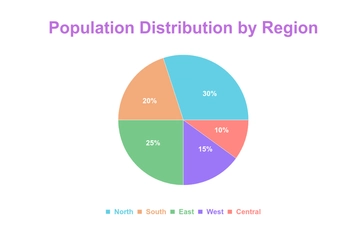
A clean pie graph chart for showing population distribution by region, professionally designed by Template.net, with a five-slice pie chart, a color-coded legend and a purple title in soft purple, aqua blue and light green.
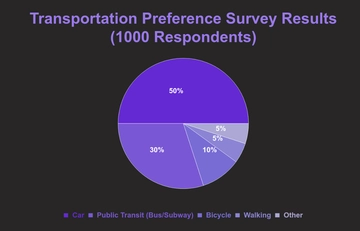
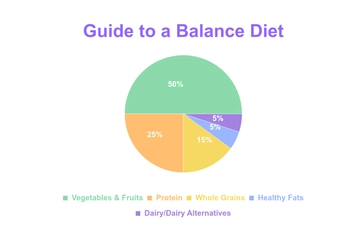
A clean pie graph chart for showing population distribution by region, professionally designed by Template.net, with a five-slice pie chart, a color-coded legend and a purple title in soft purple, aqua blue and light green.