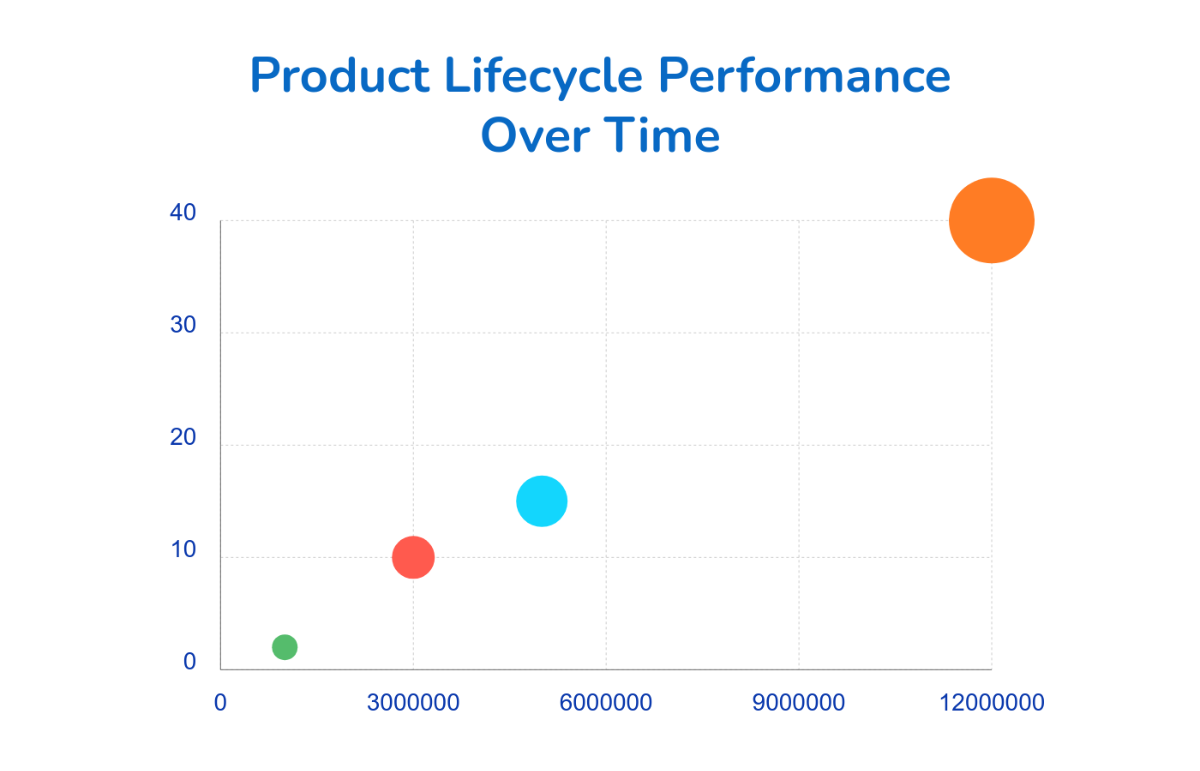
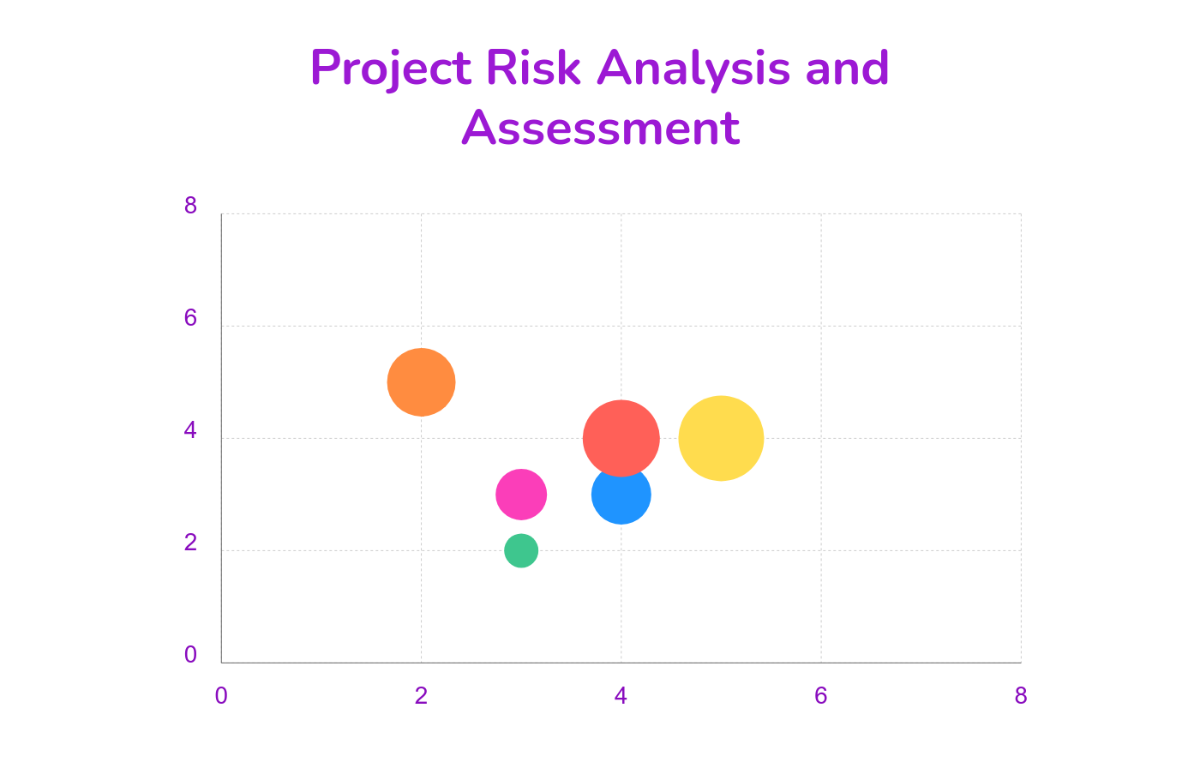
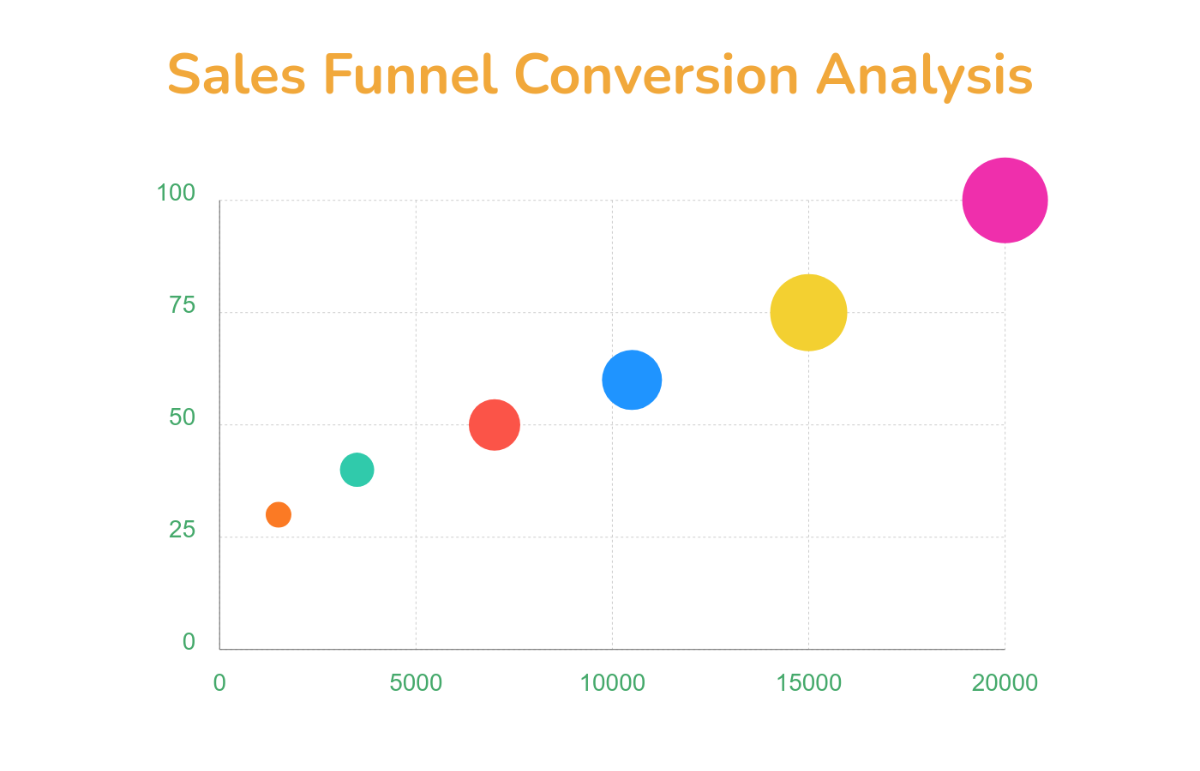
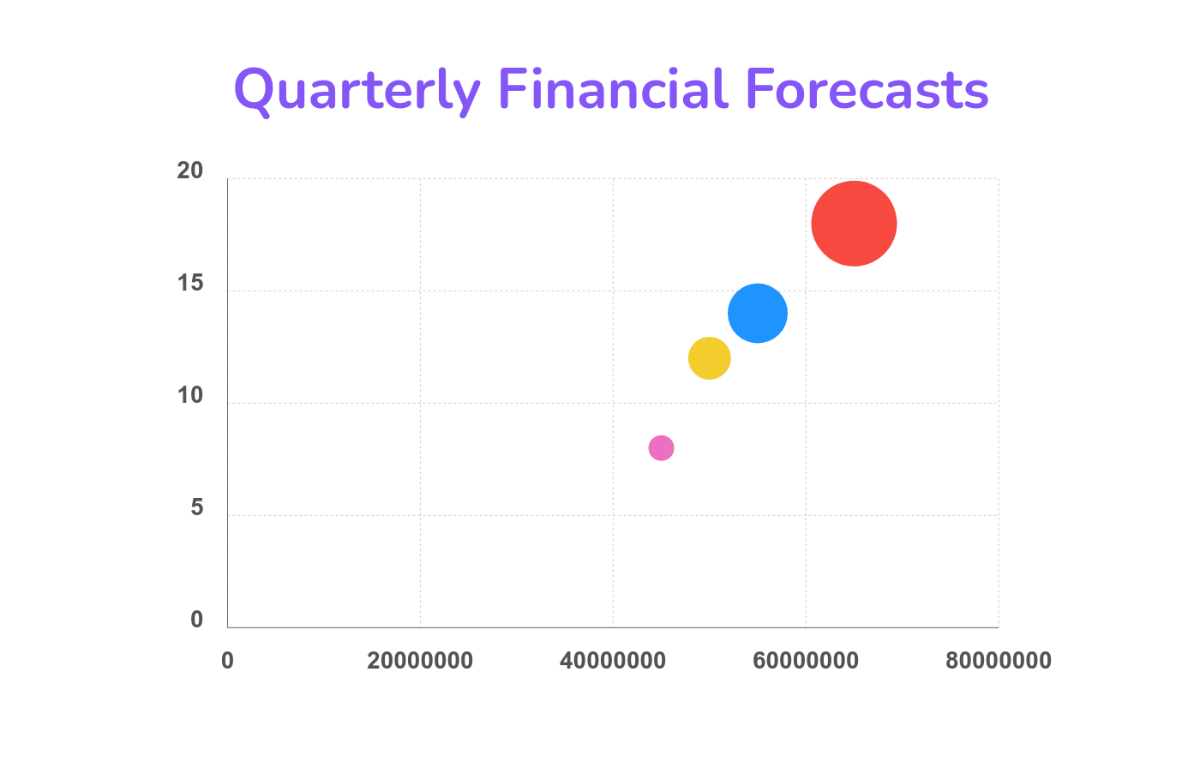
Bring Your Data Visualization to Life with Bubble Chart Templates from Template.net
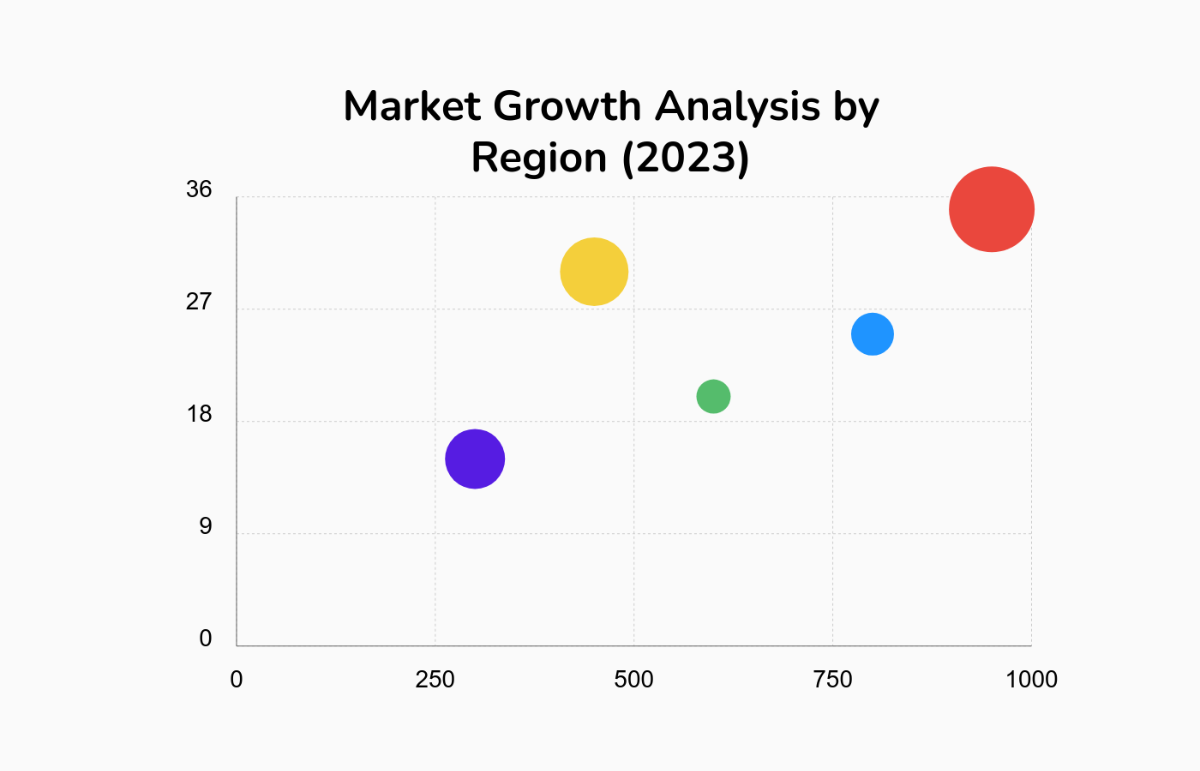
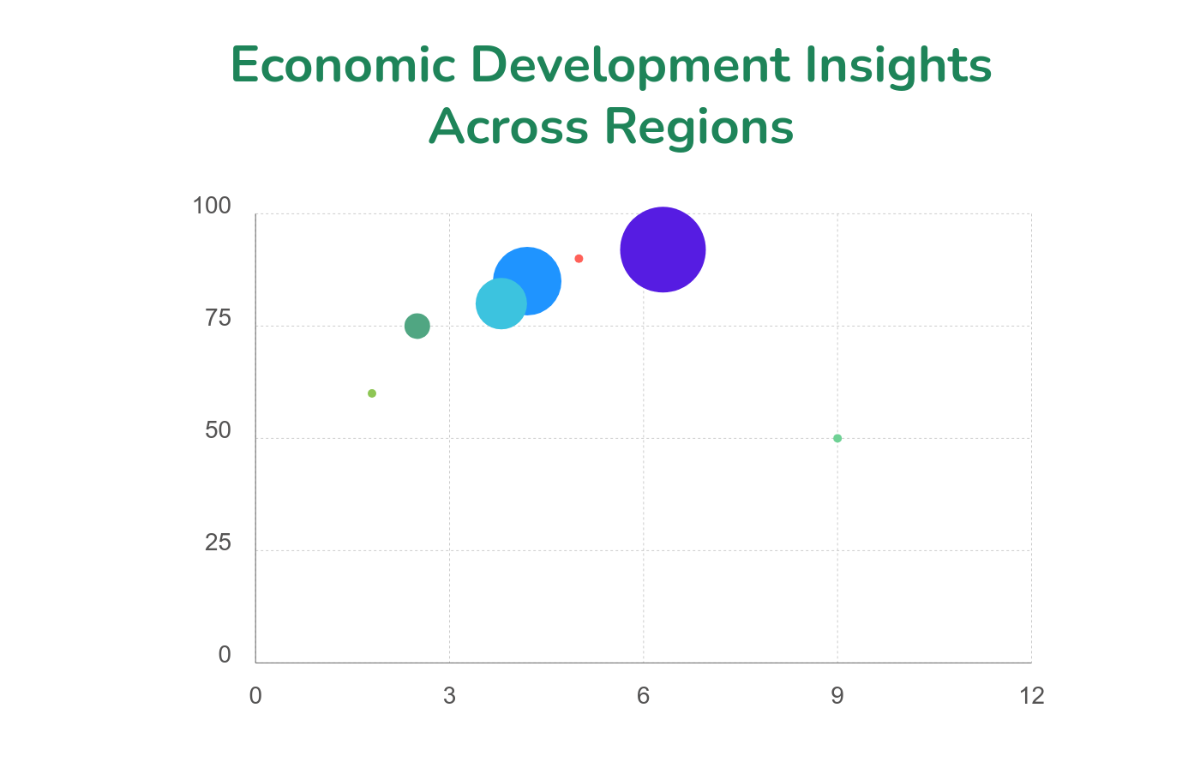
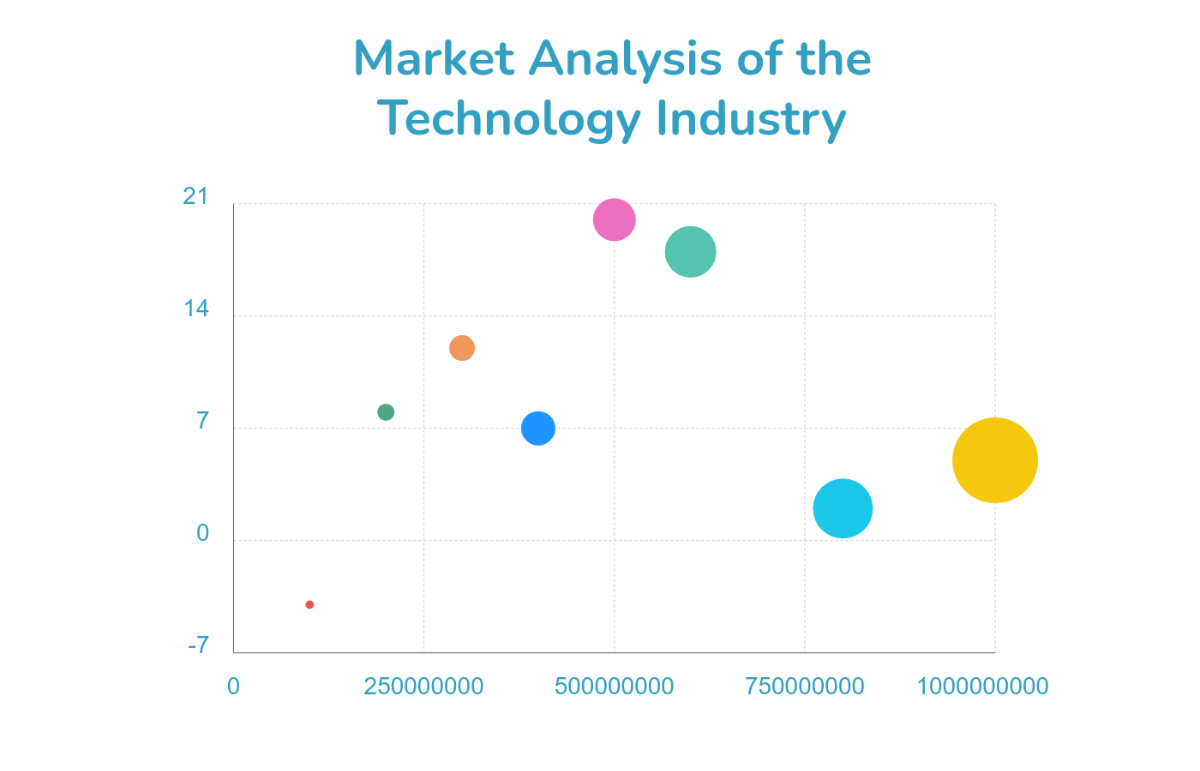
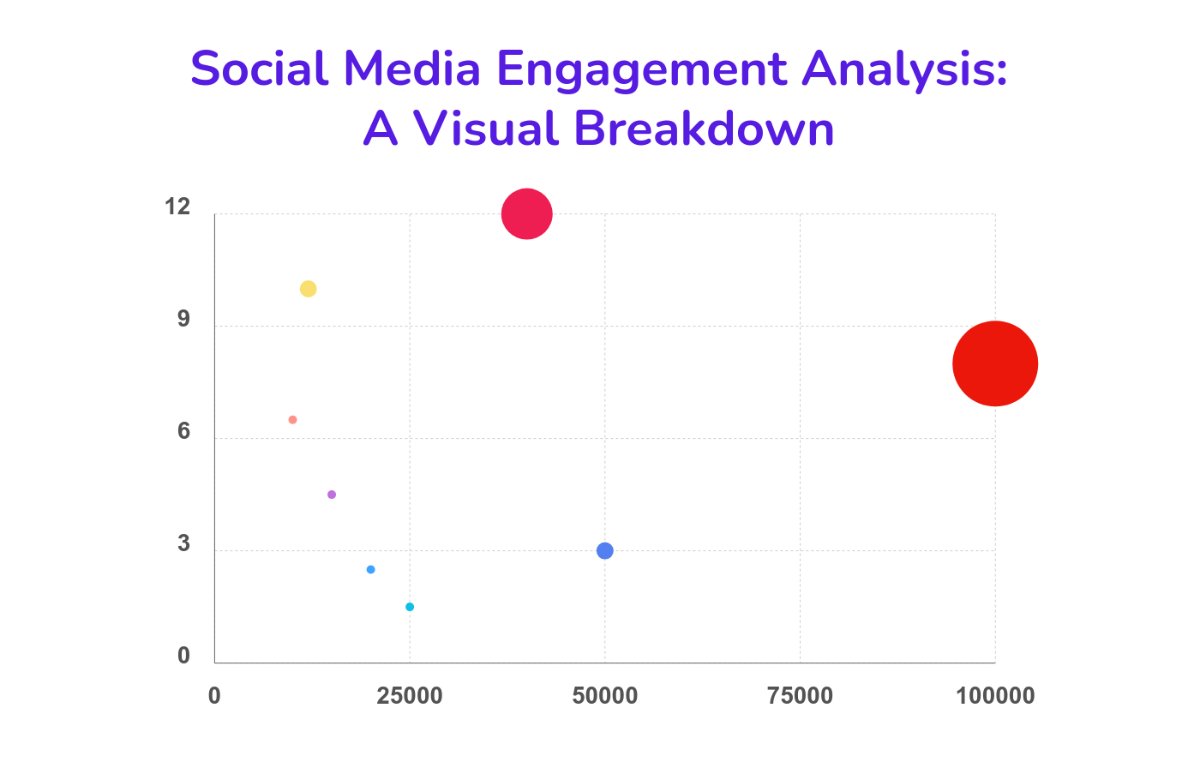
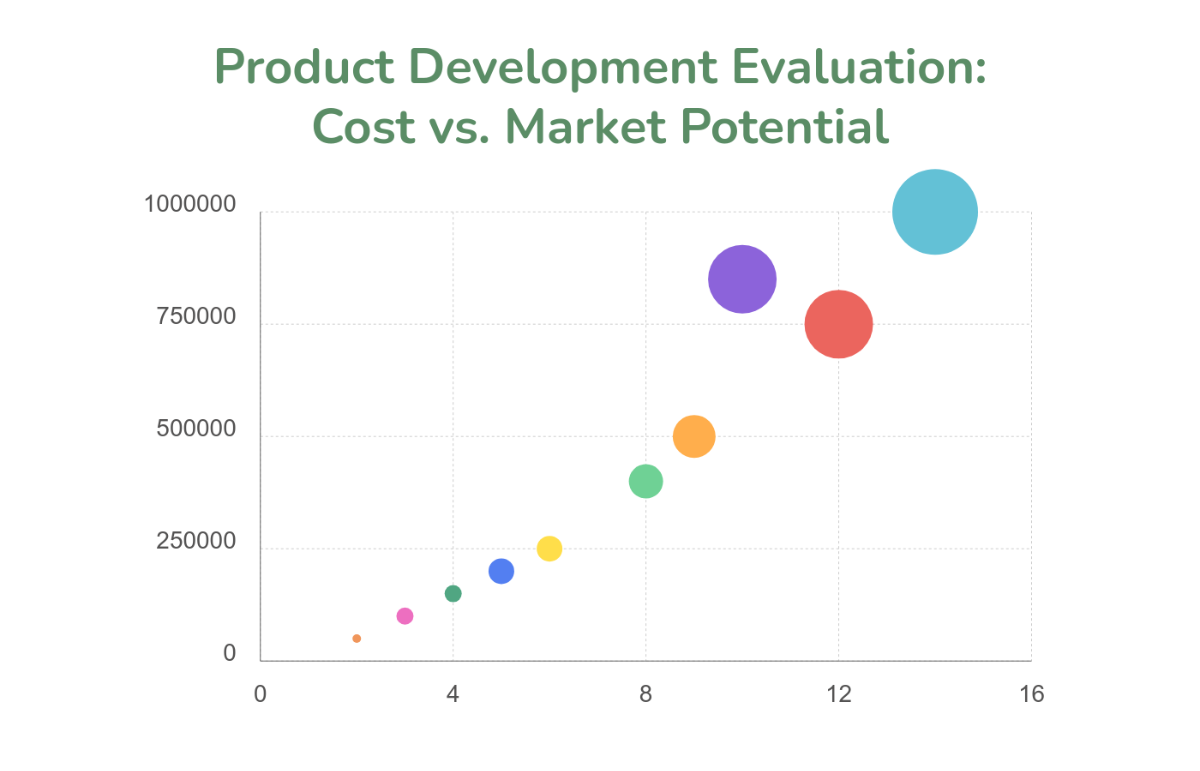
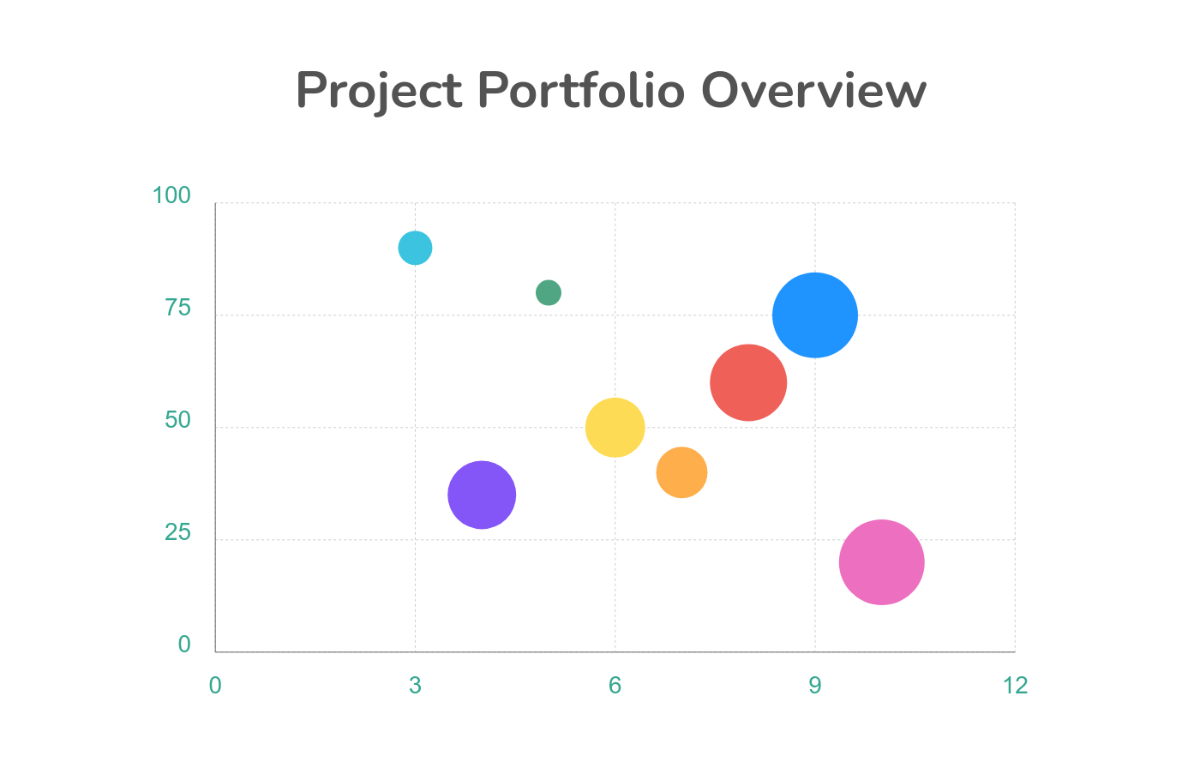
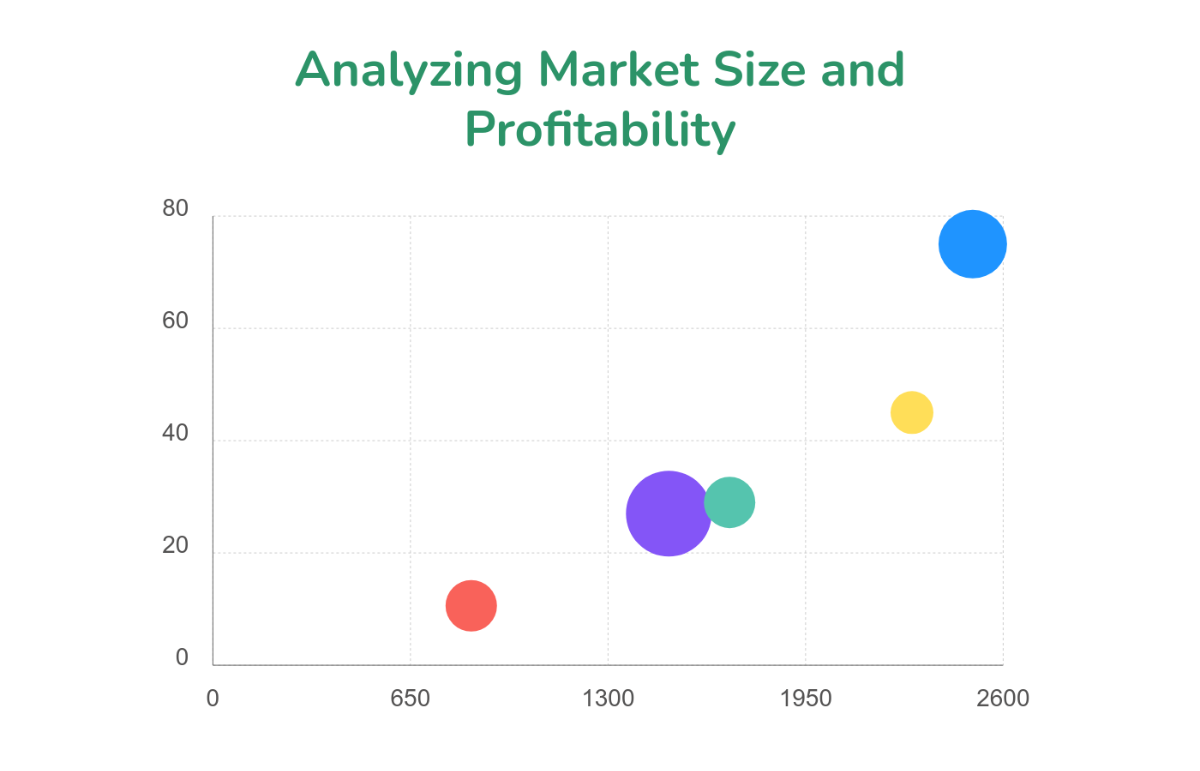
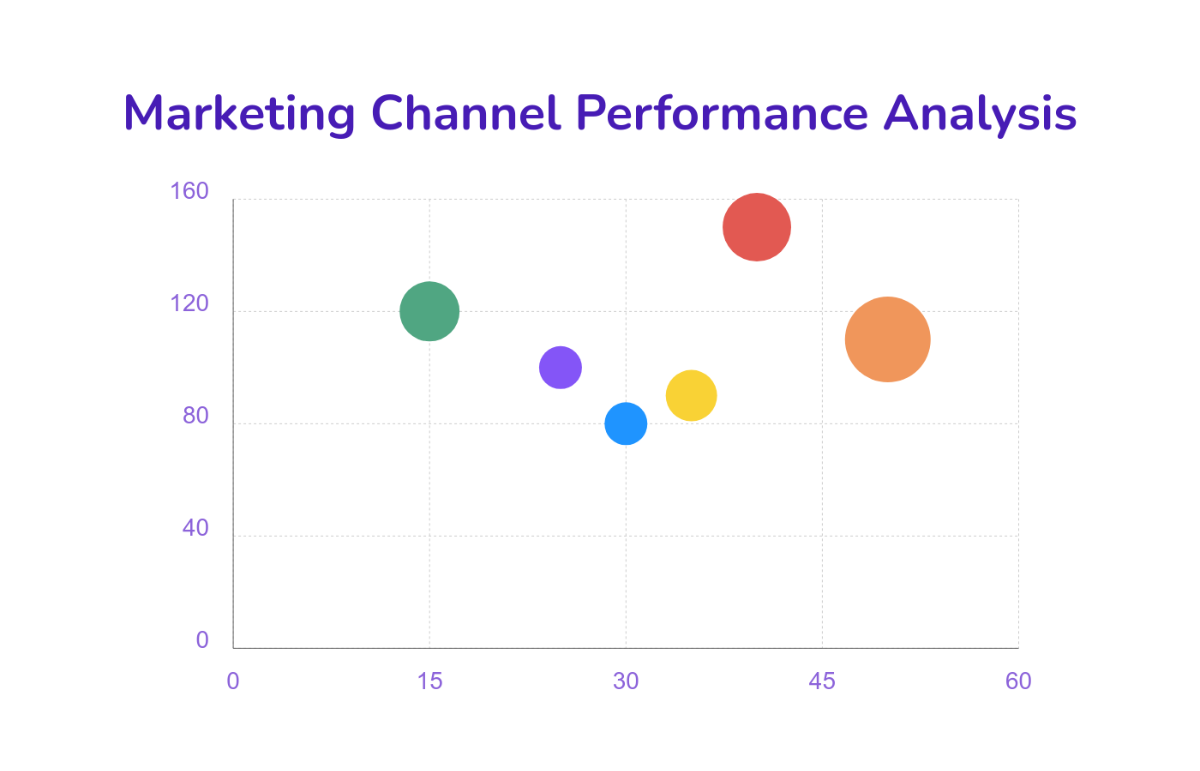
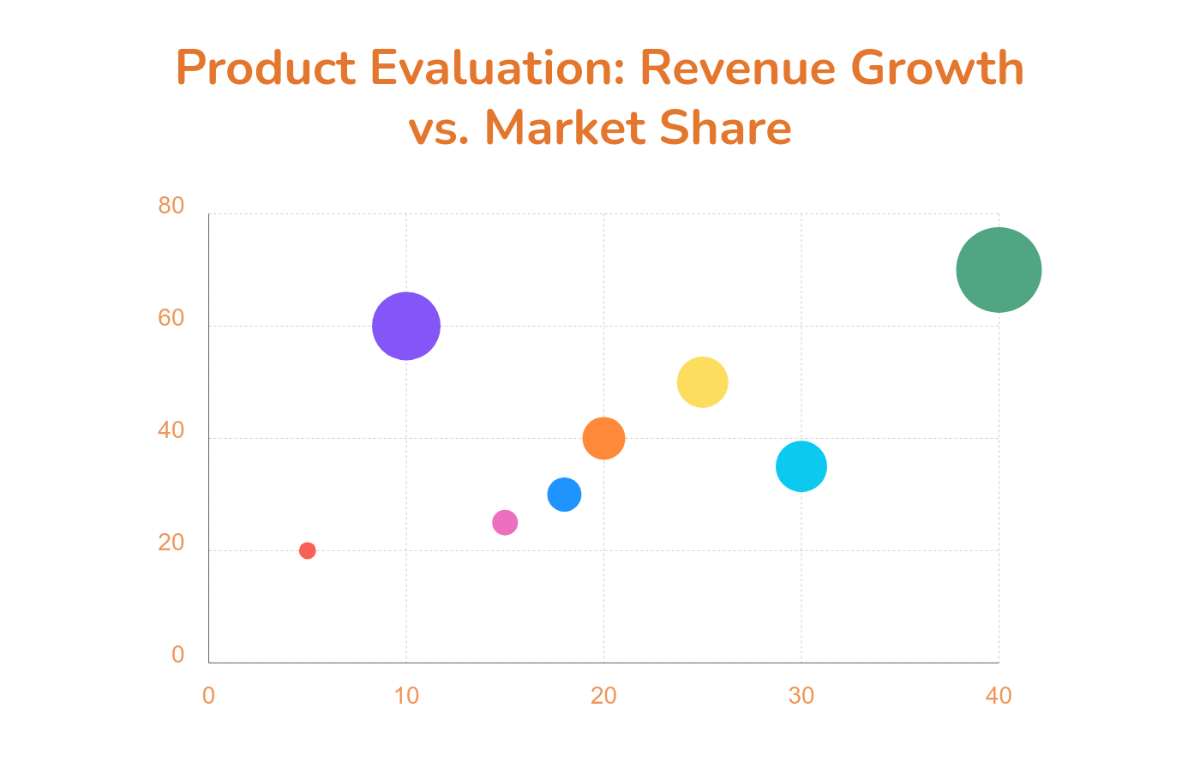
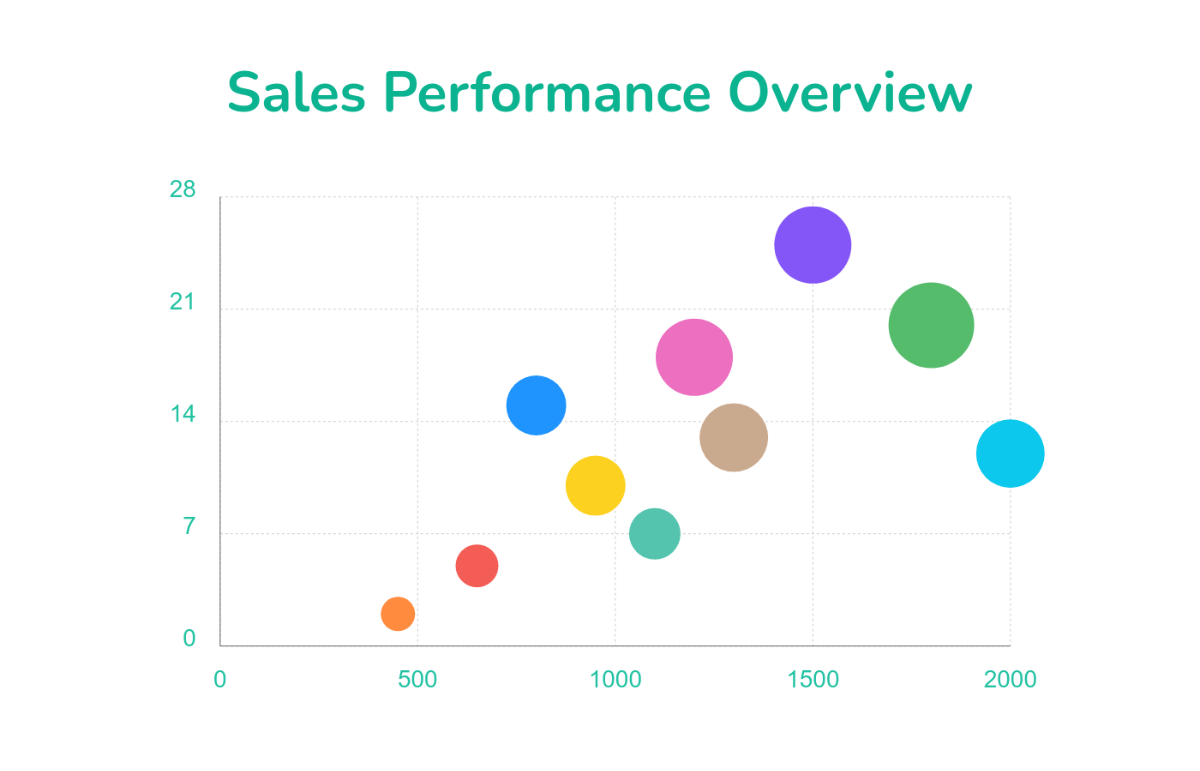
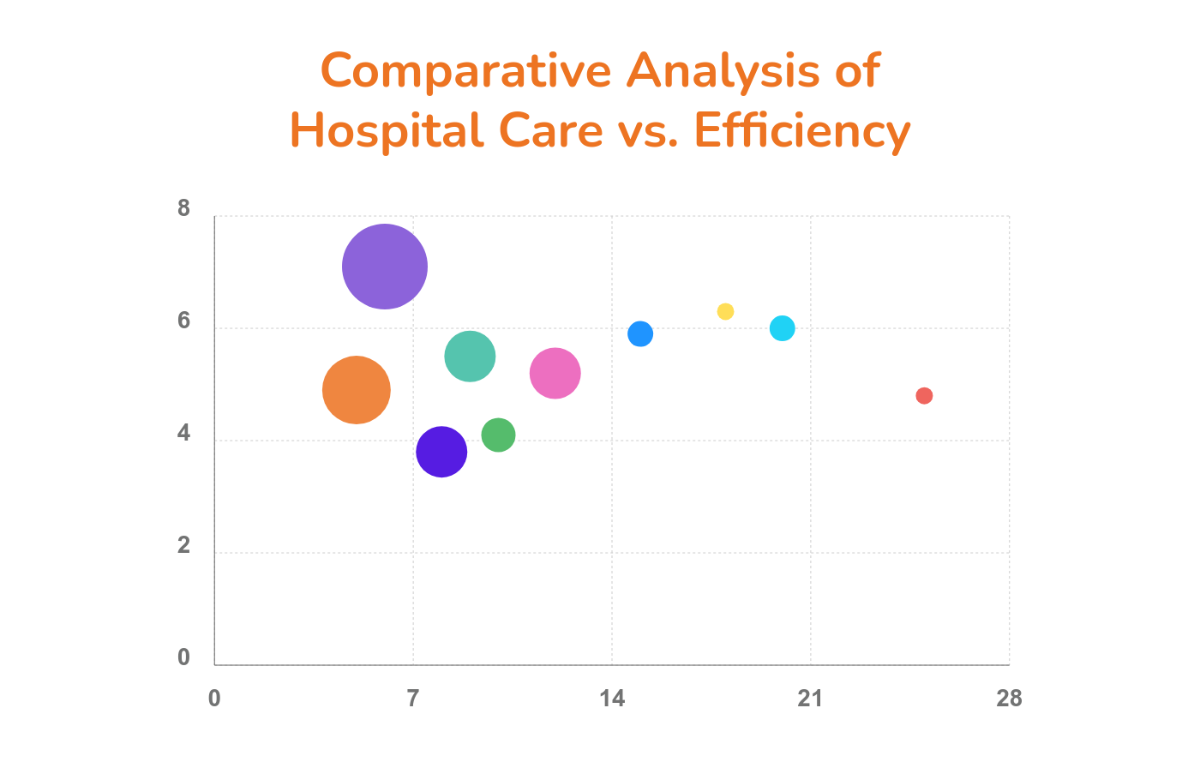
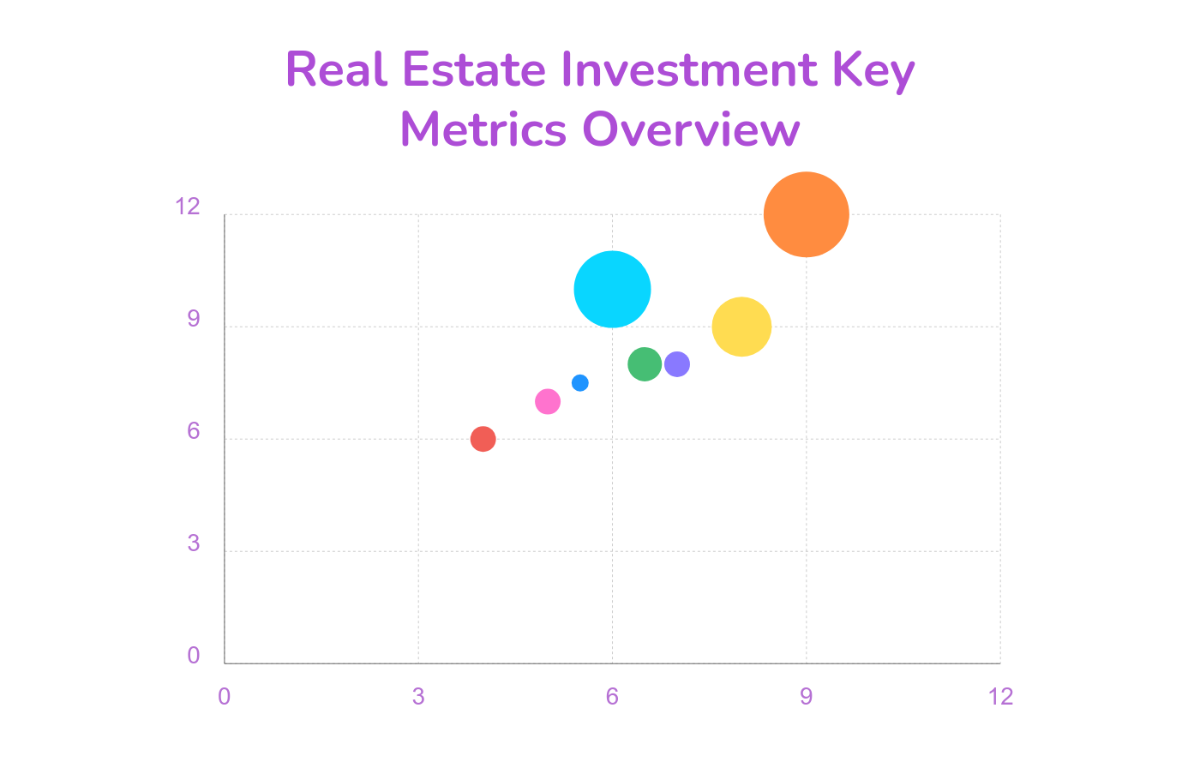
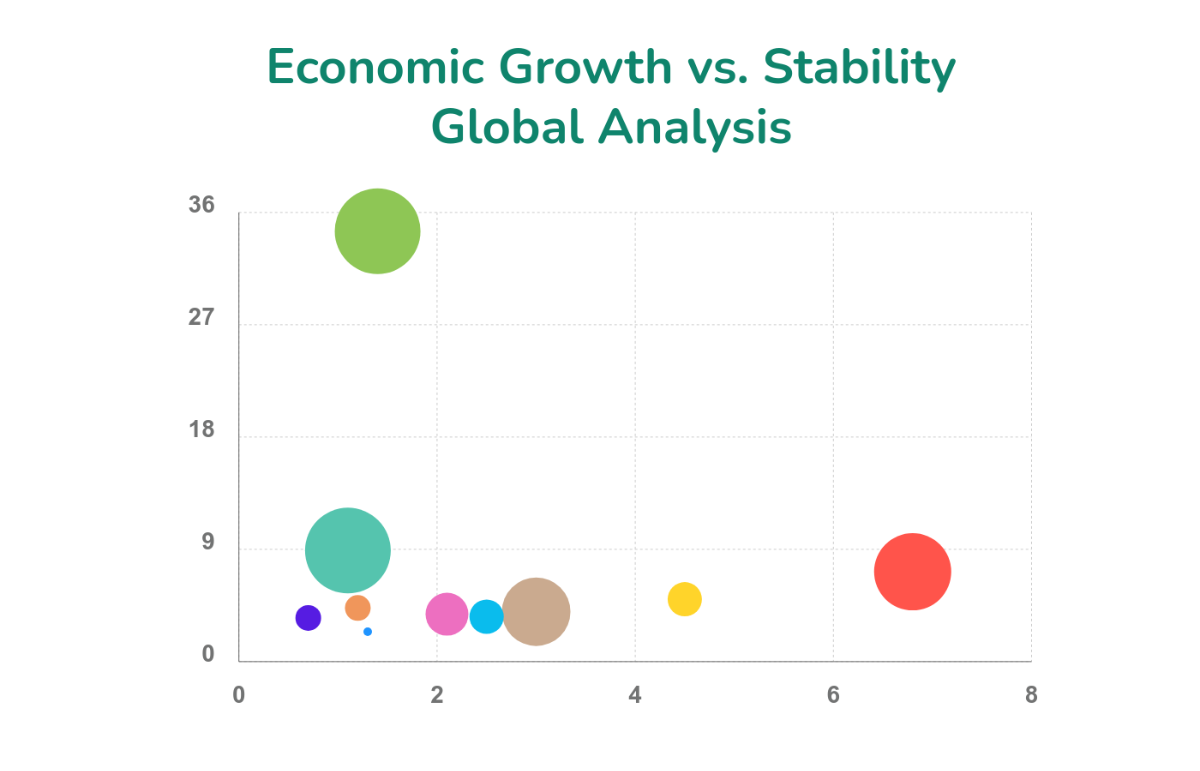
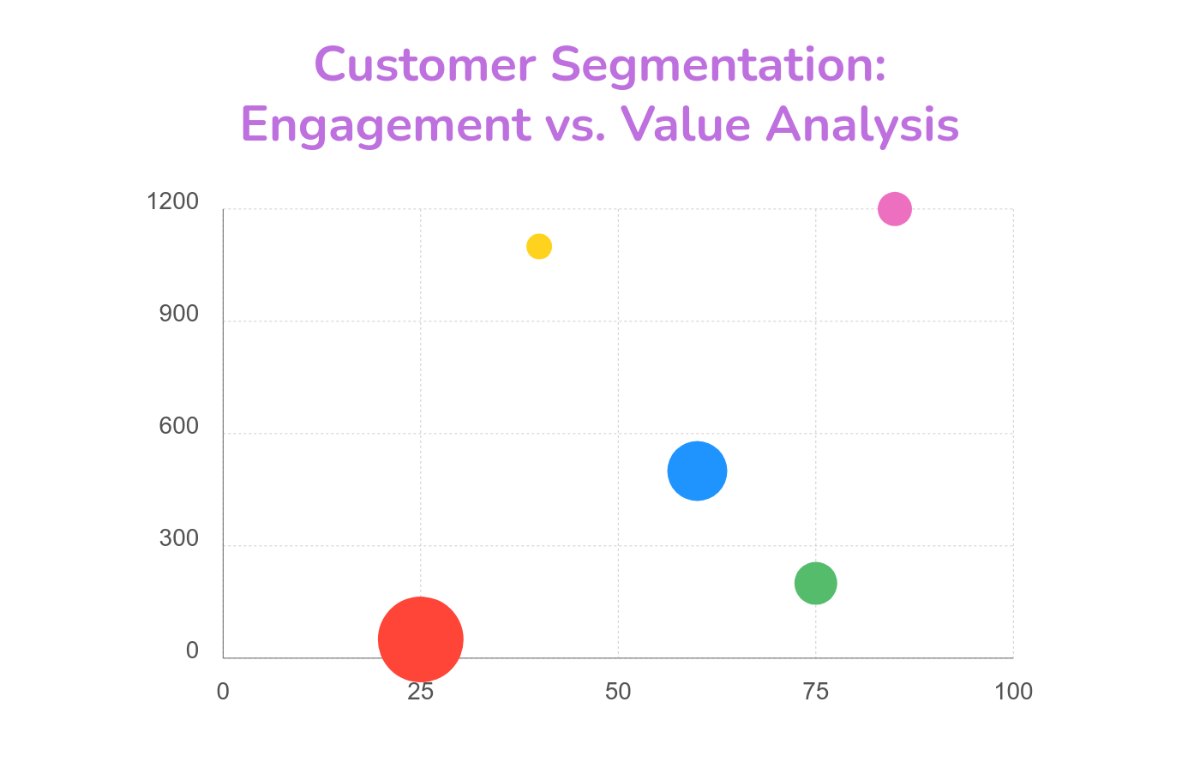
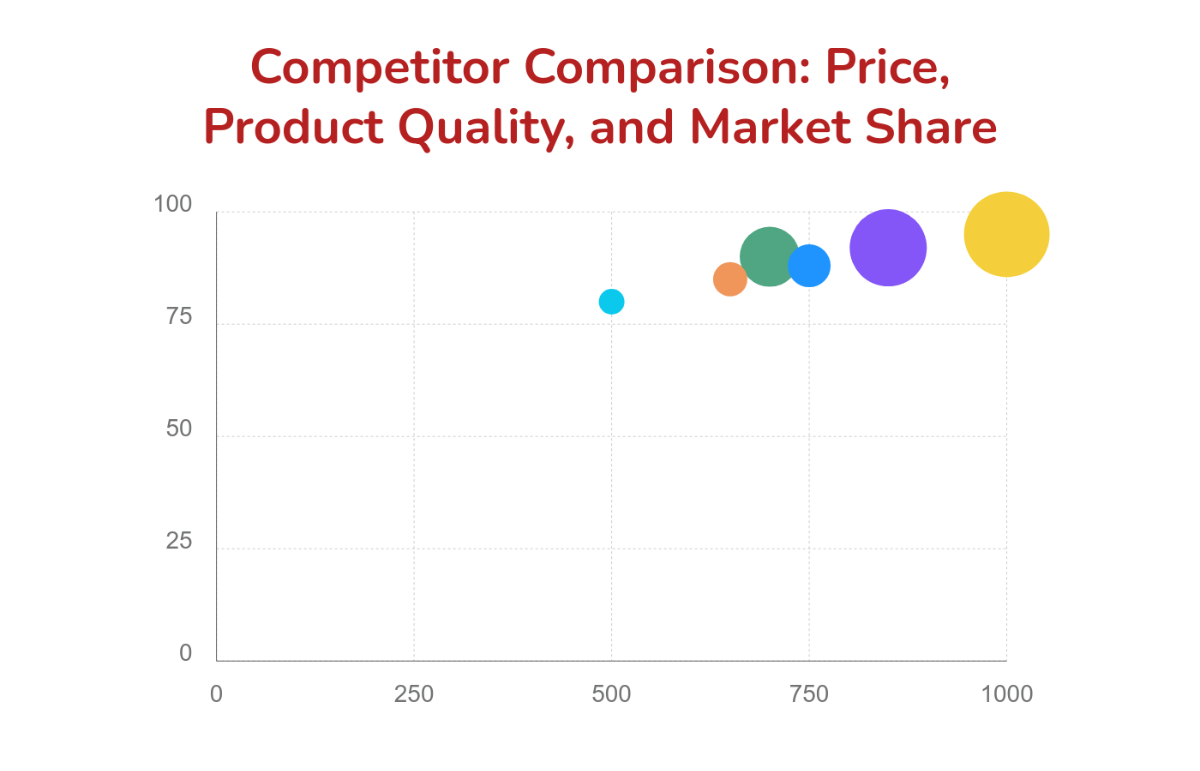
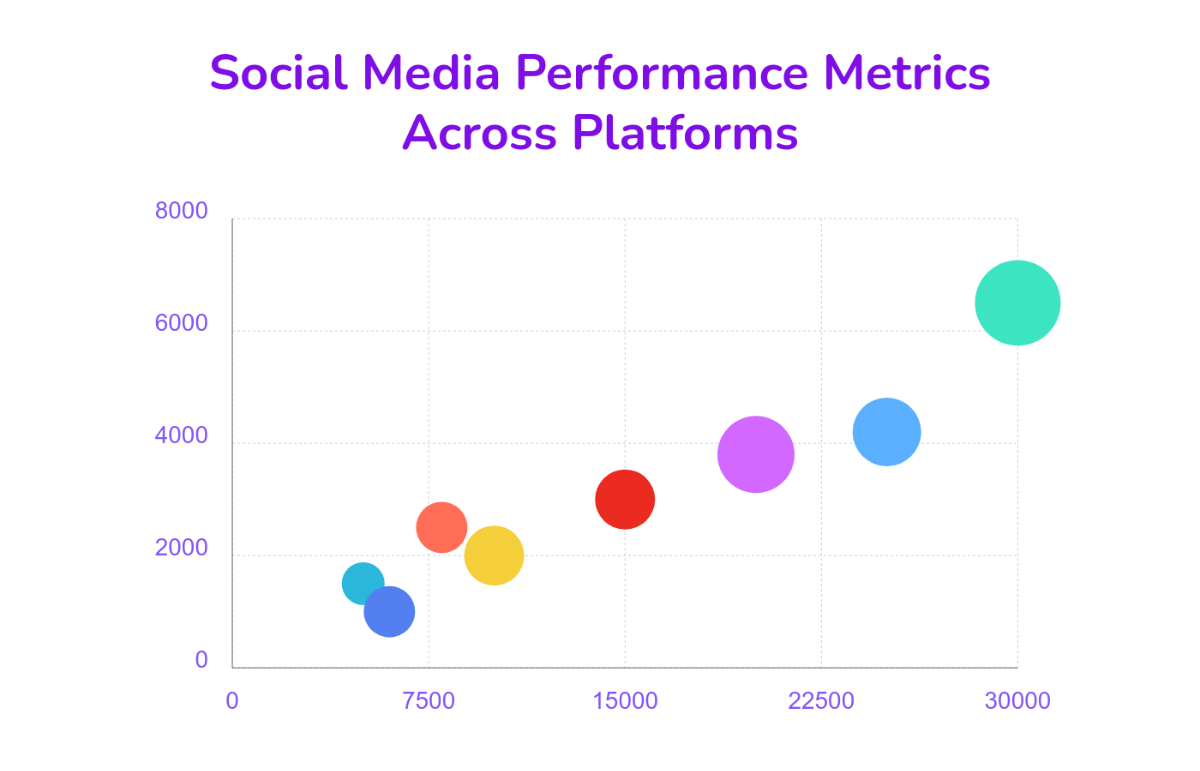
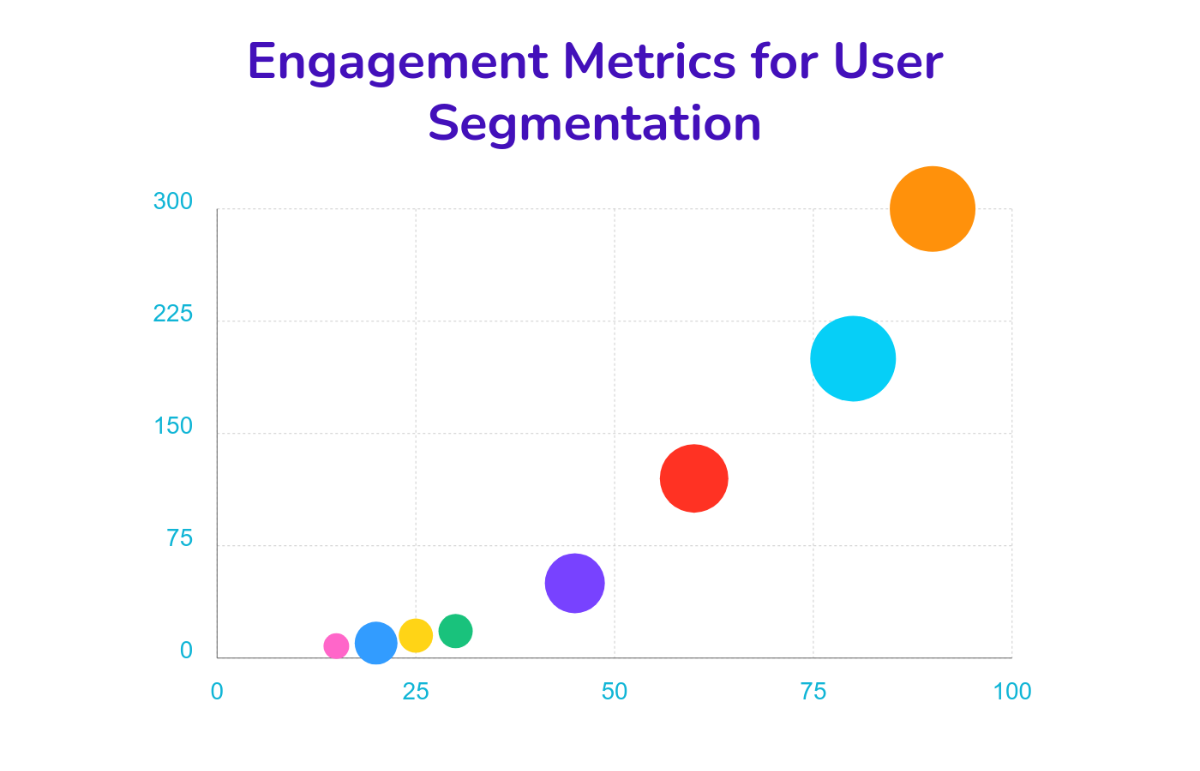
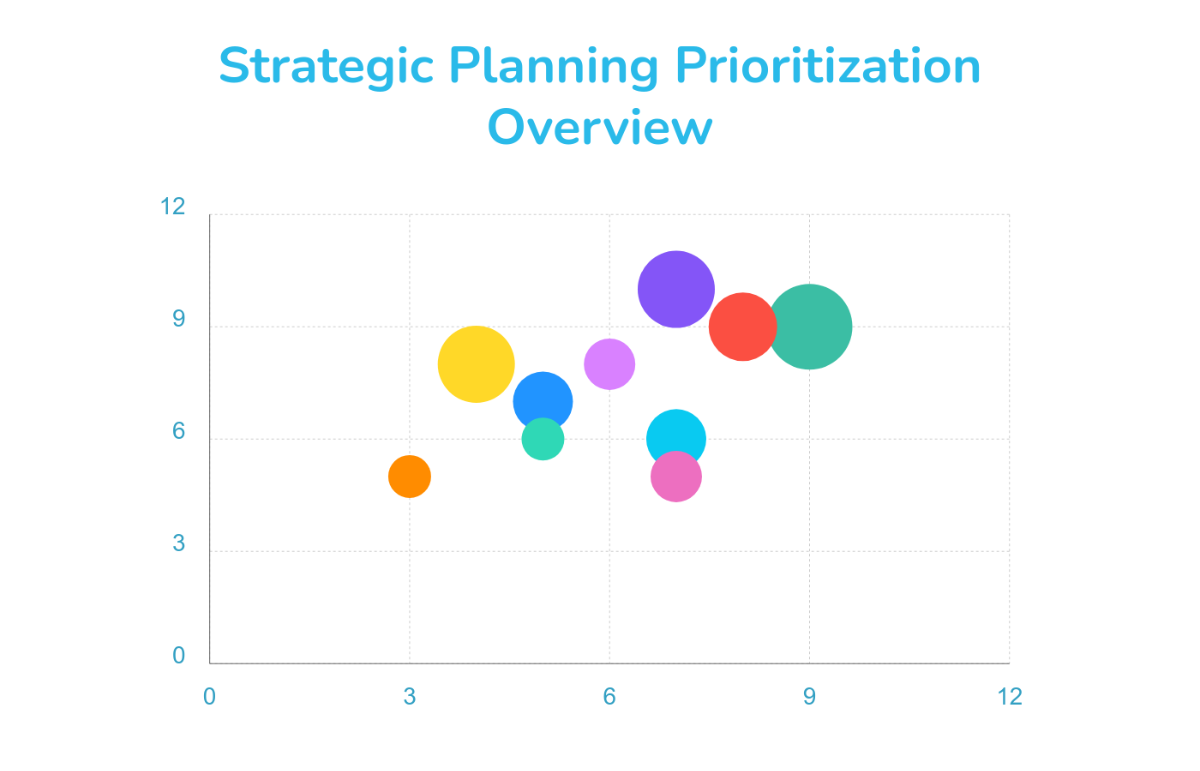
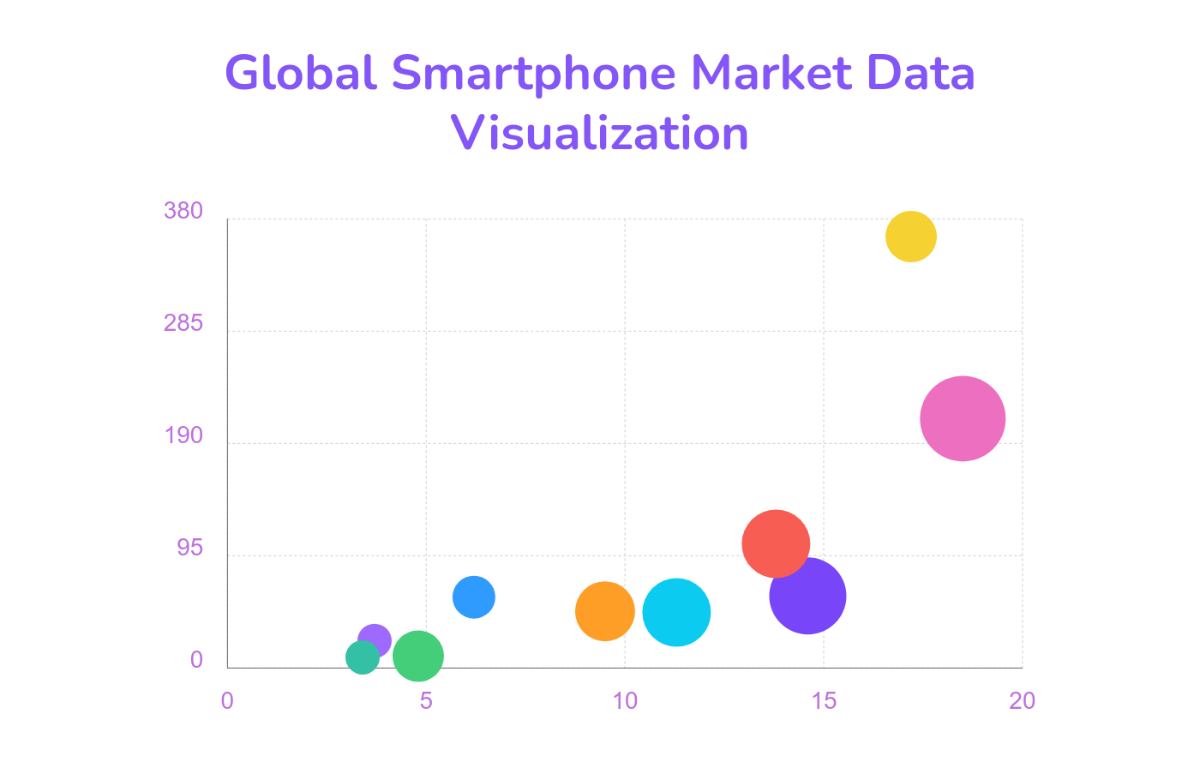
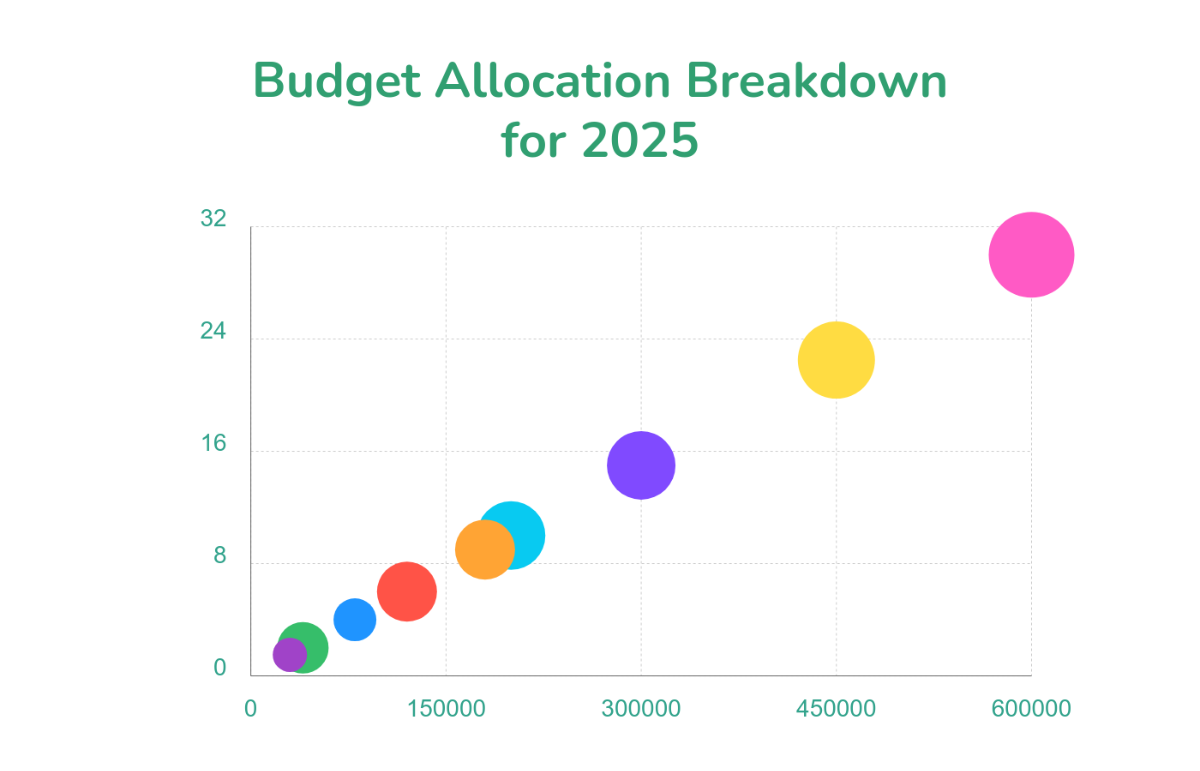
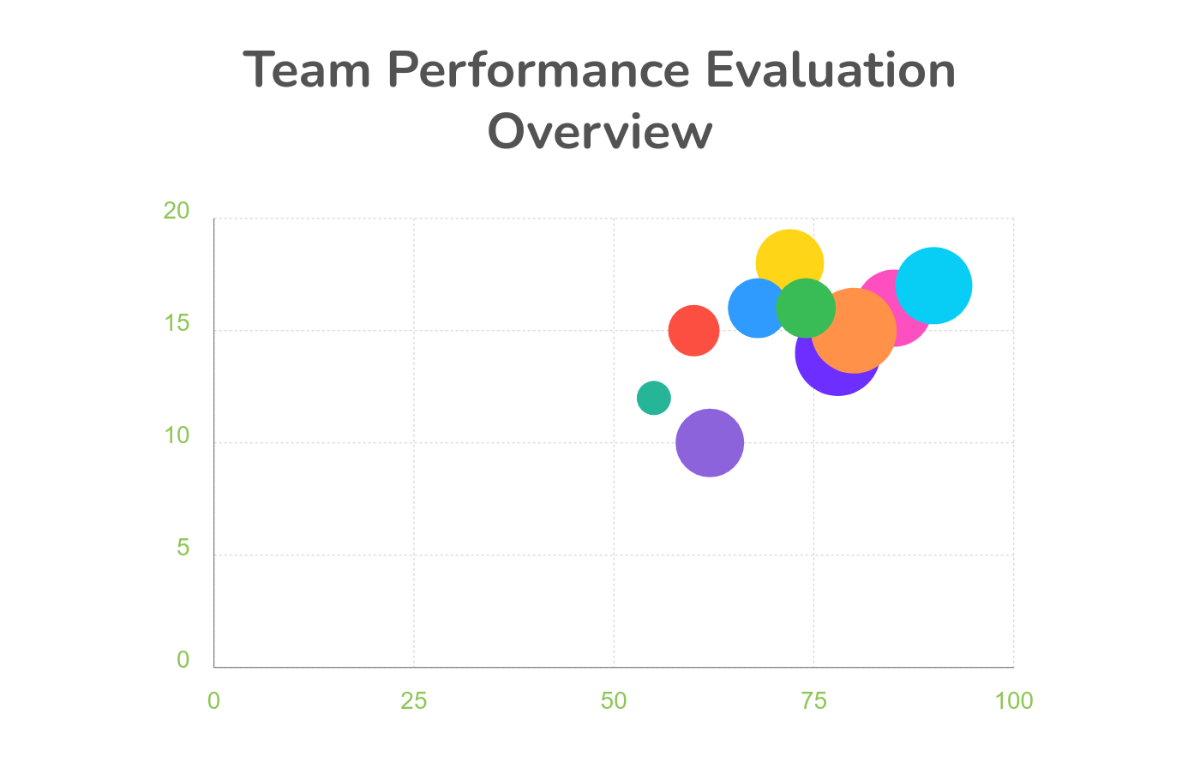
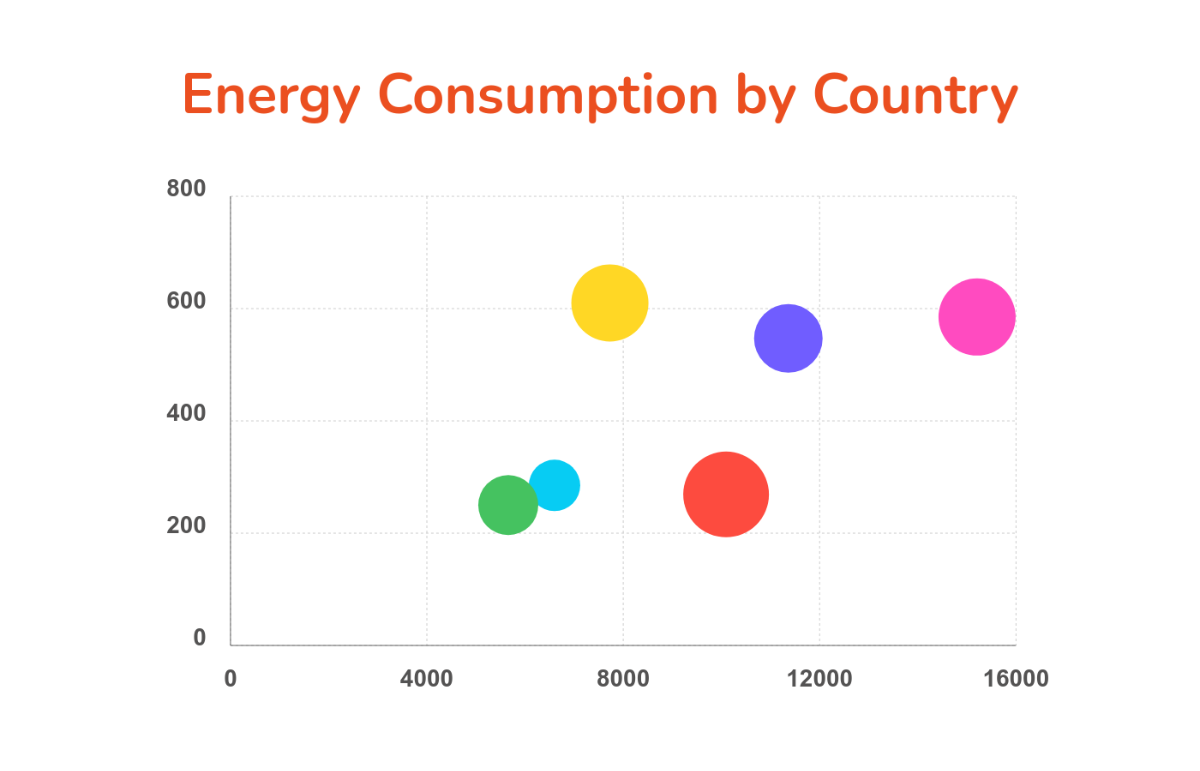
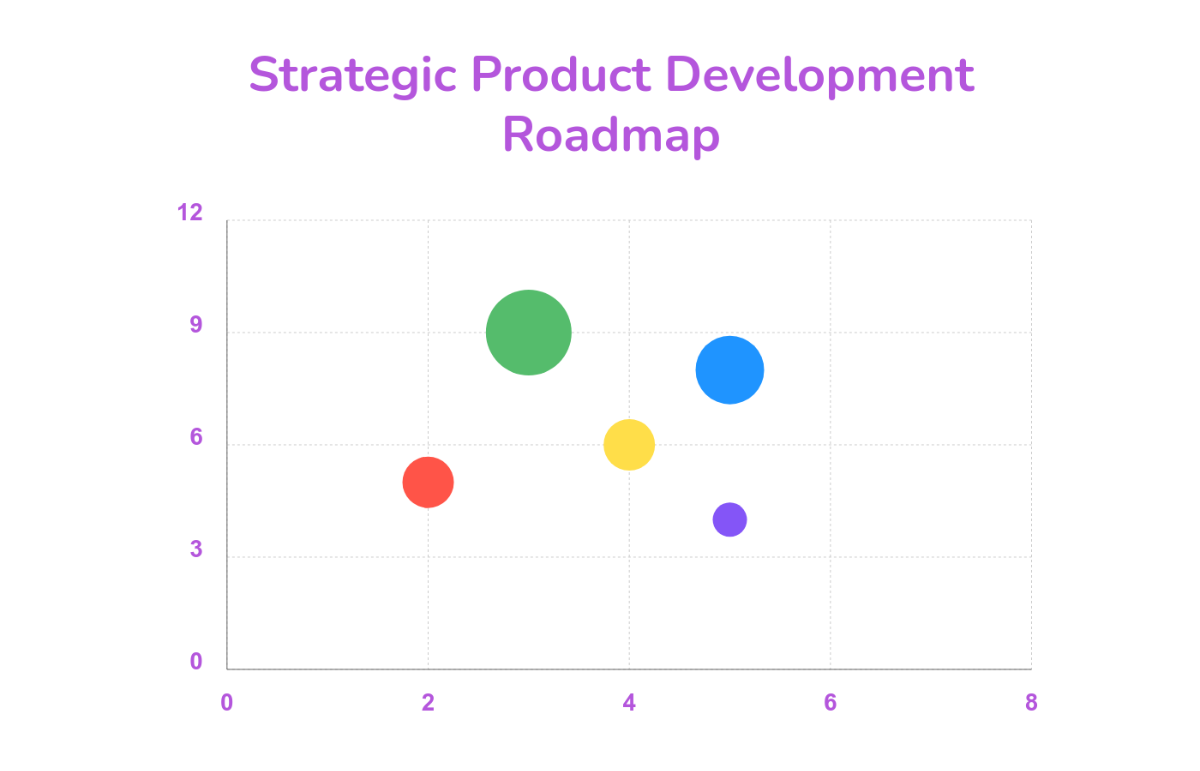
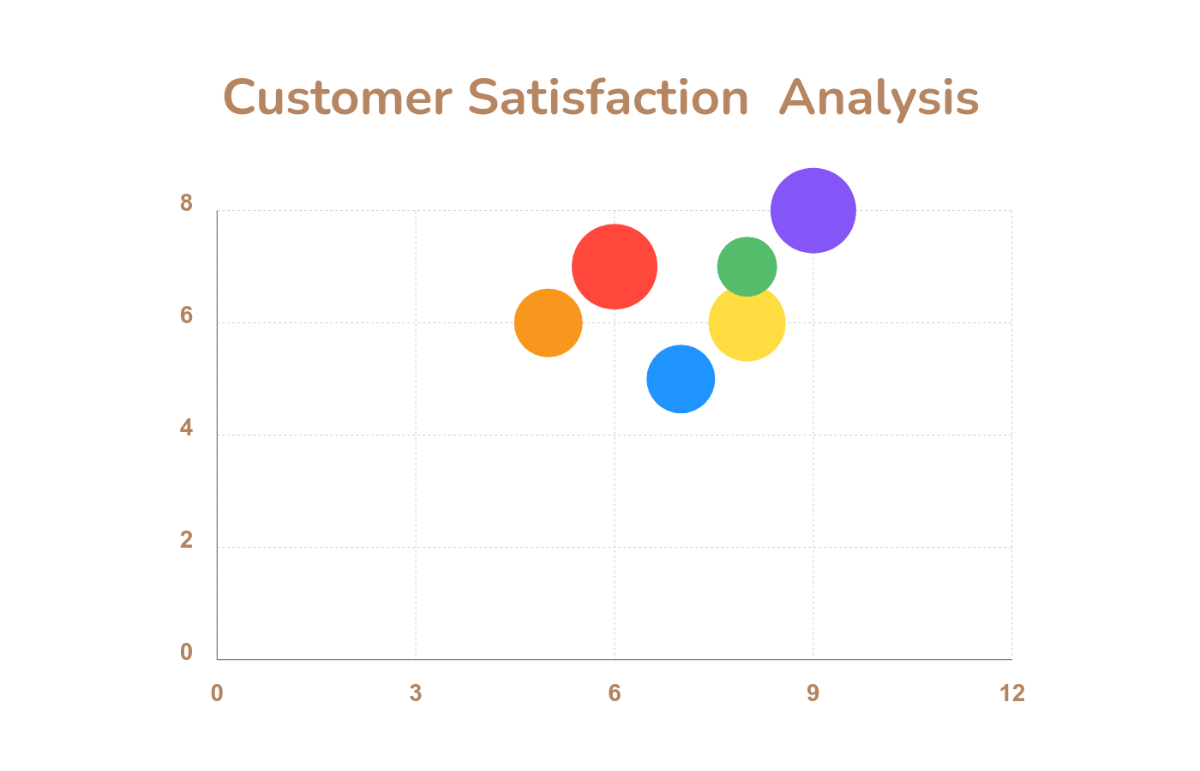
Keep your presentations and reports visually engaging, clear, and professional with our Bubble Chart Templates from Template.net. Perfect for analysts, managers, and educators, these templates help you easily transform complex data into compelling visuals without any advanced graphic design skills. Whether you want to bubble chart Maker to illustrate your sales projections or to present a scientific study, our templates have you covered. Each template comes equipped with fields for data details and labels, ensuring that your audience will grasp every insight. And all this with no hefty software costs or skill barriers—the templates are designed to be user-friendly and free, offering both print and digital distribution options such as downloadable PDFs and social media-ready files.
Discover the many Bubble Chart Templates we have on hand, designed to meet diverse analytical needs. Simply select a template that suits your purpose, swap in your own data, and tweak the colors and fonts to align with your brand’s aesthetic. For more advanced customization, drag and drop icons or graphics, add animated effects to highlight key points, and utilize our AI-powered text tools to craft clear narratives around your data. The possibilities are endless and skill-free, elevating your charts to professional-grade results effortlessly. Our collection boasts regularly updated templates with new designs added weekly so that your presentations never get stale. When you’re finished, download or share via email, export, or publish directly to your preferred social media channels—ideal for catching the eye of audiences across multiple platforms. Collaborate in real-time and ensure every bubble speaks volumes.
