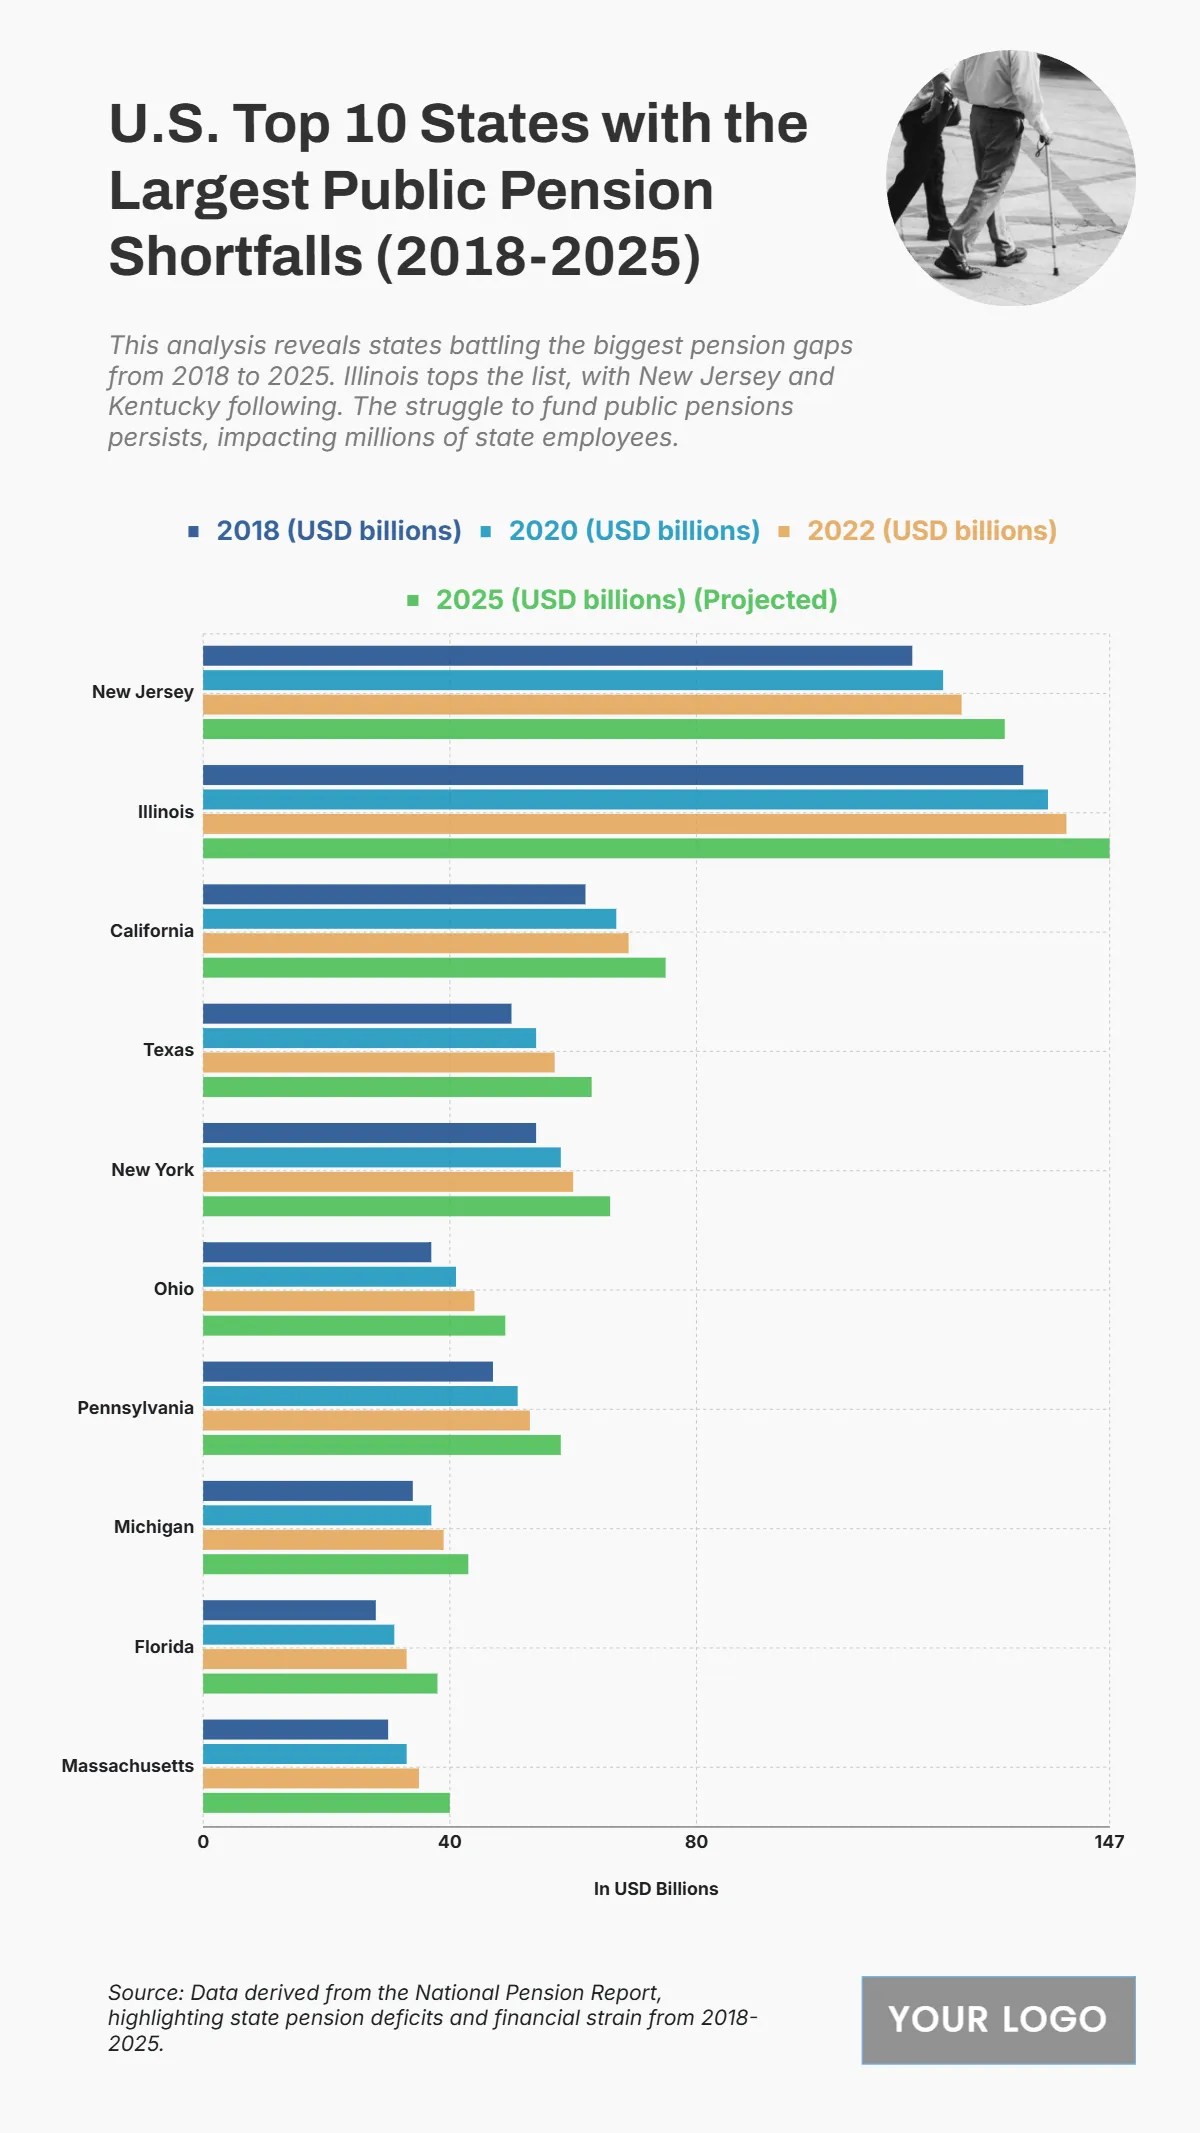
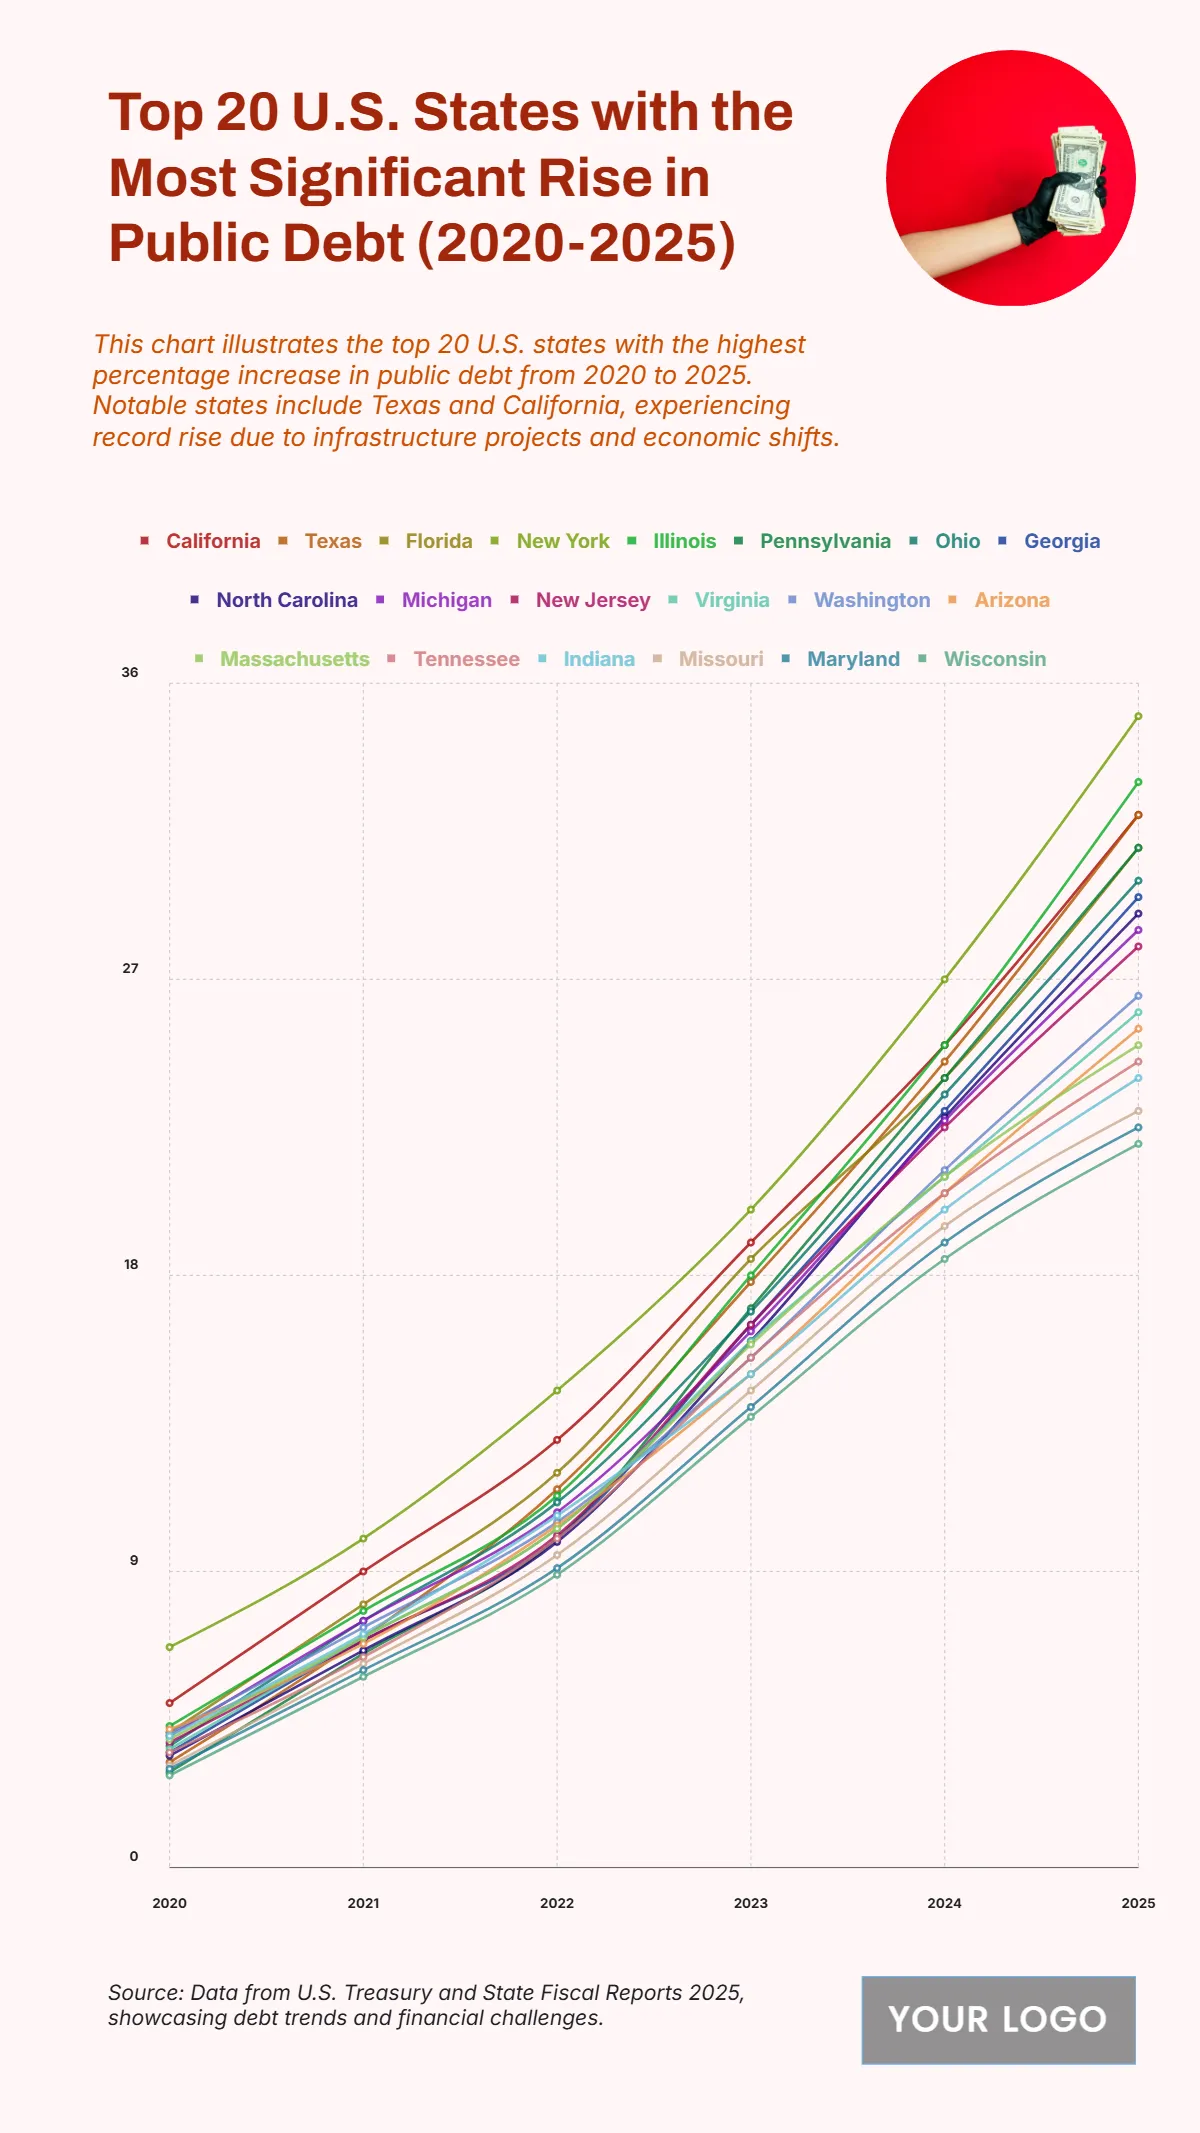
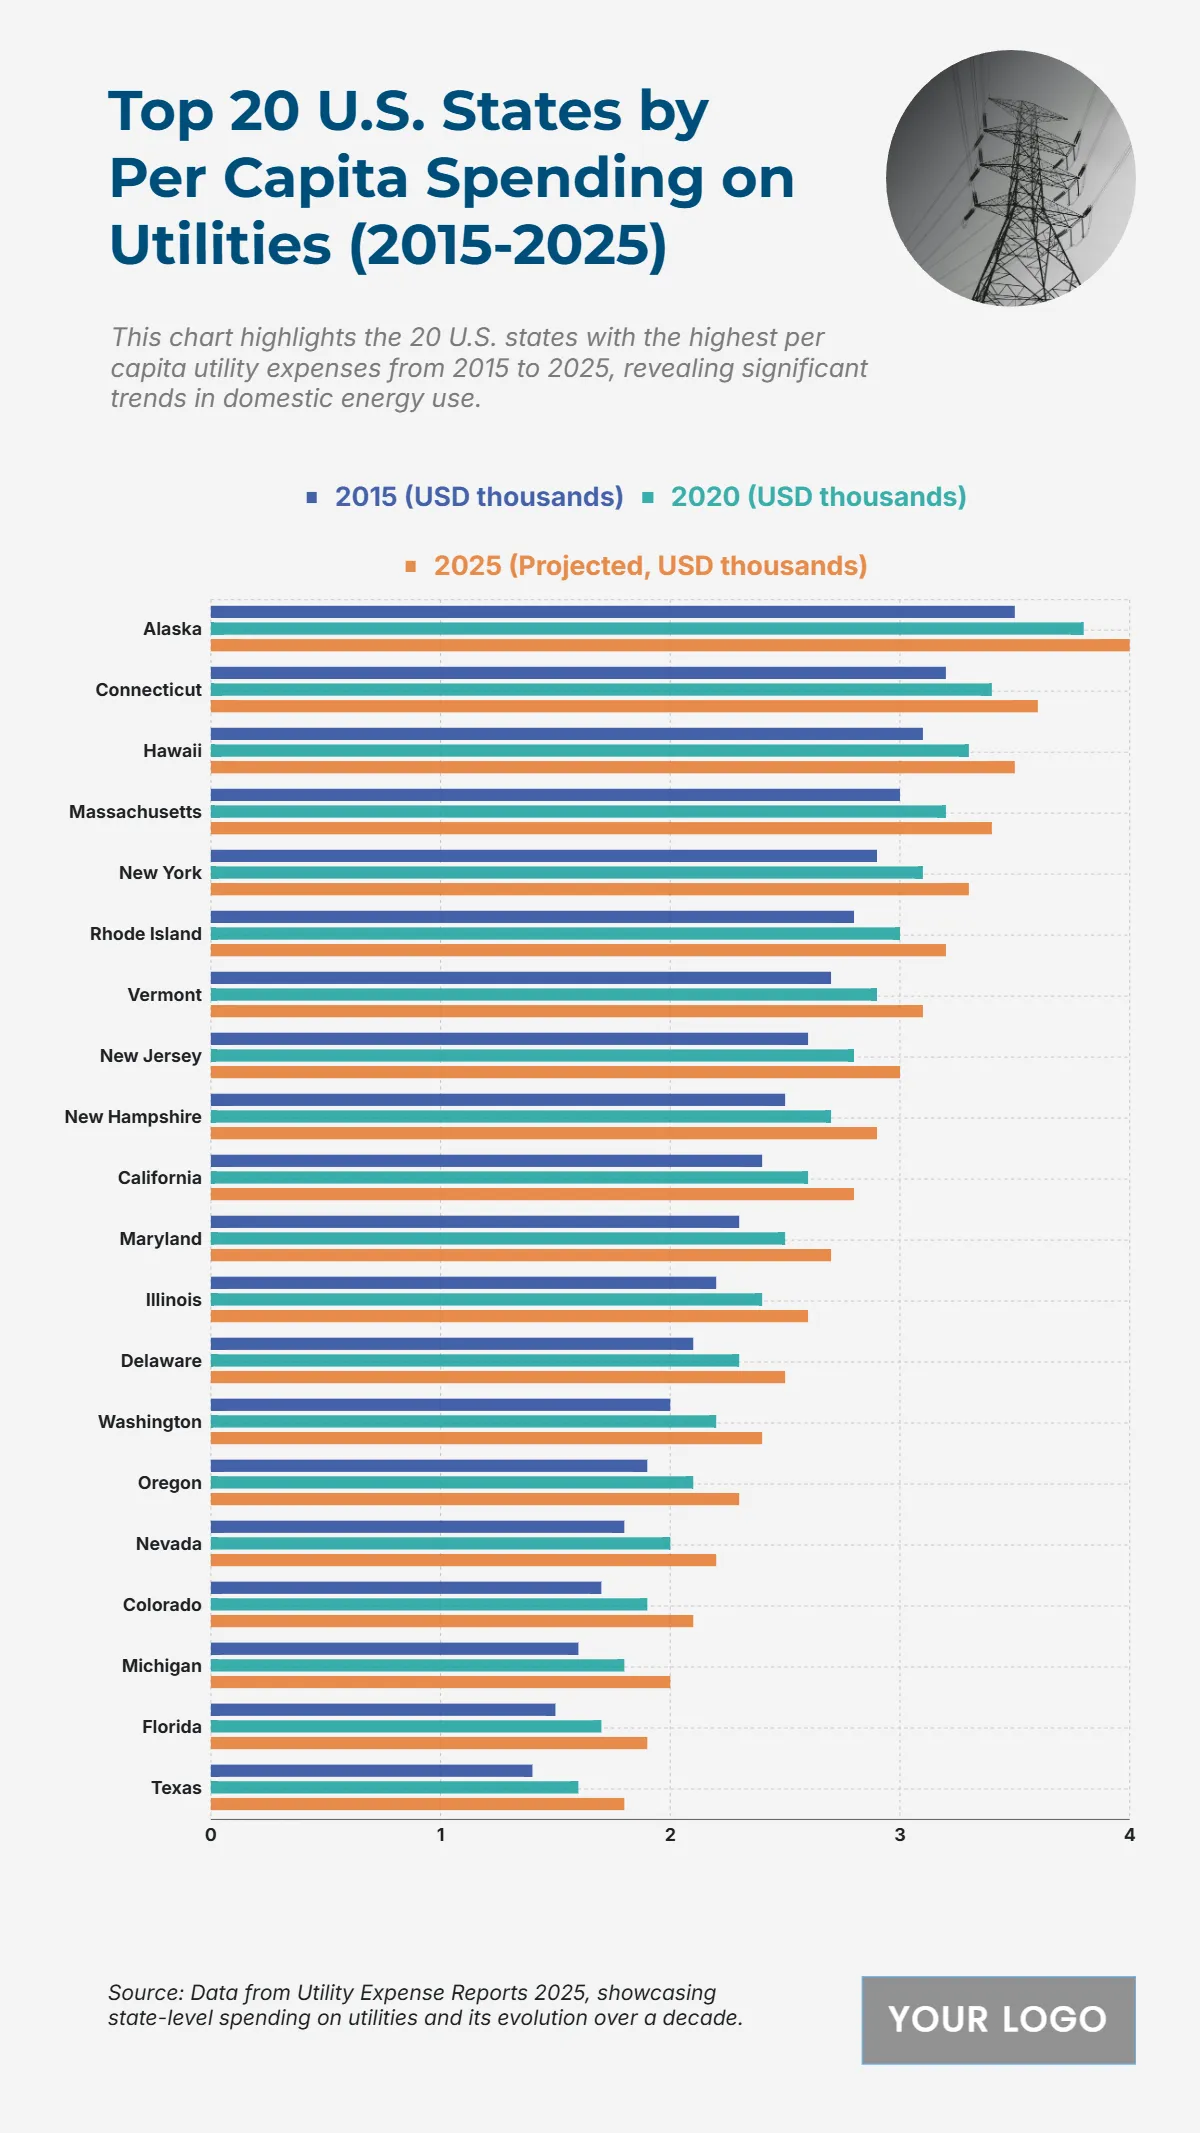
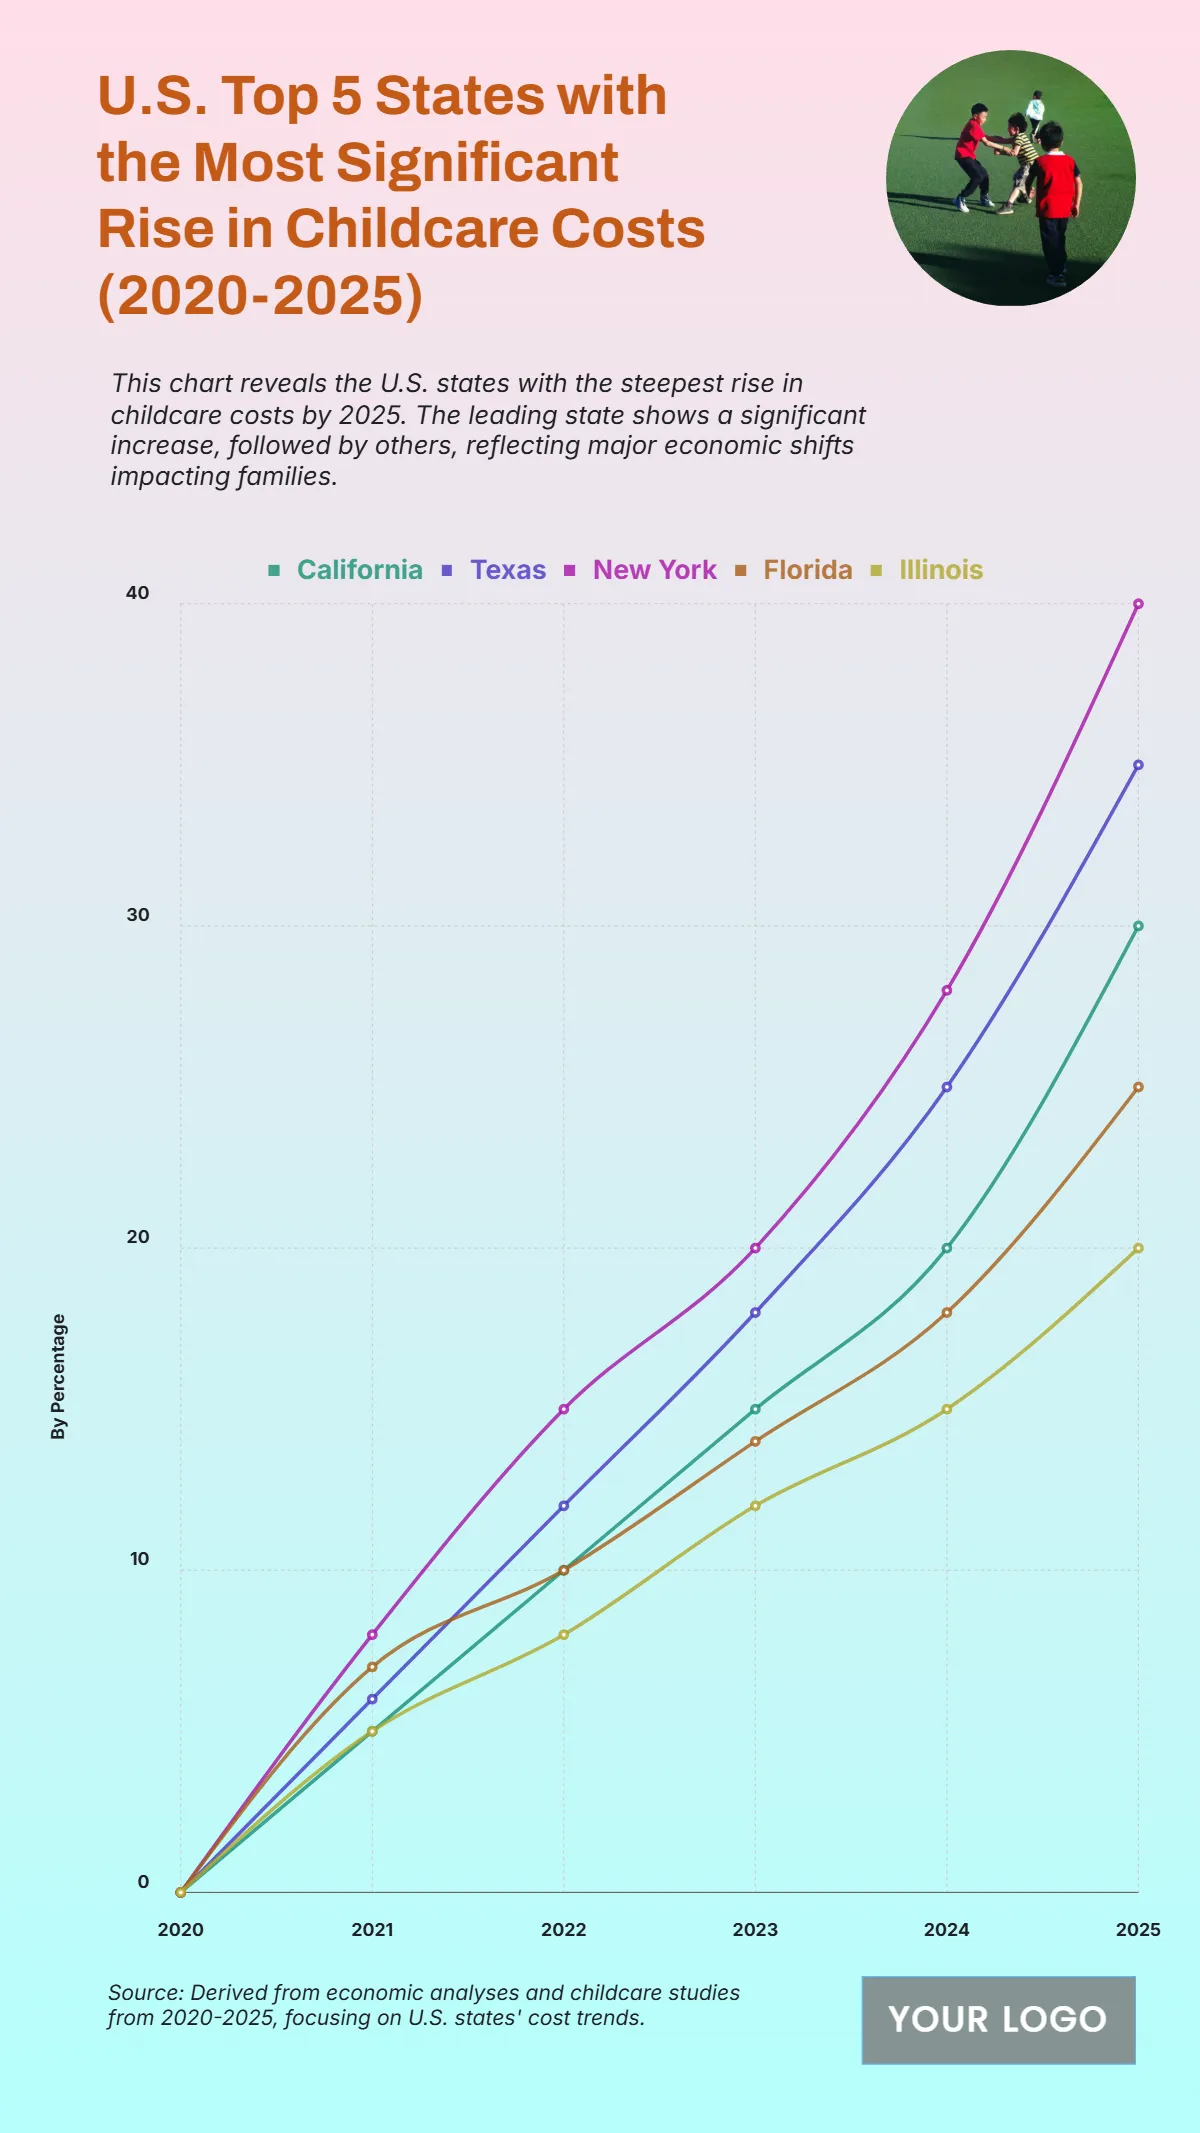
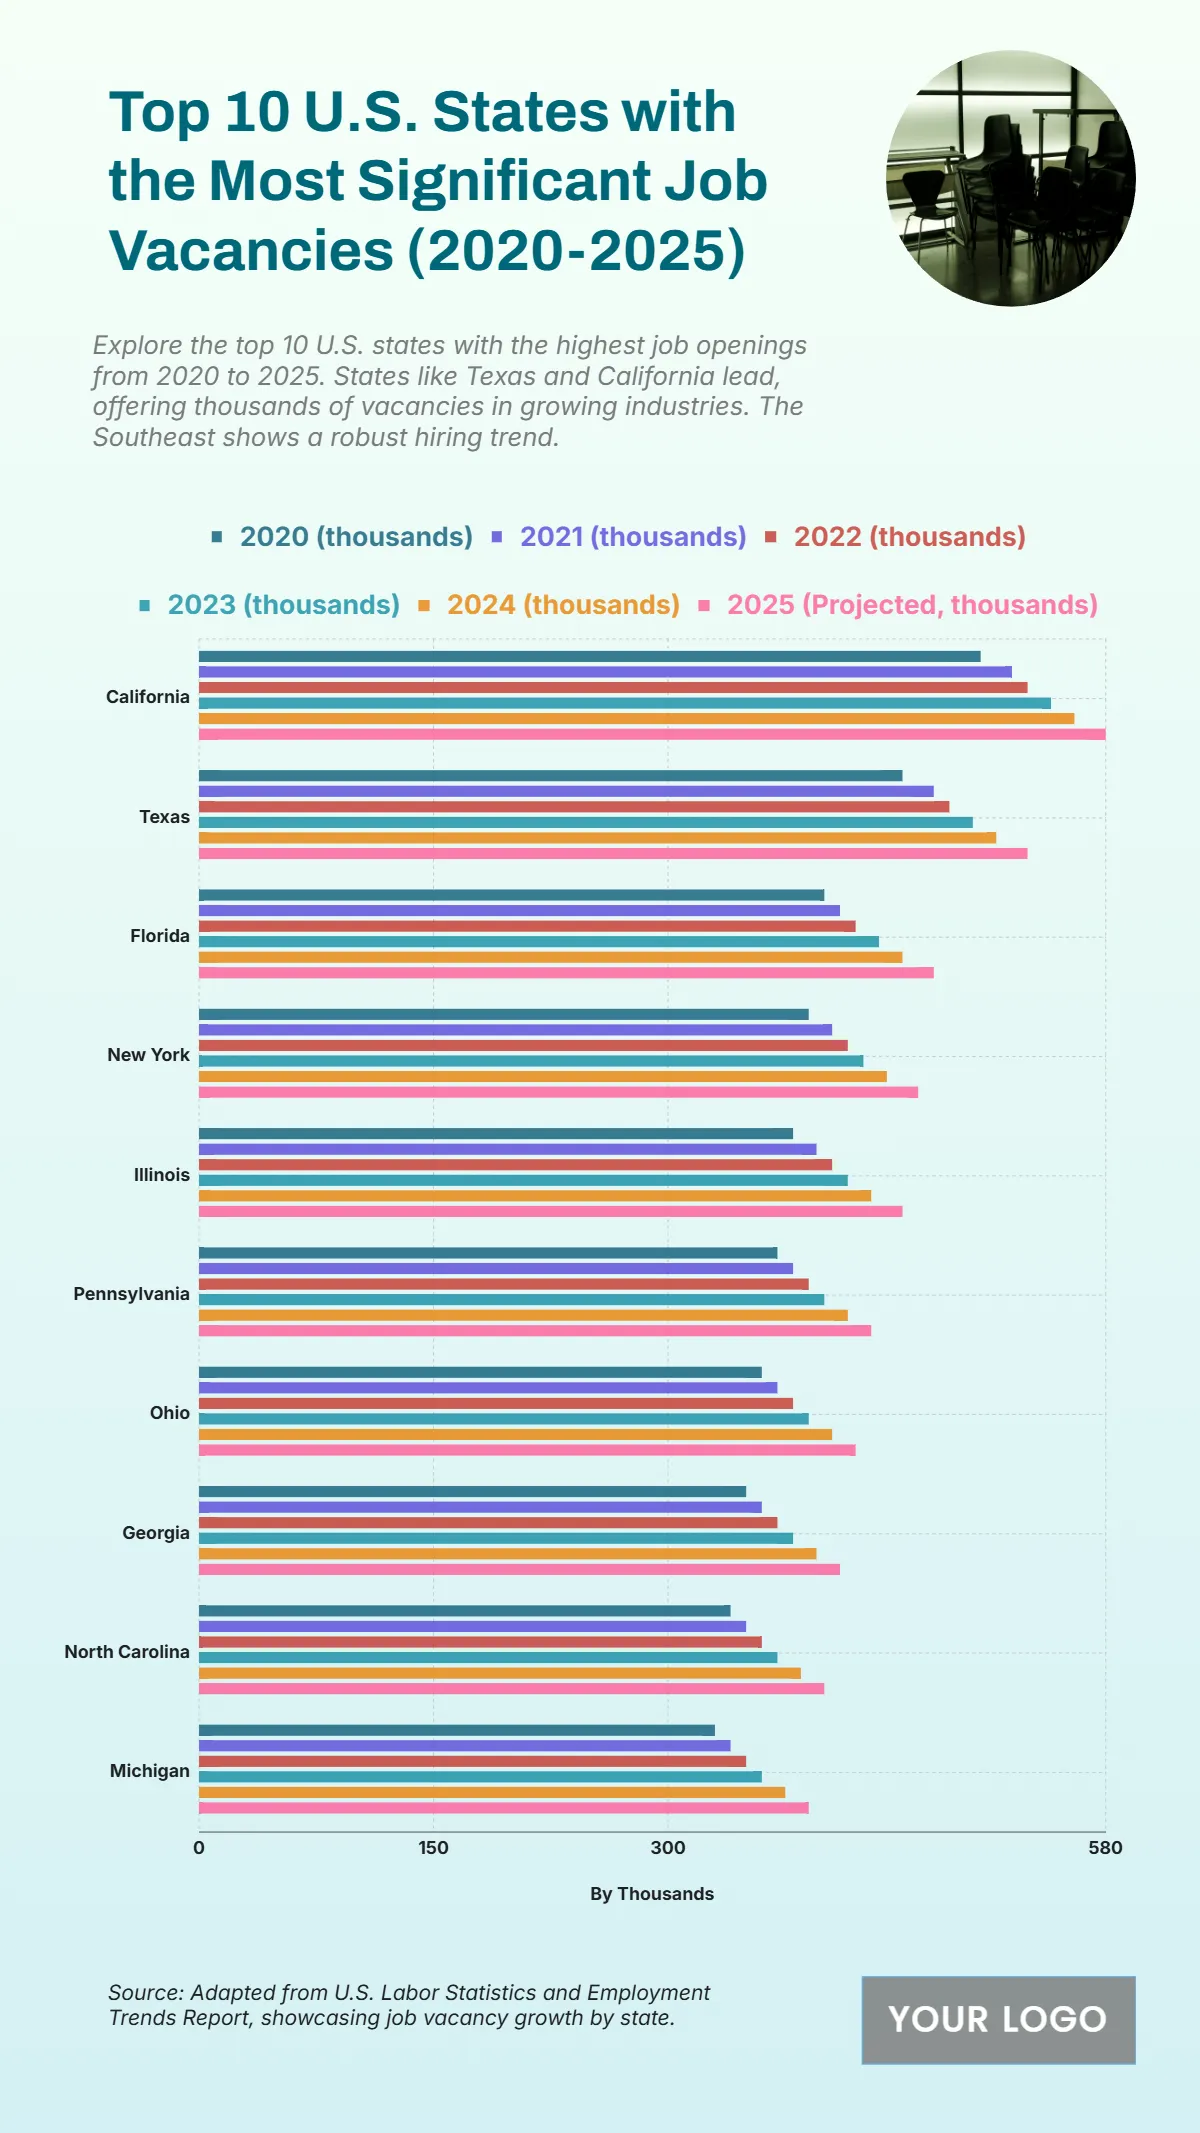
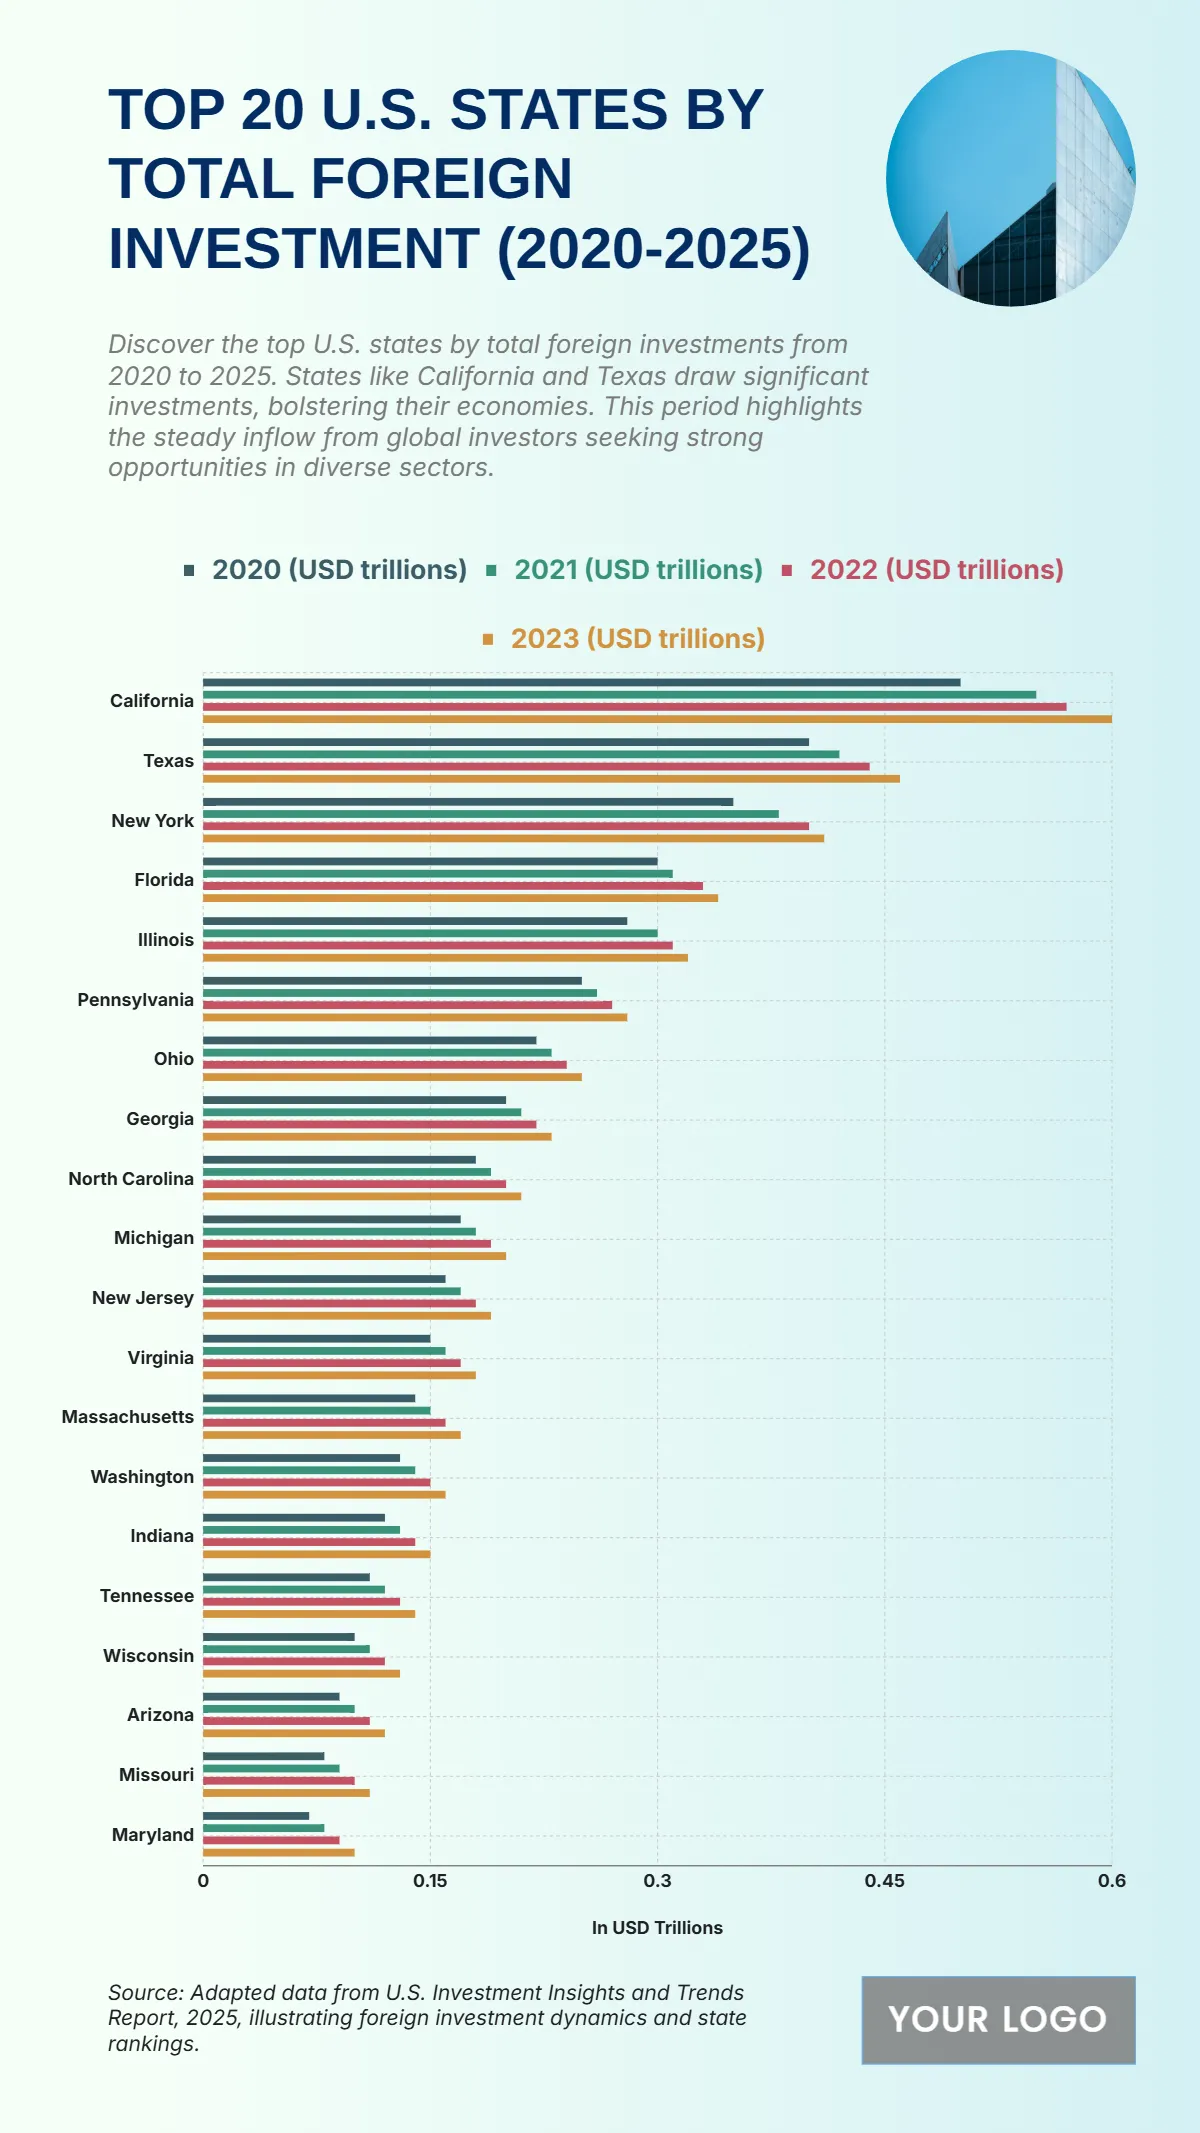
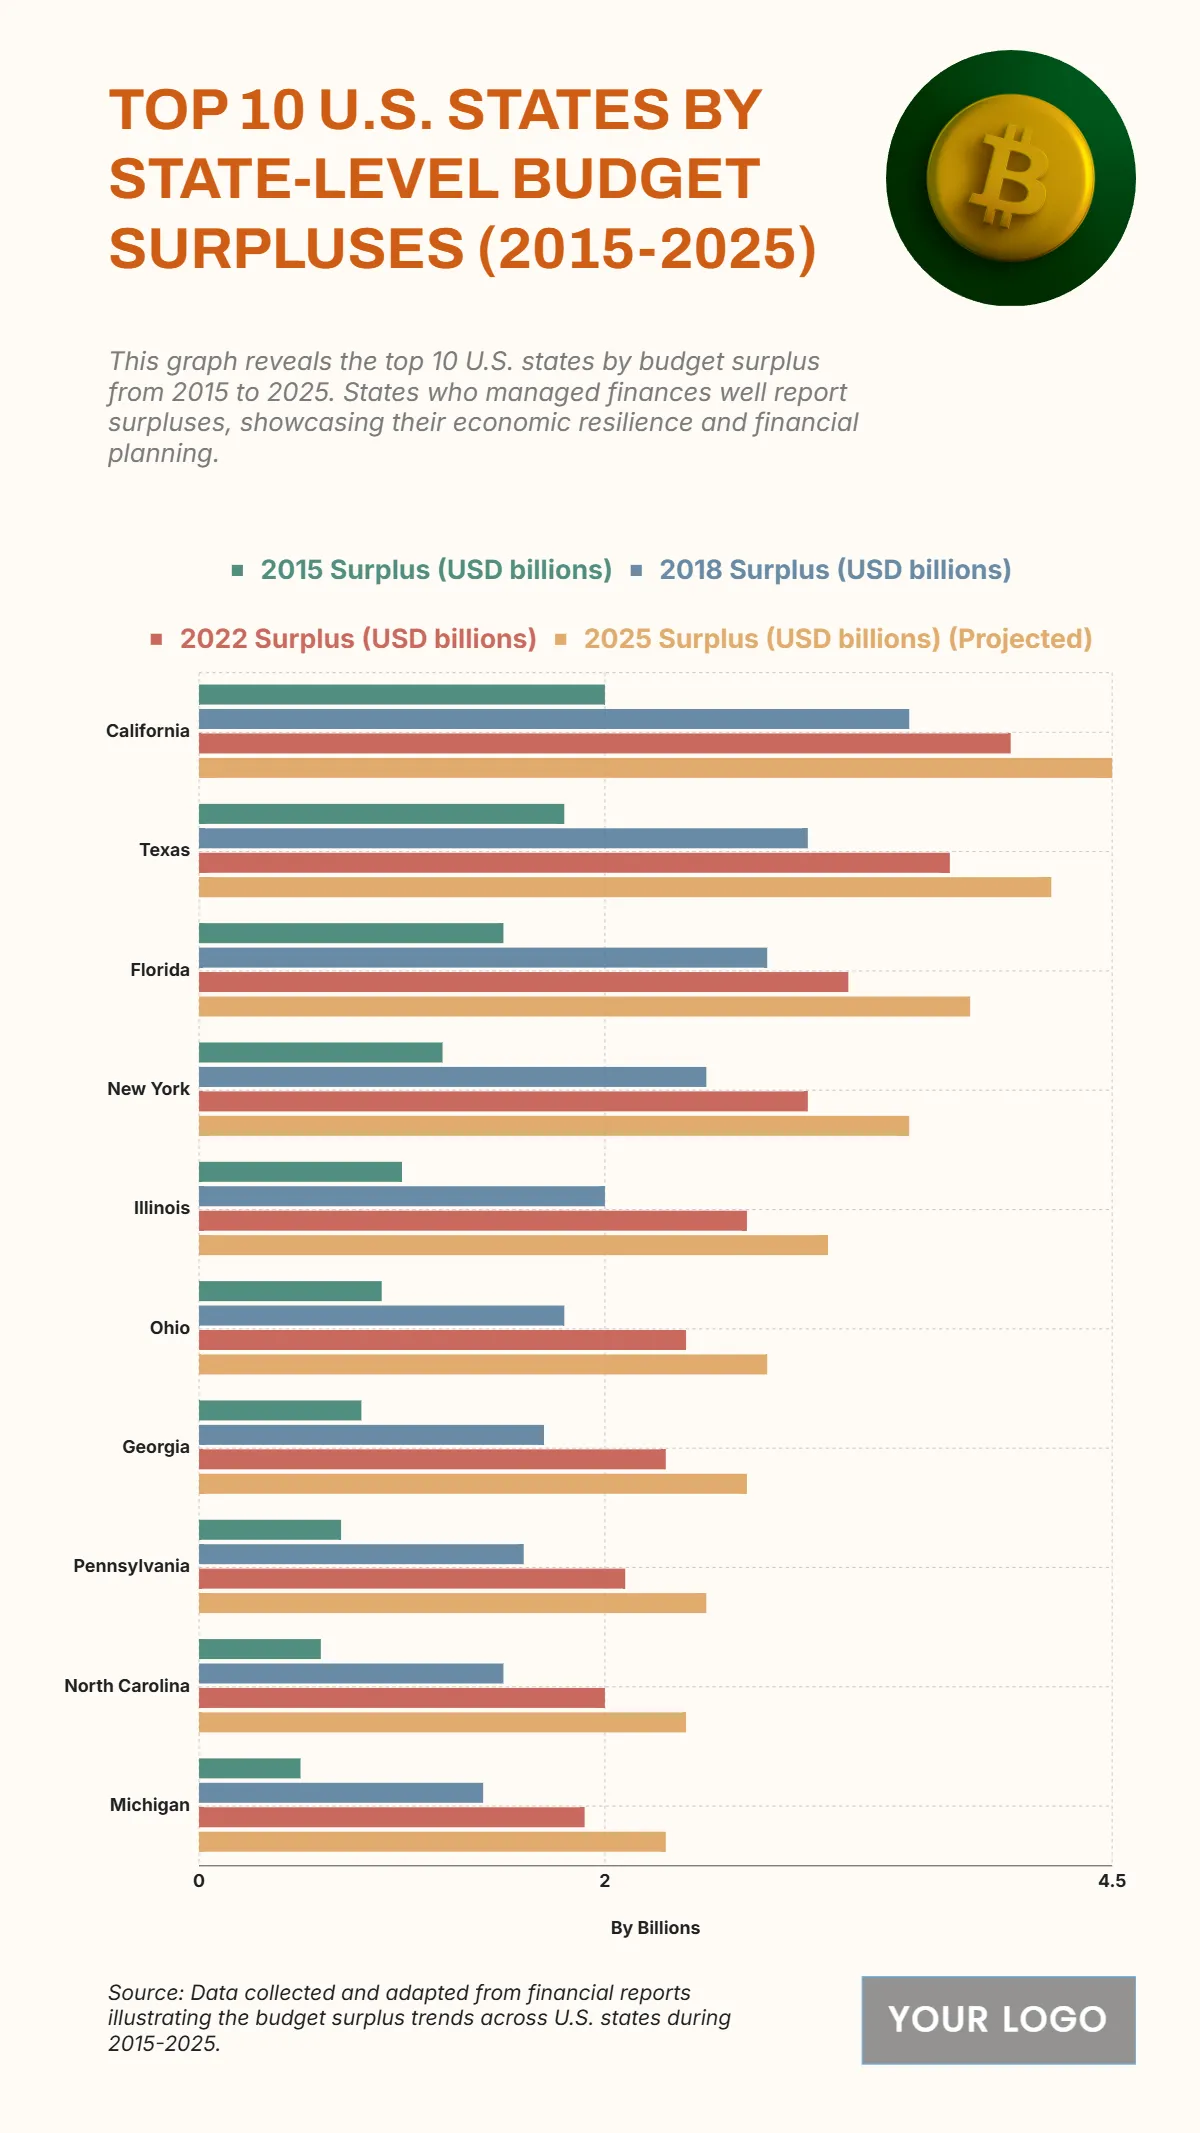
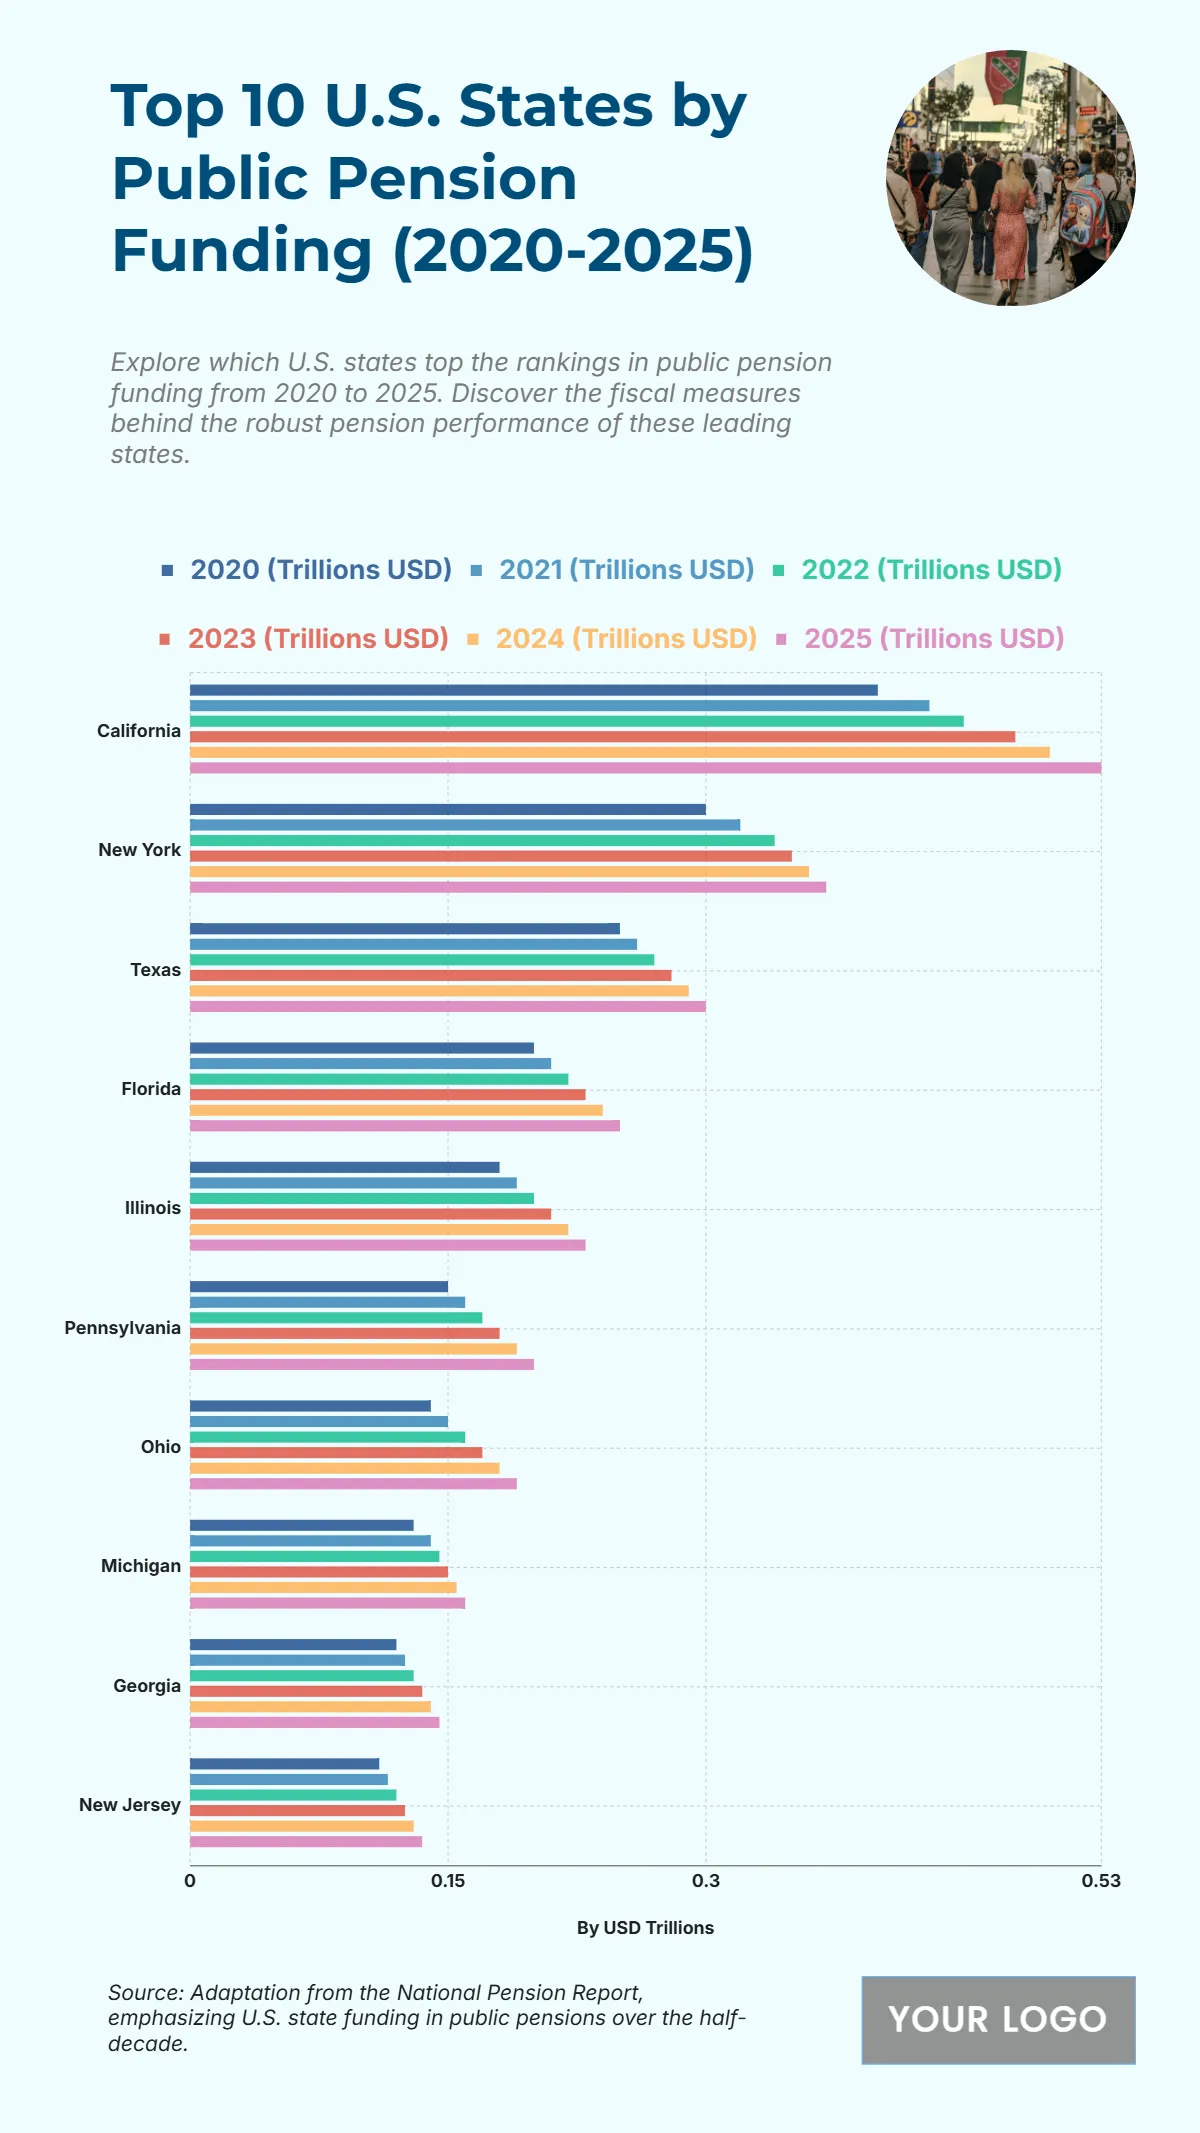
Bring Economic Insights to Life with Economy Chart Templates from Template.net.
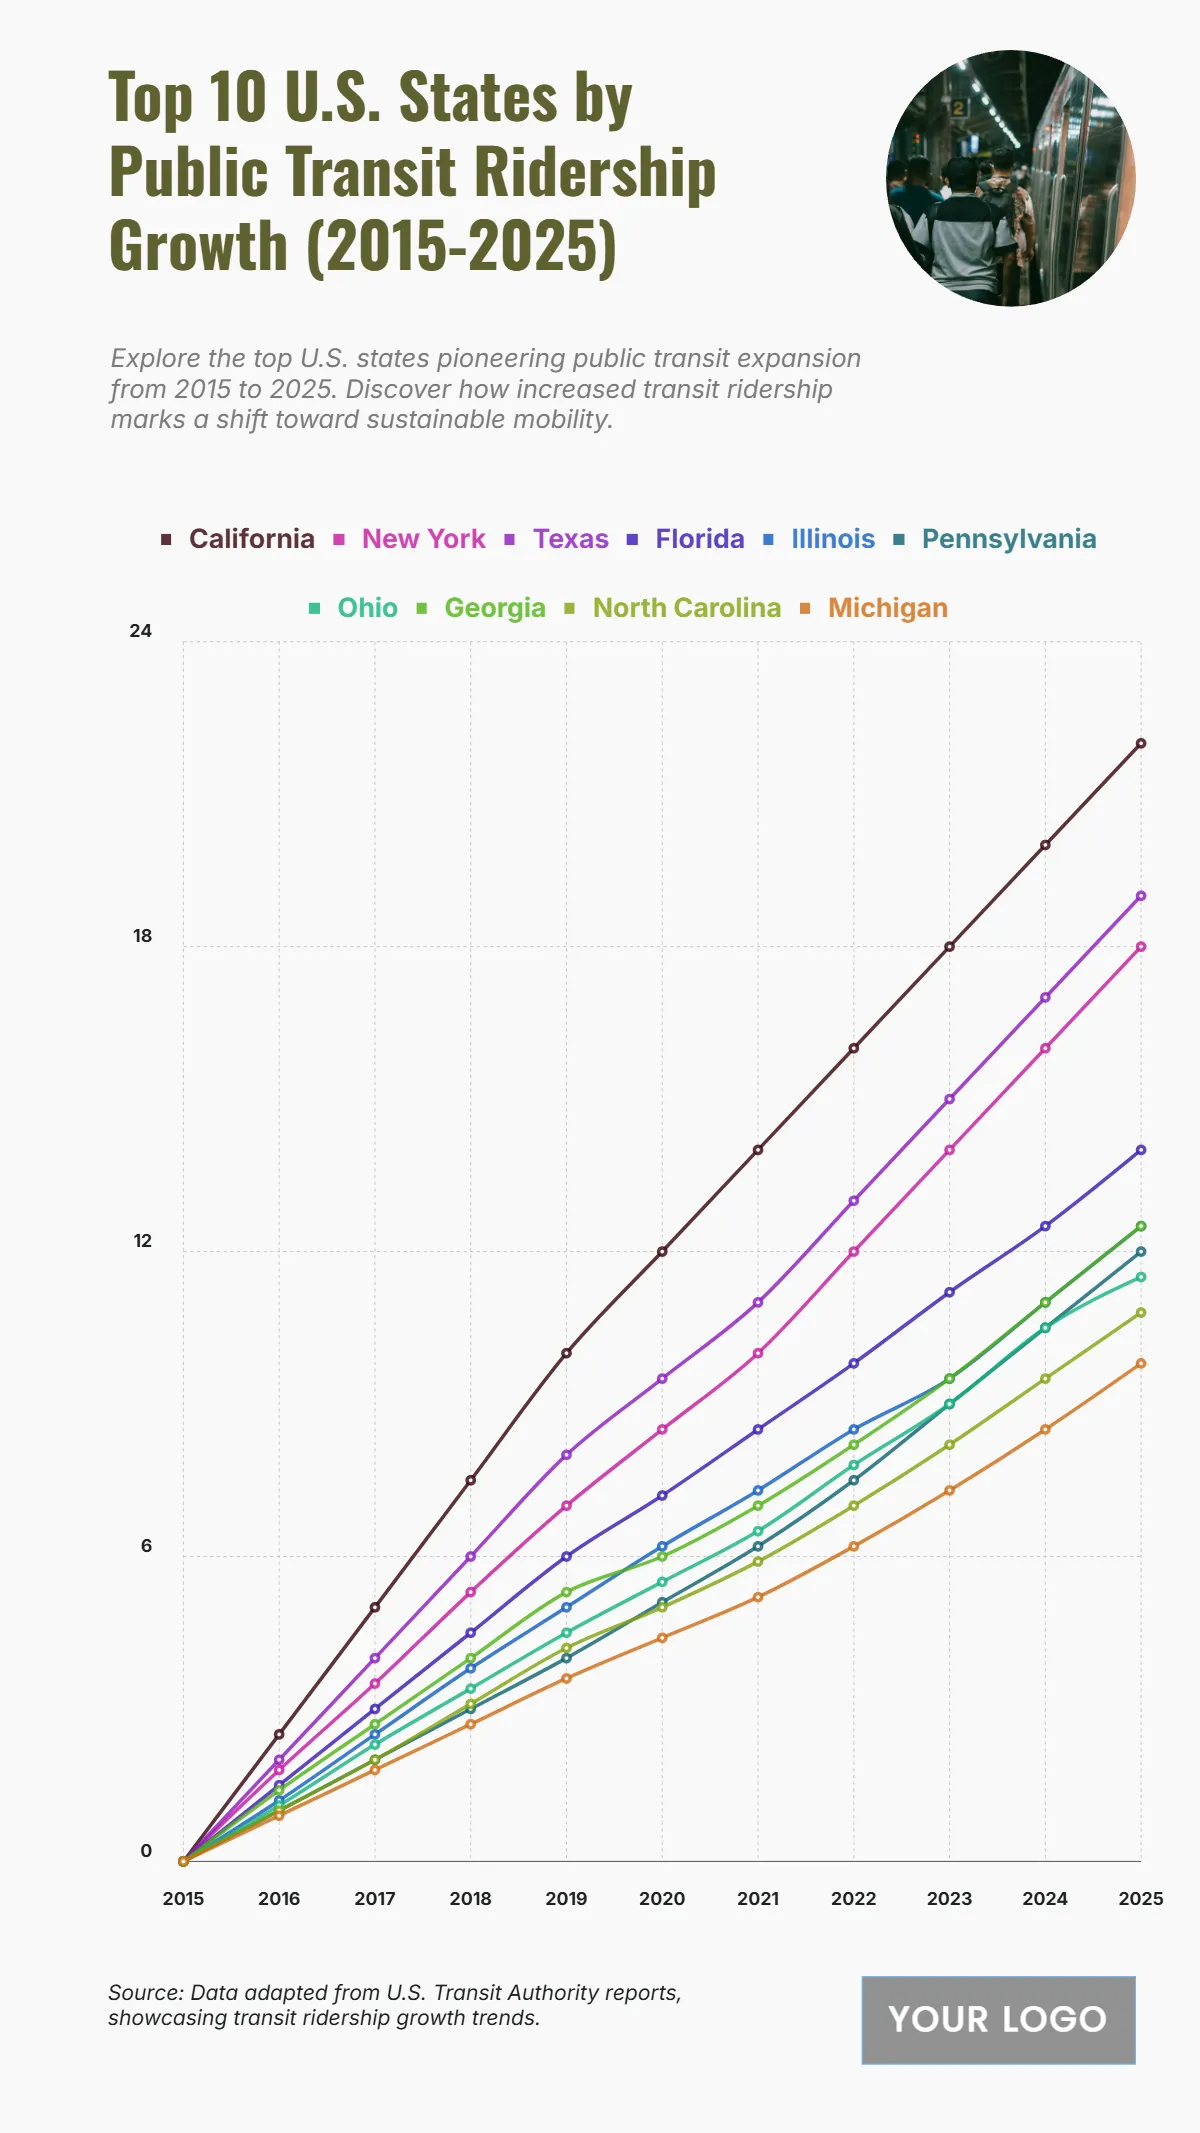
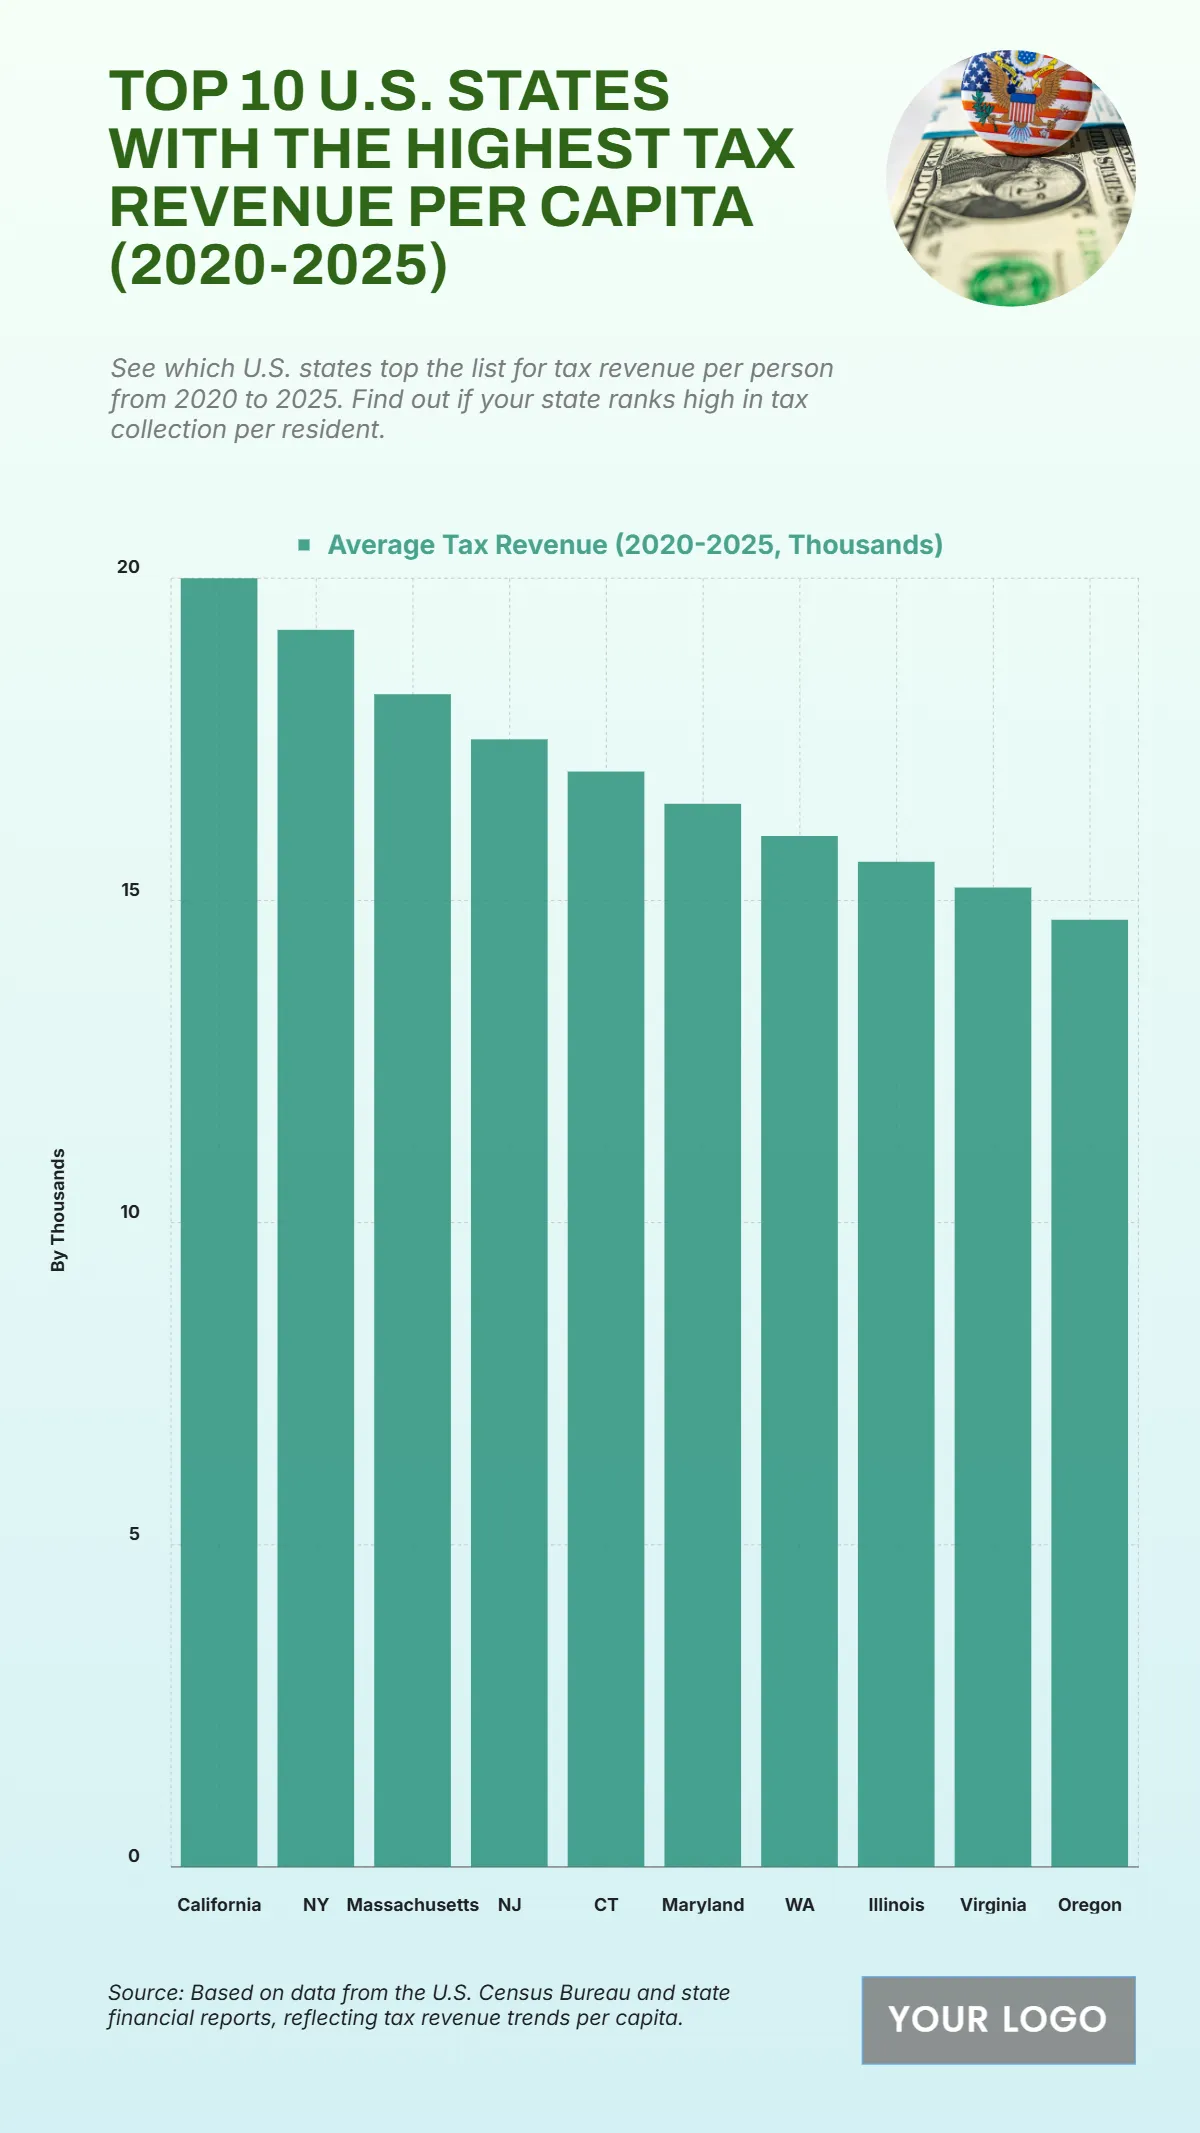
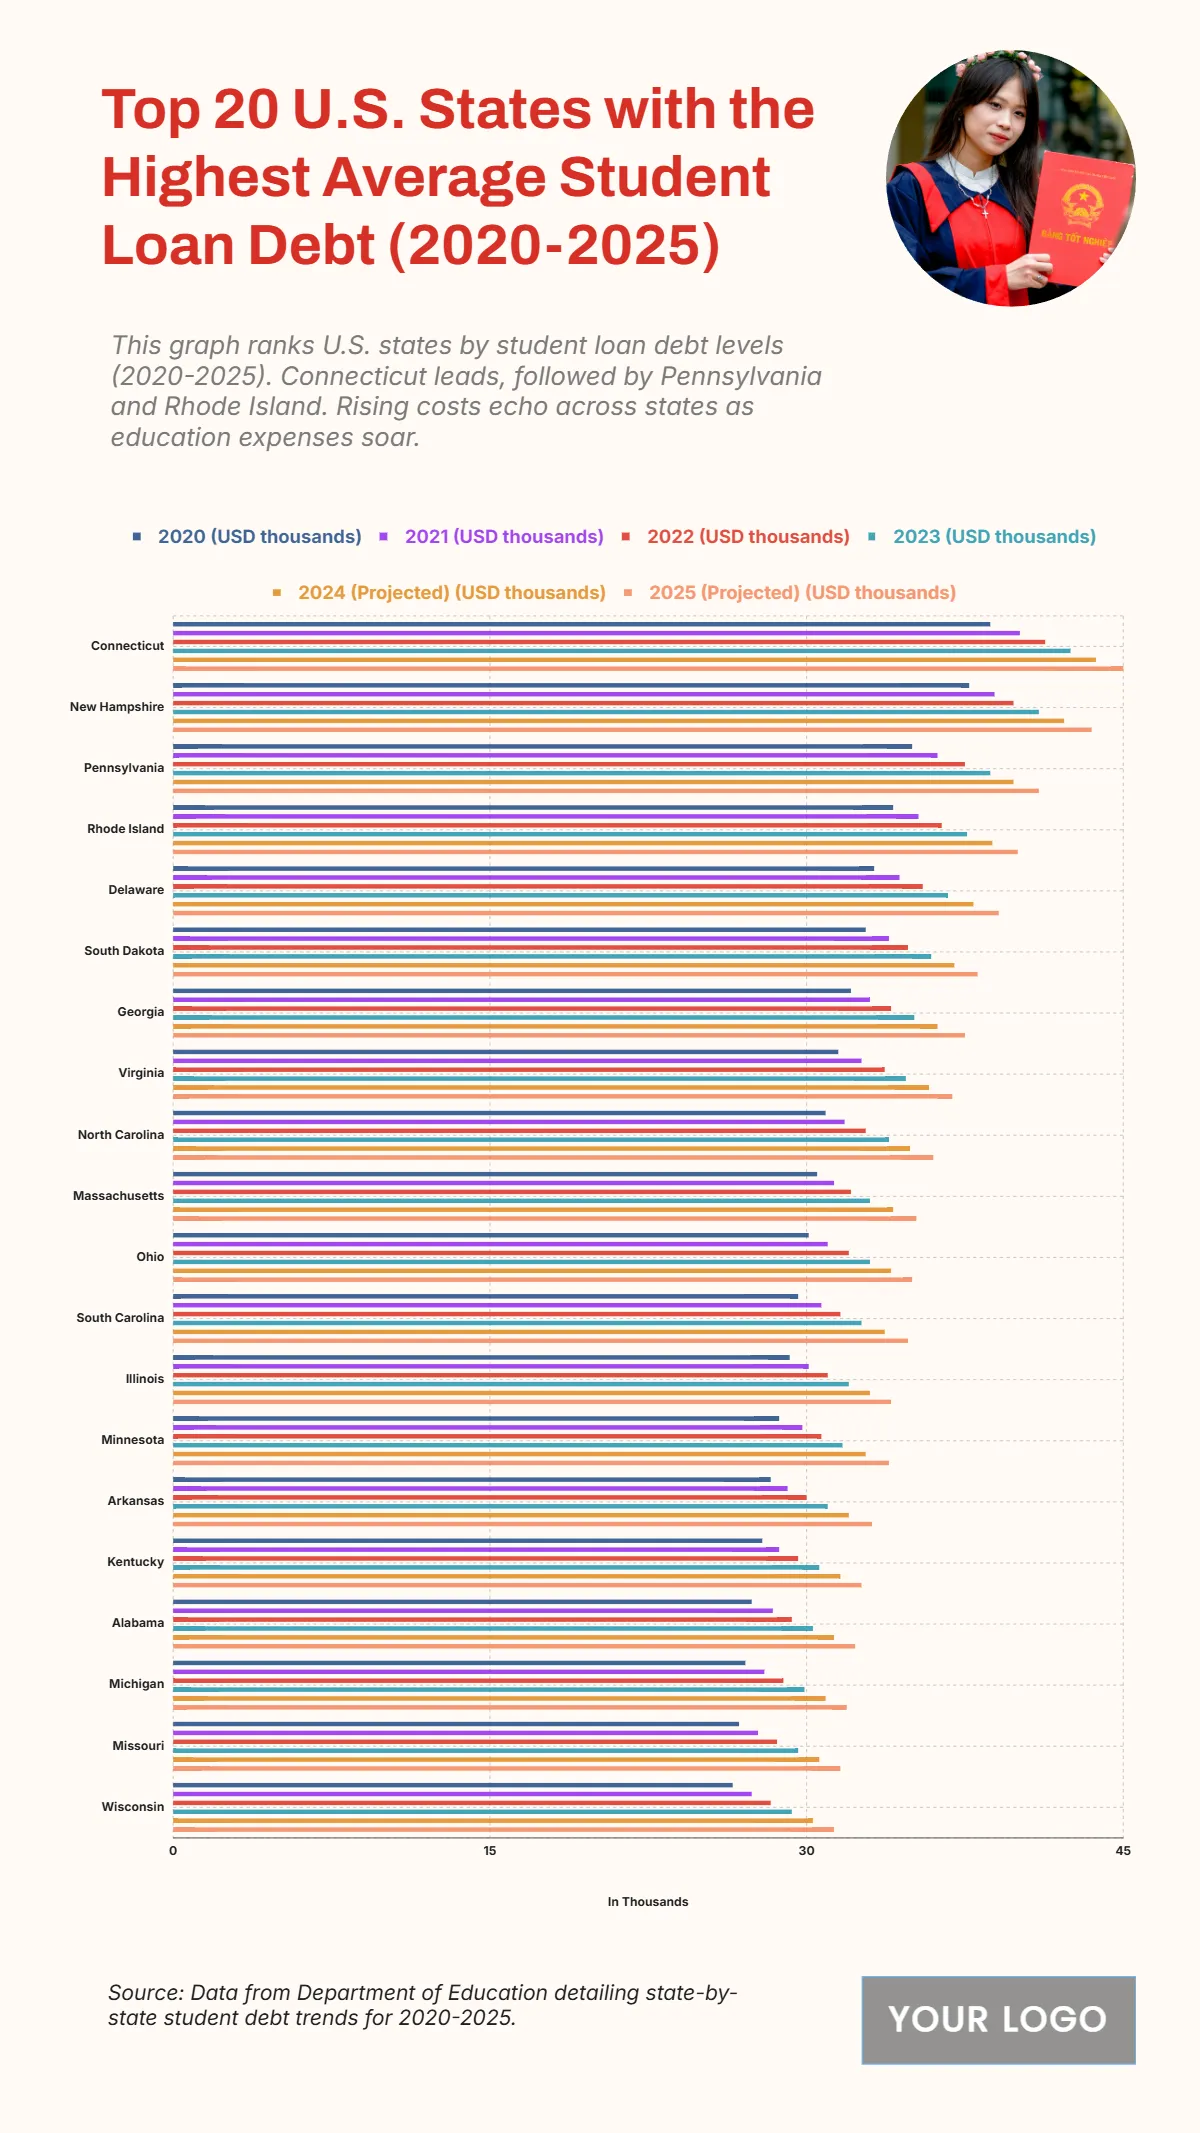
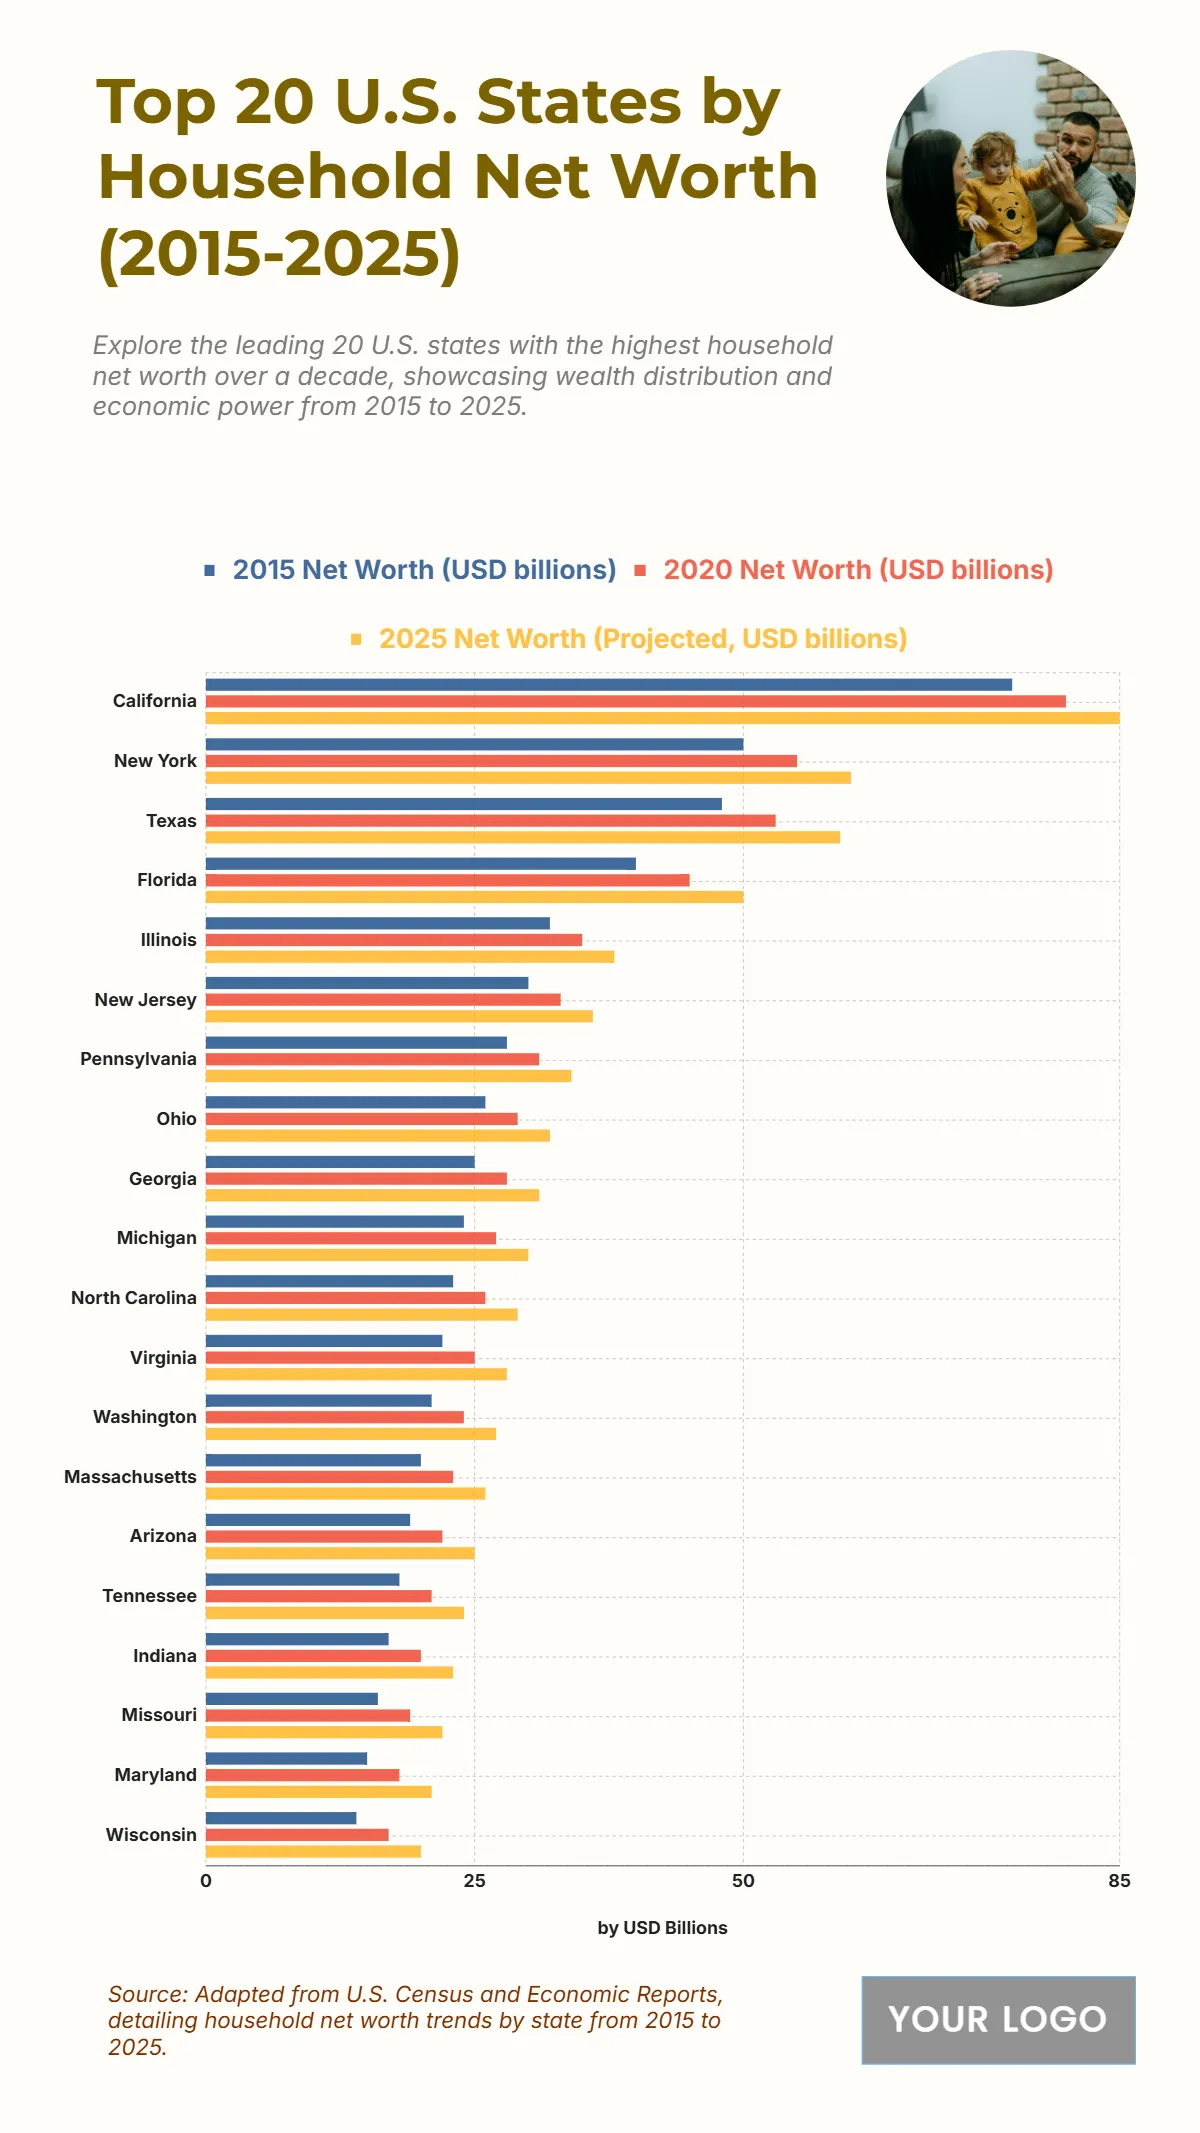
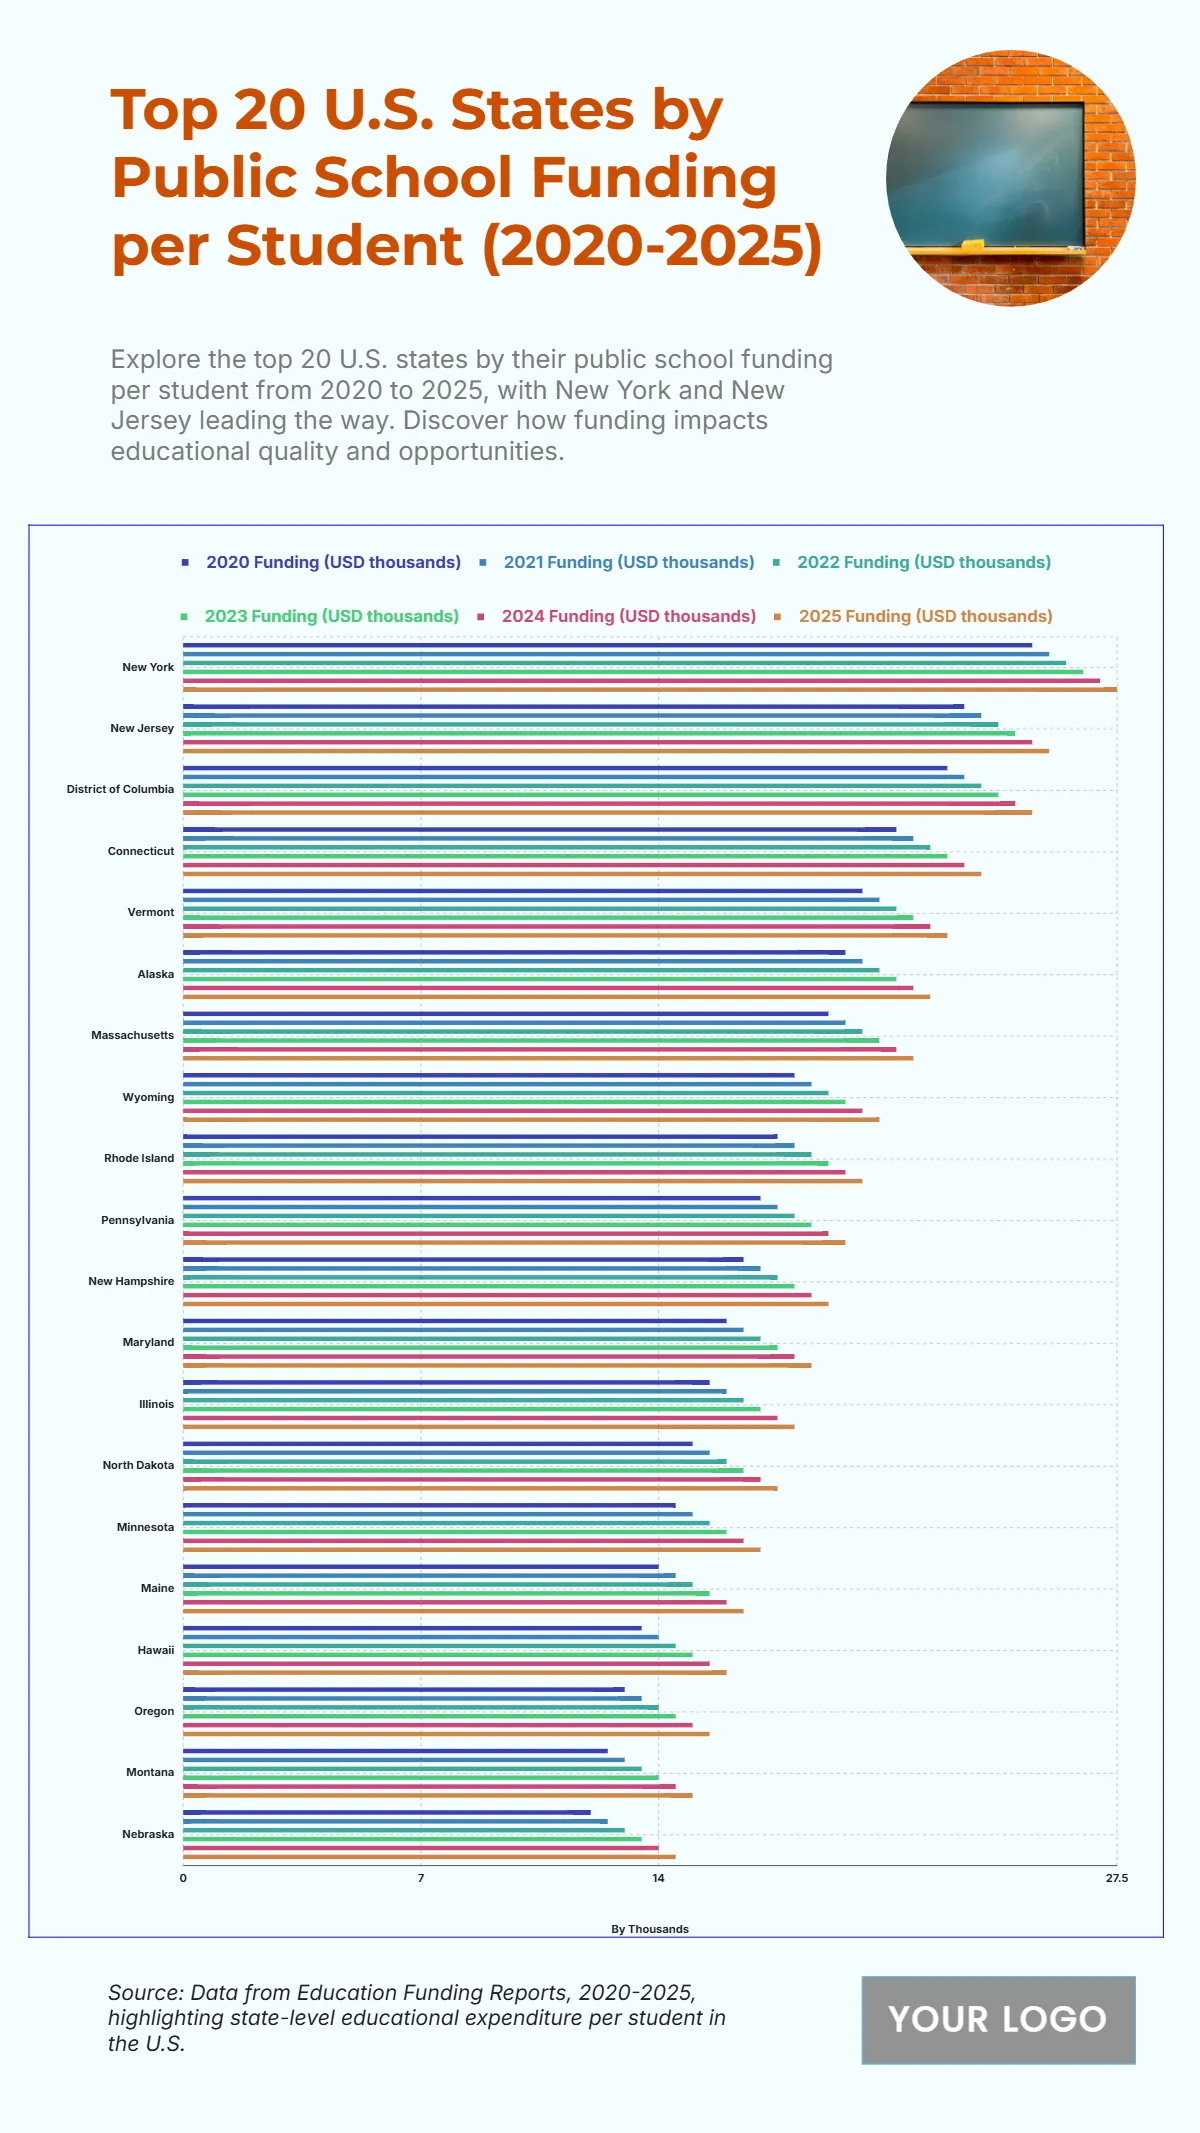
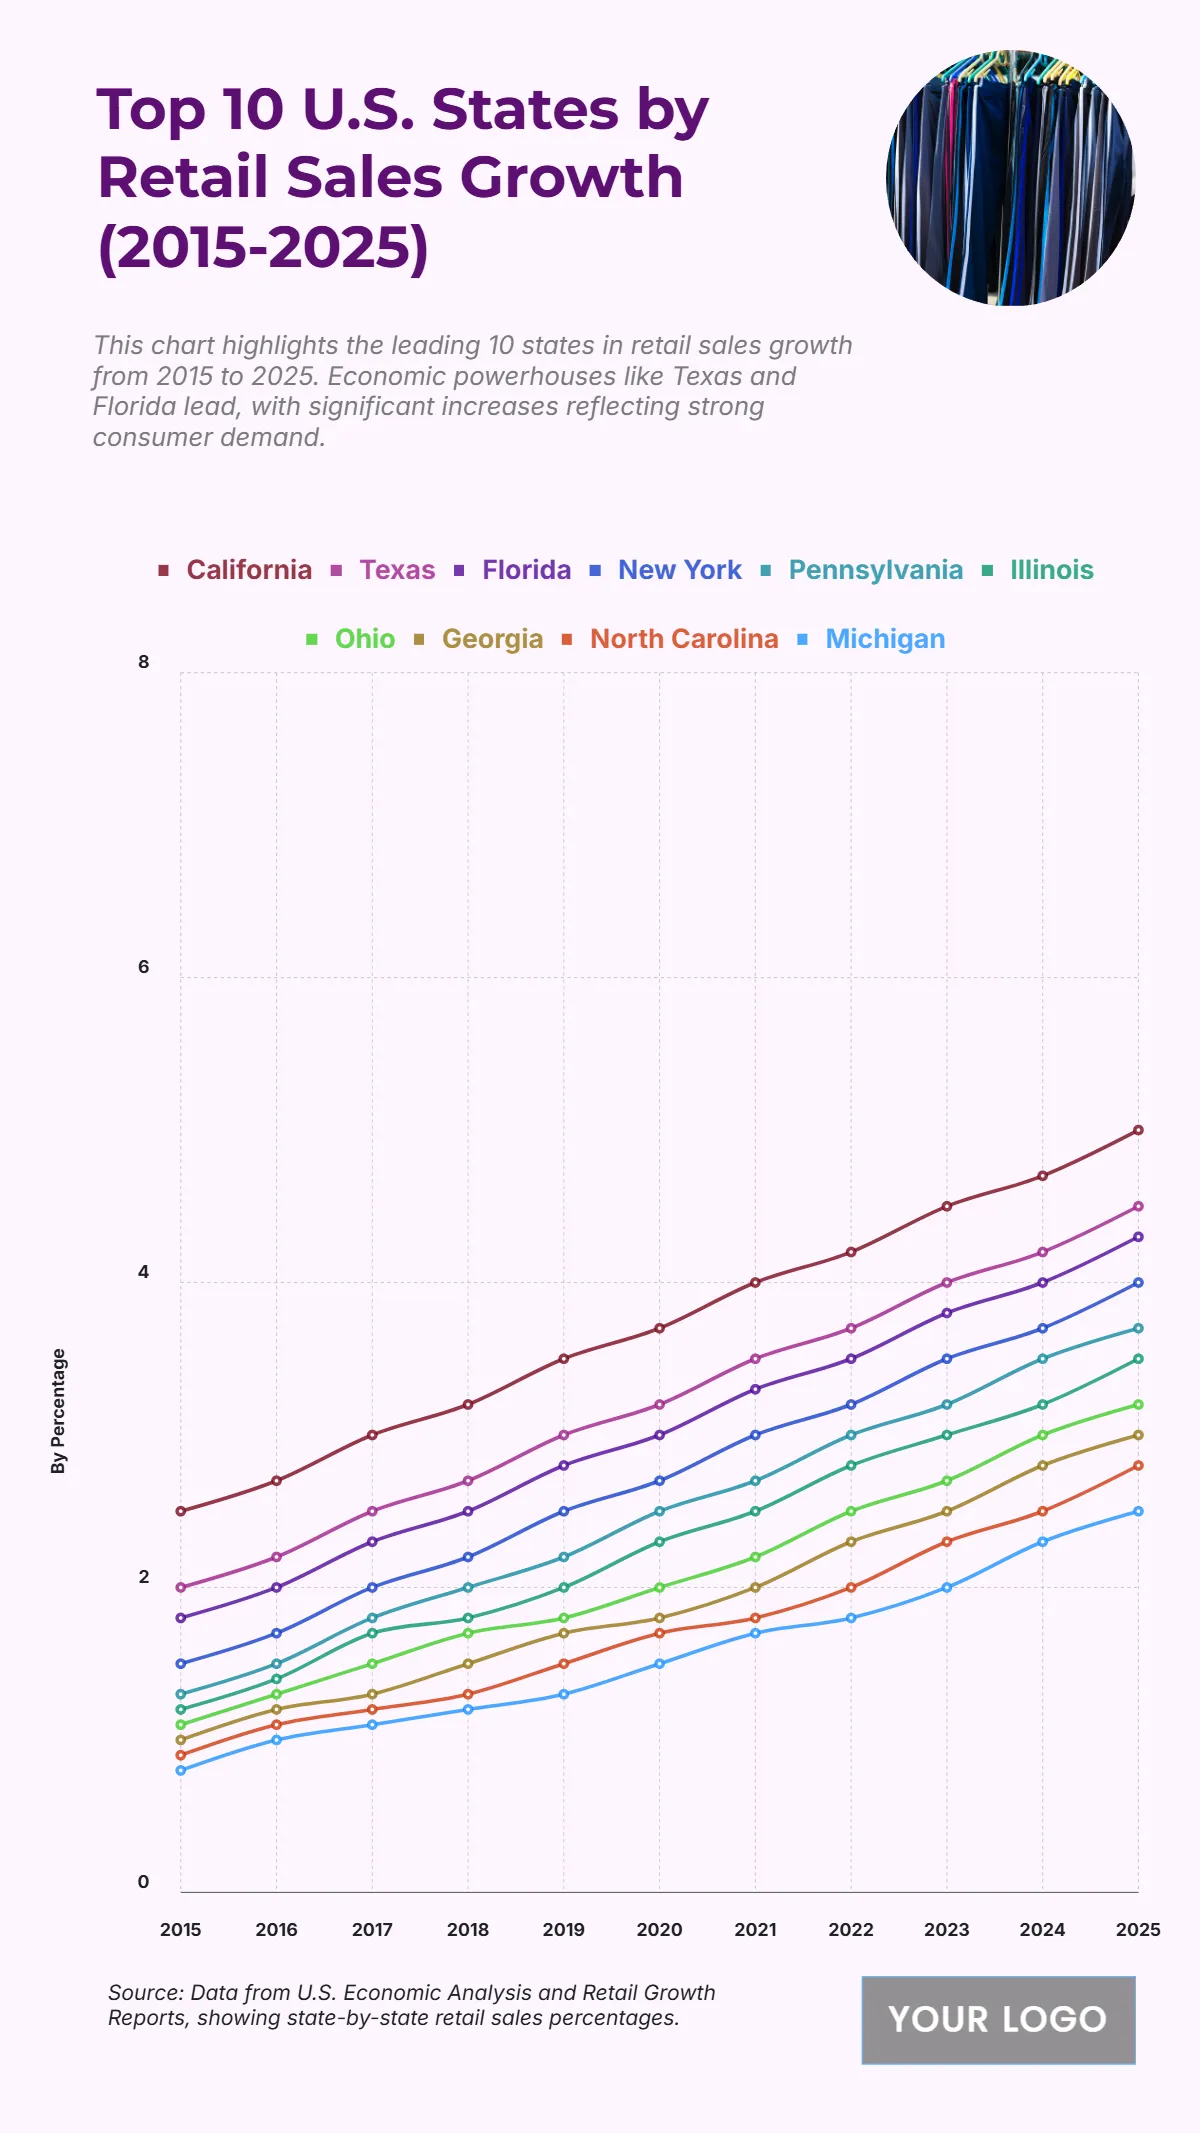
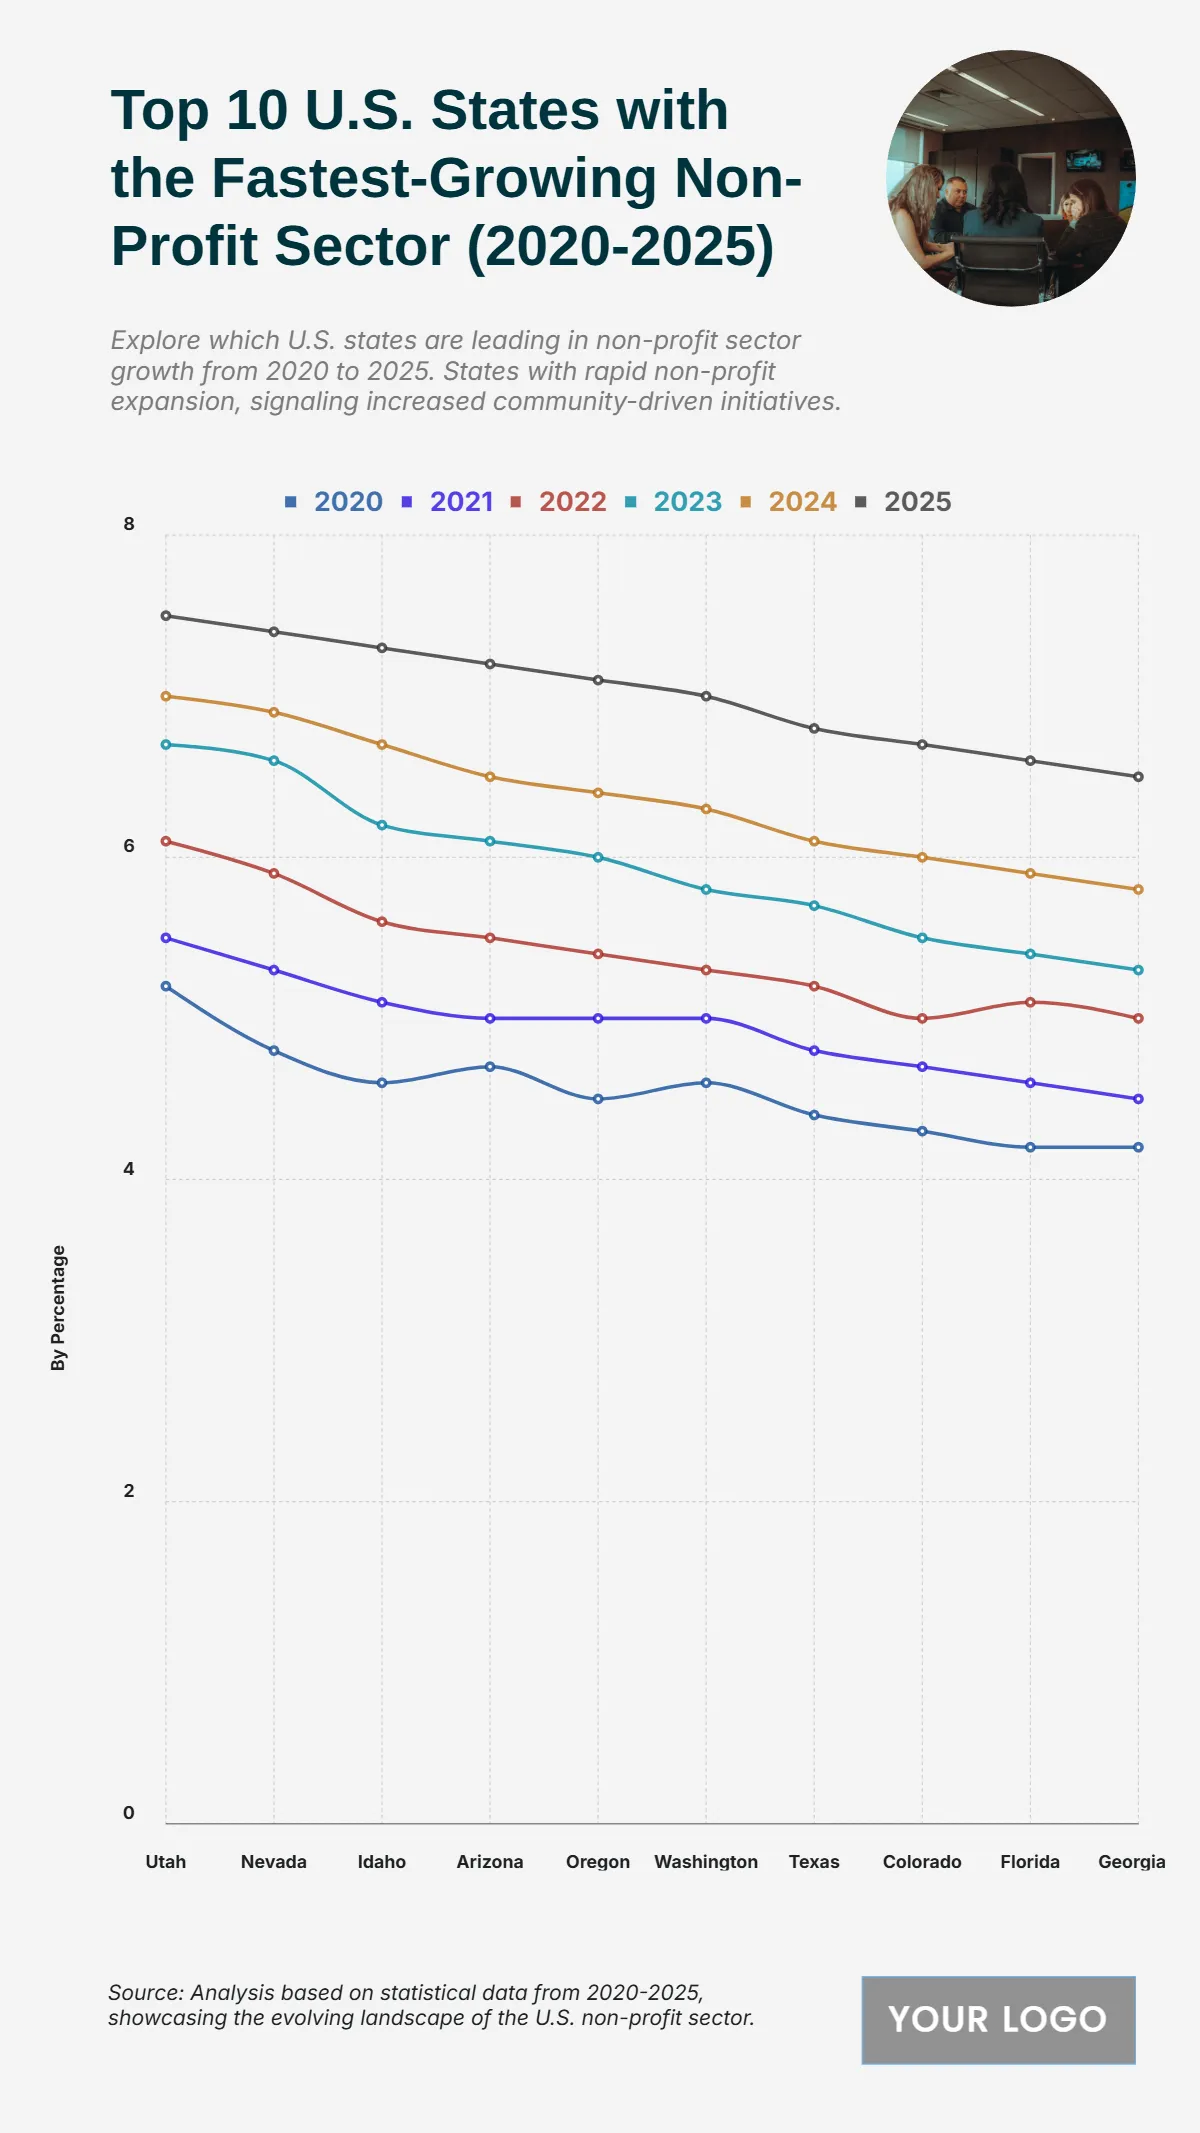
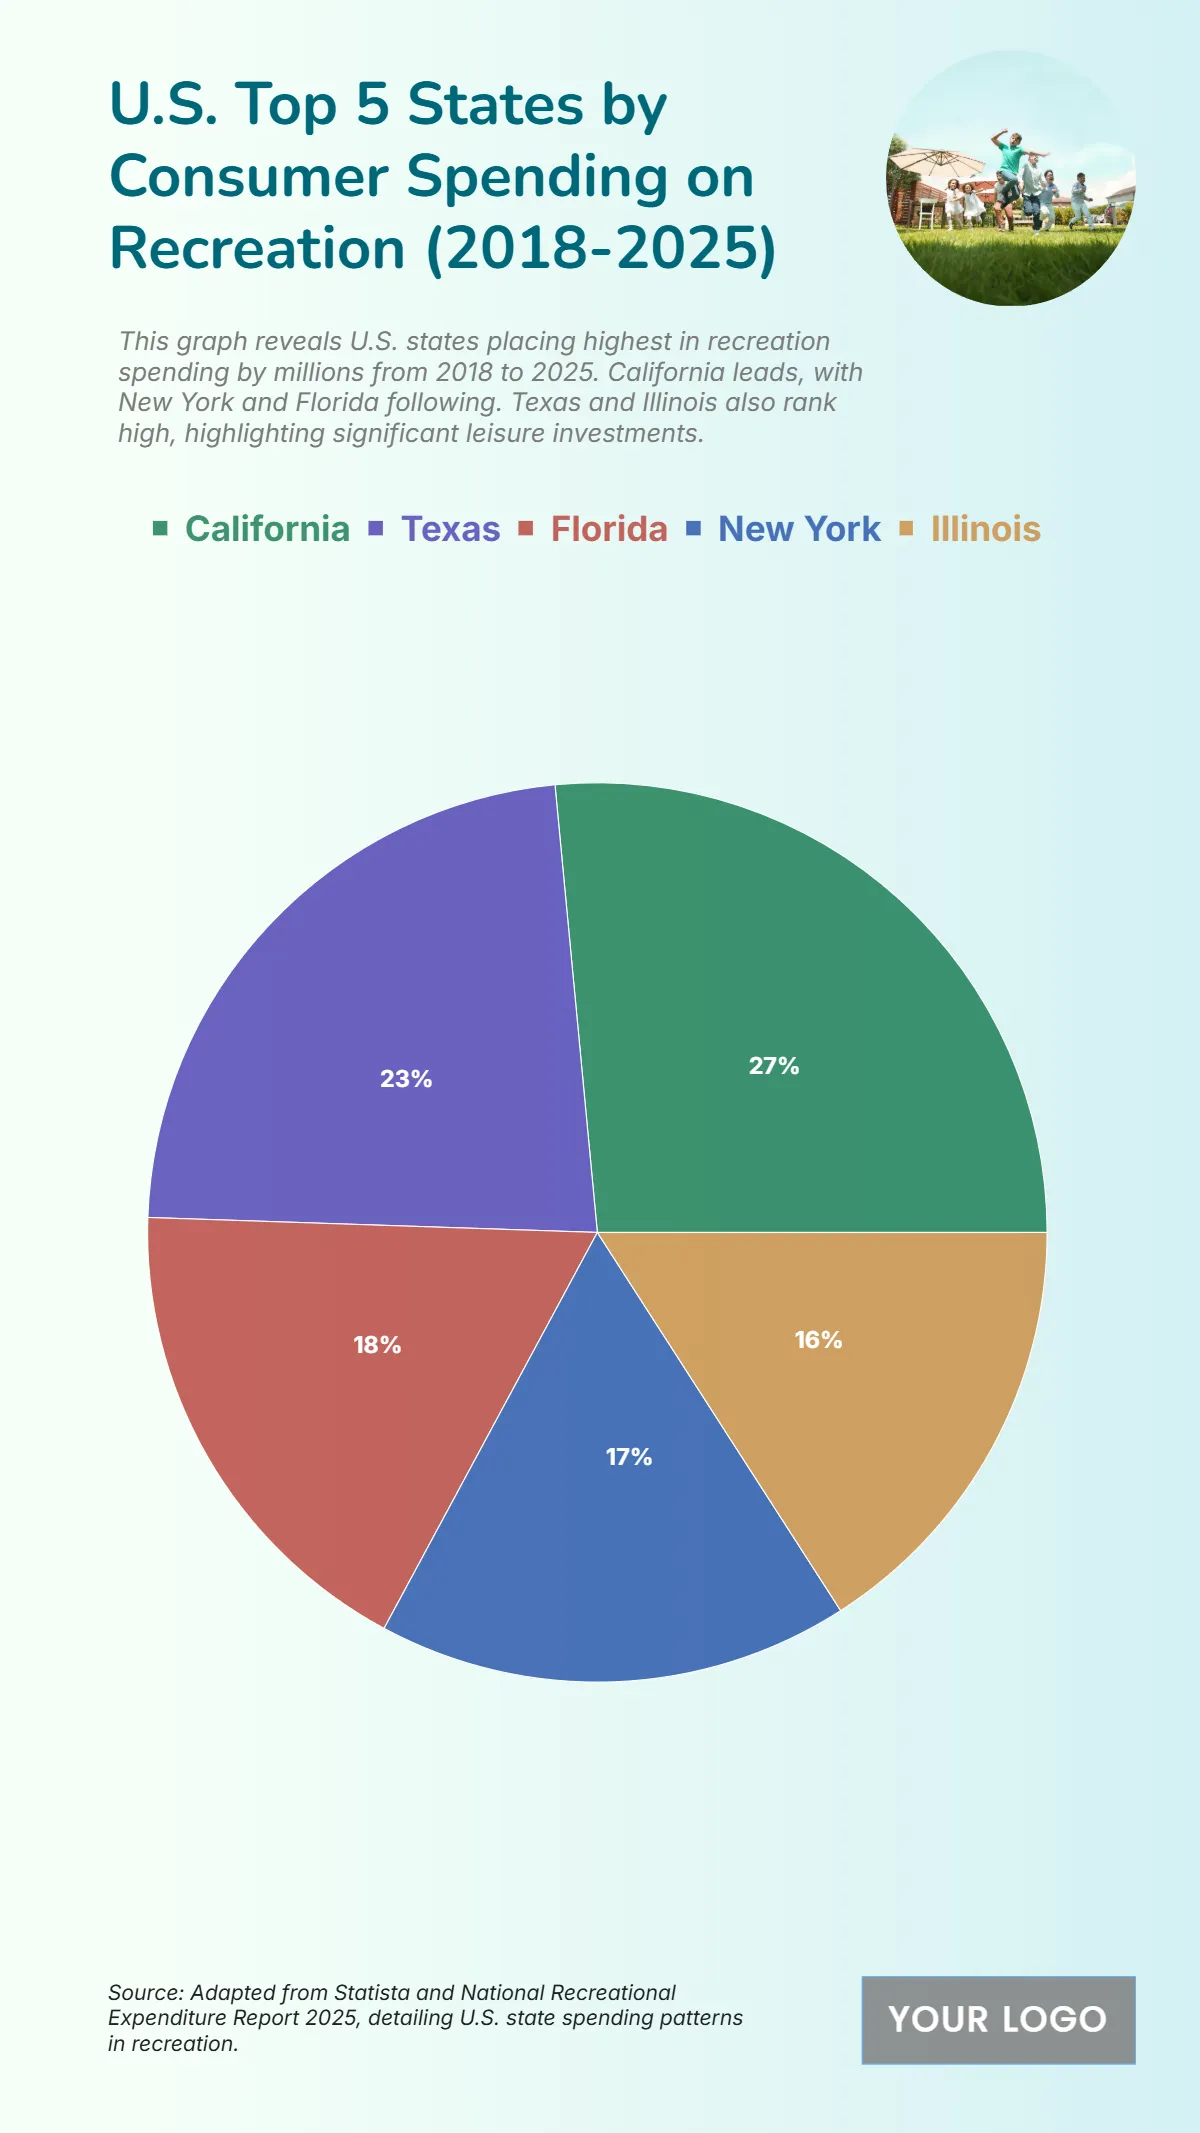
Stay ahead in business, finance, and research with Economy Chart Templates from Template.net! Designed for analysts, entrepreneurs, educators, and students who want to present economic data with clarity, these templates help you transform raw numbers into meaningful insights. Whether you’re tracking GDP trends, analyzing consumer spending, forecasting revenue, or presenting a market outlook, these templates make it easy to illustrate key findings and engage your audience. Each chart comes with editable data fields, customizable labels, and professional layouts, ensuring your reports and presentations are accurate, polished, and impactful.
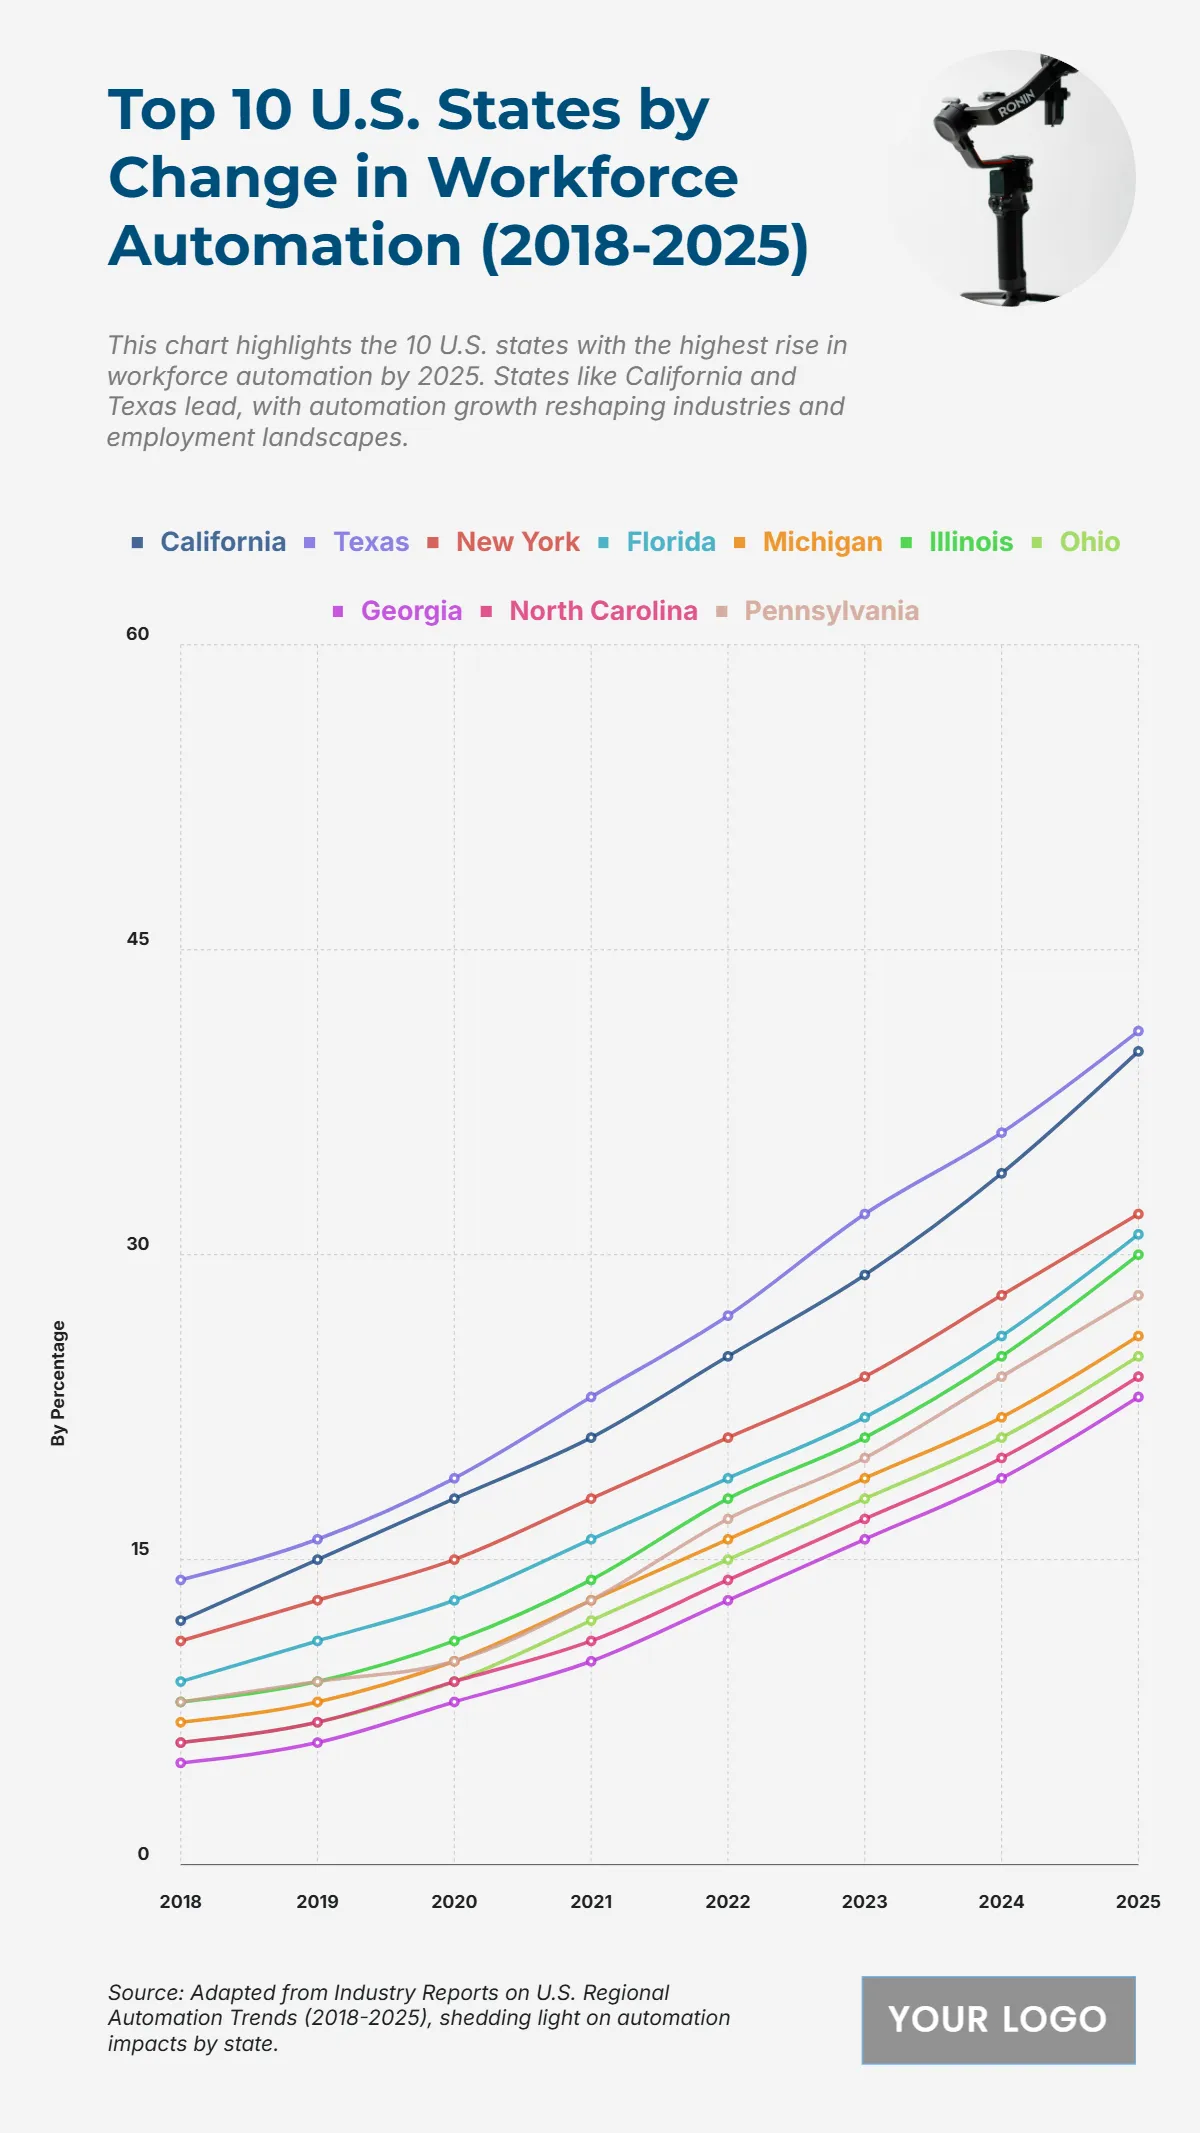
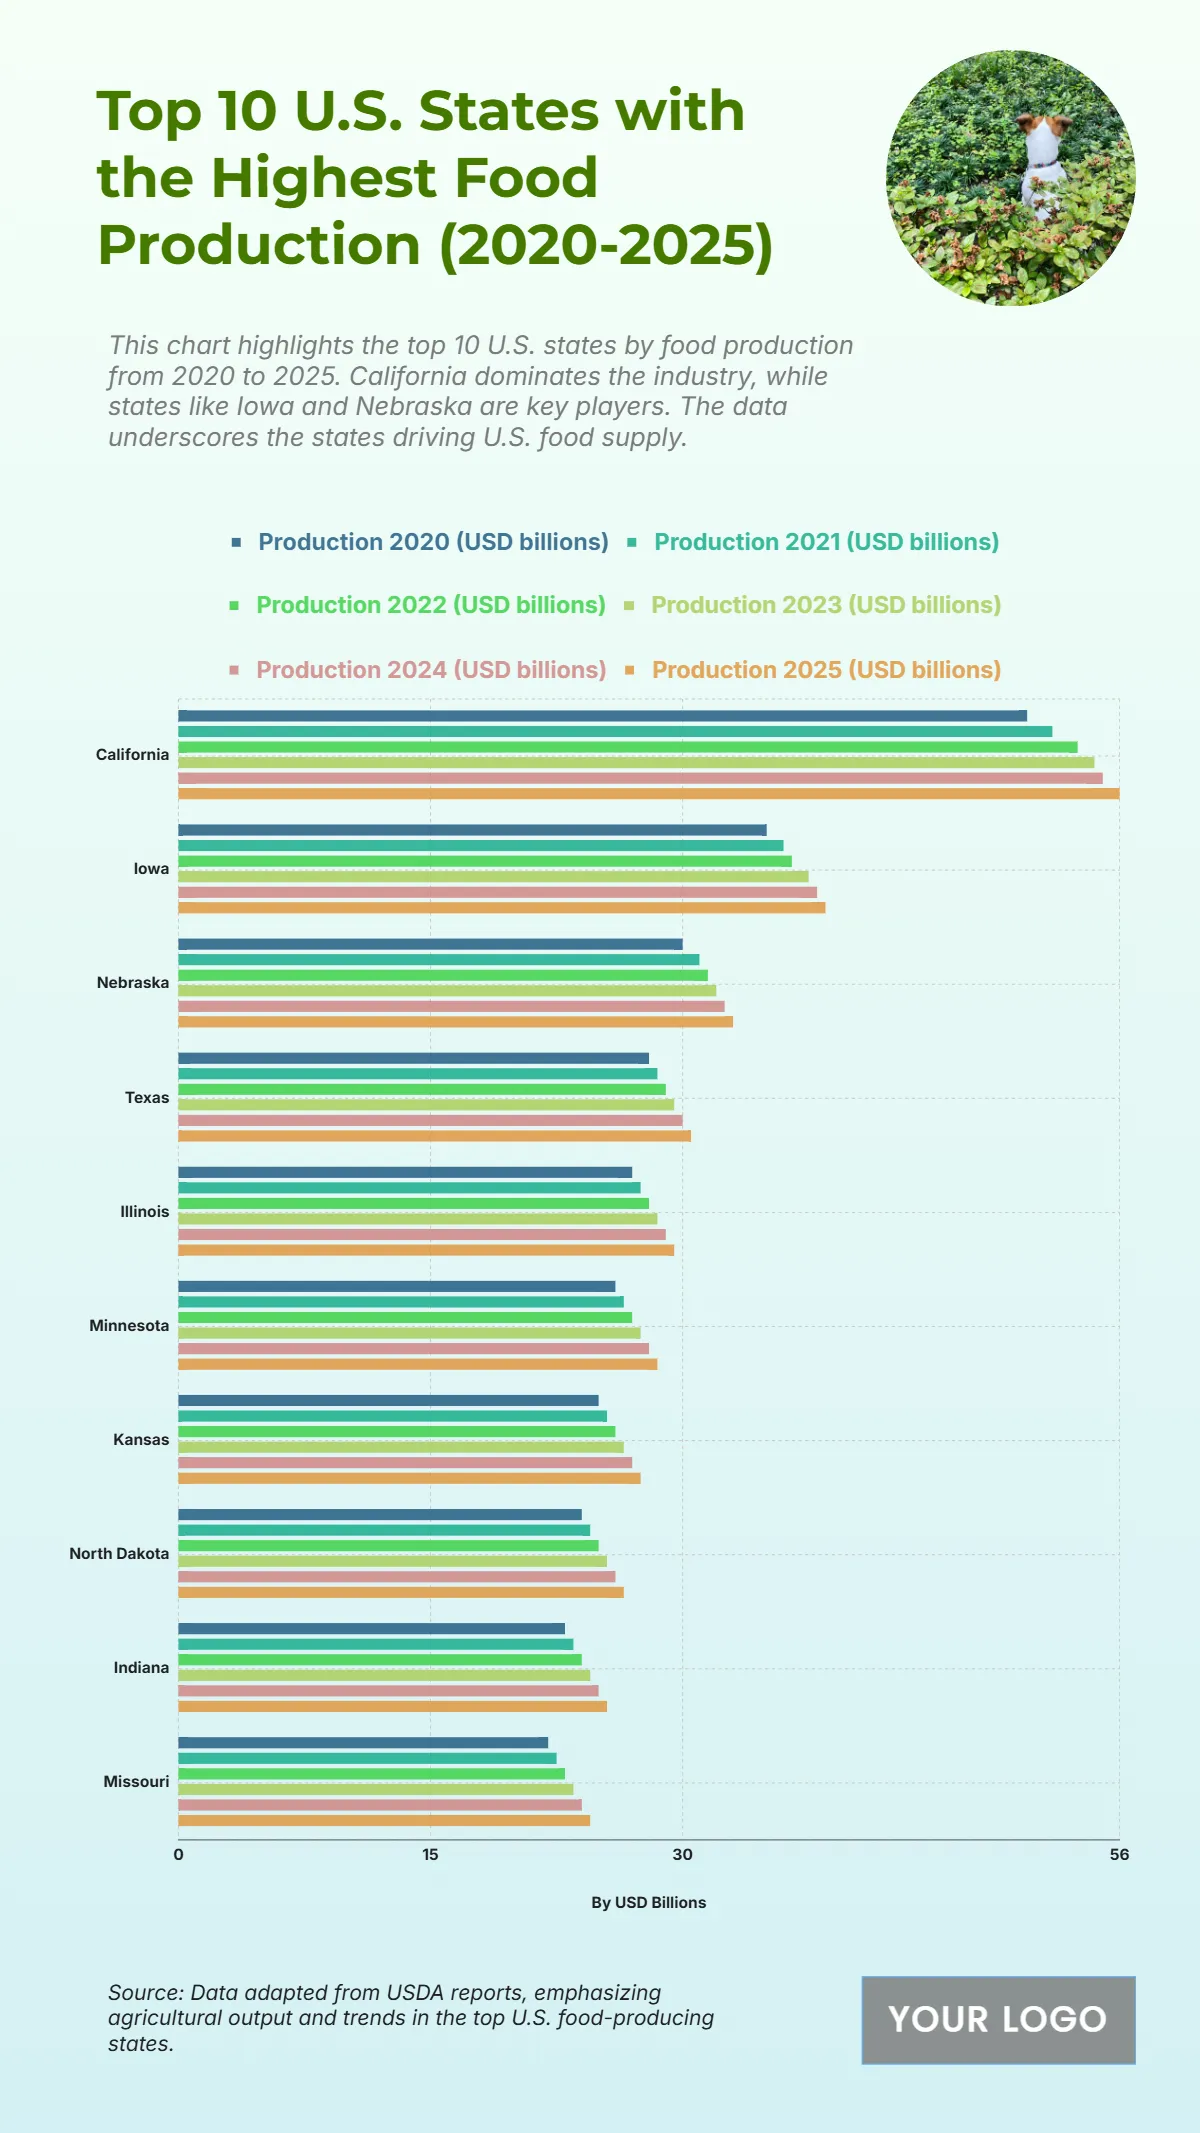
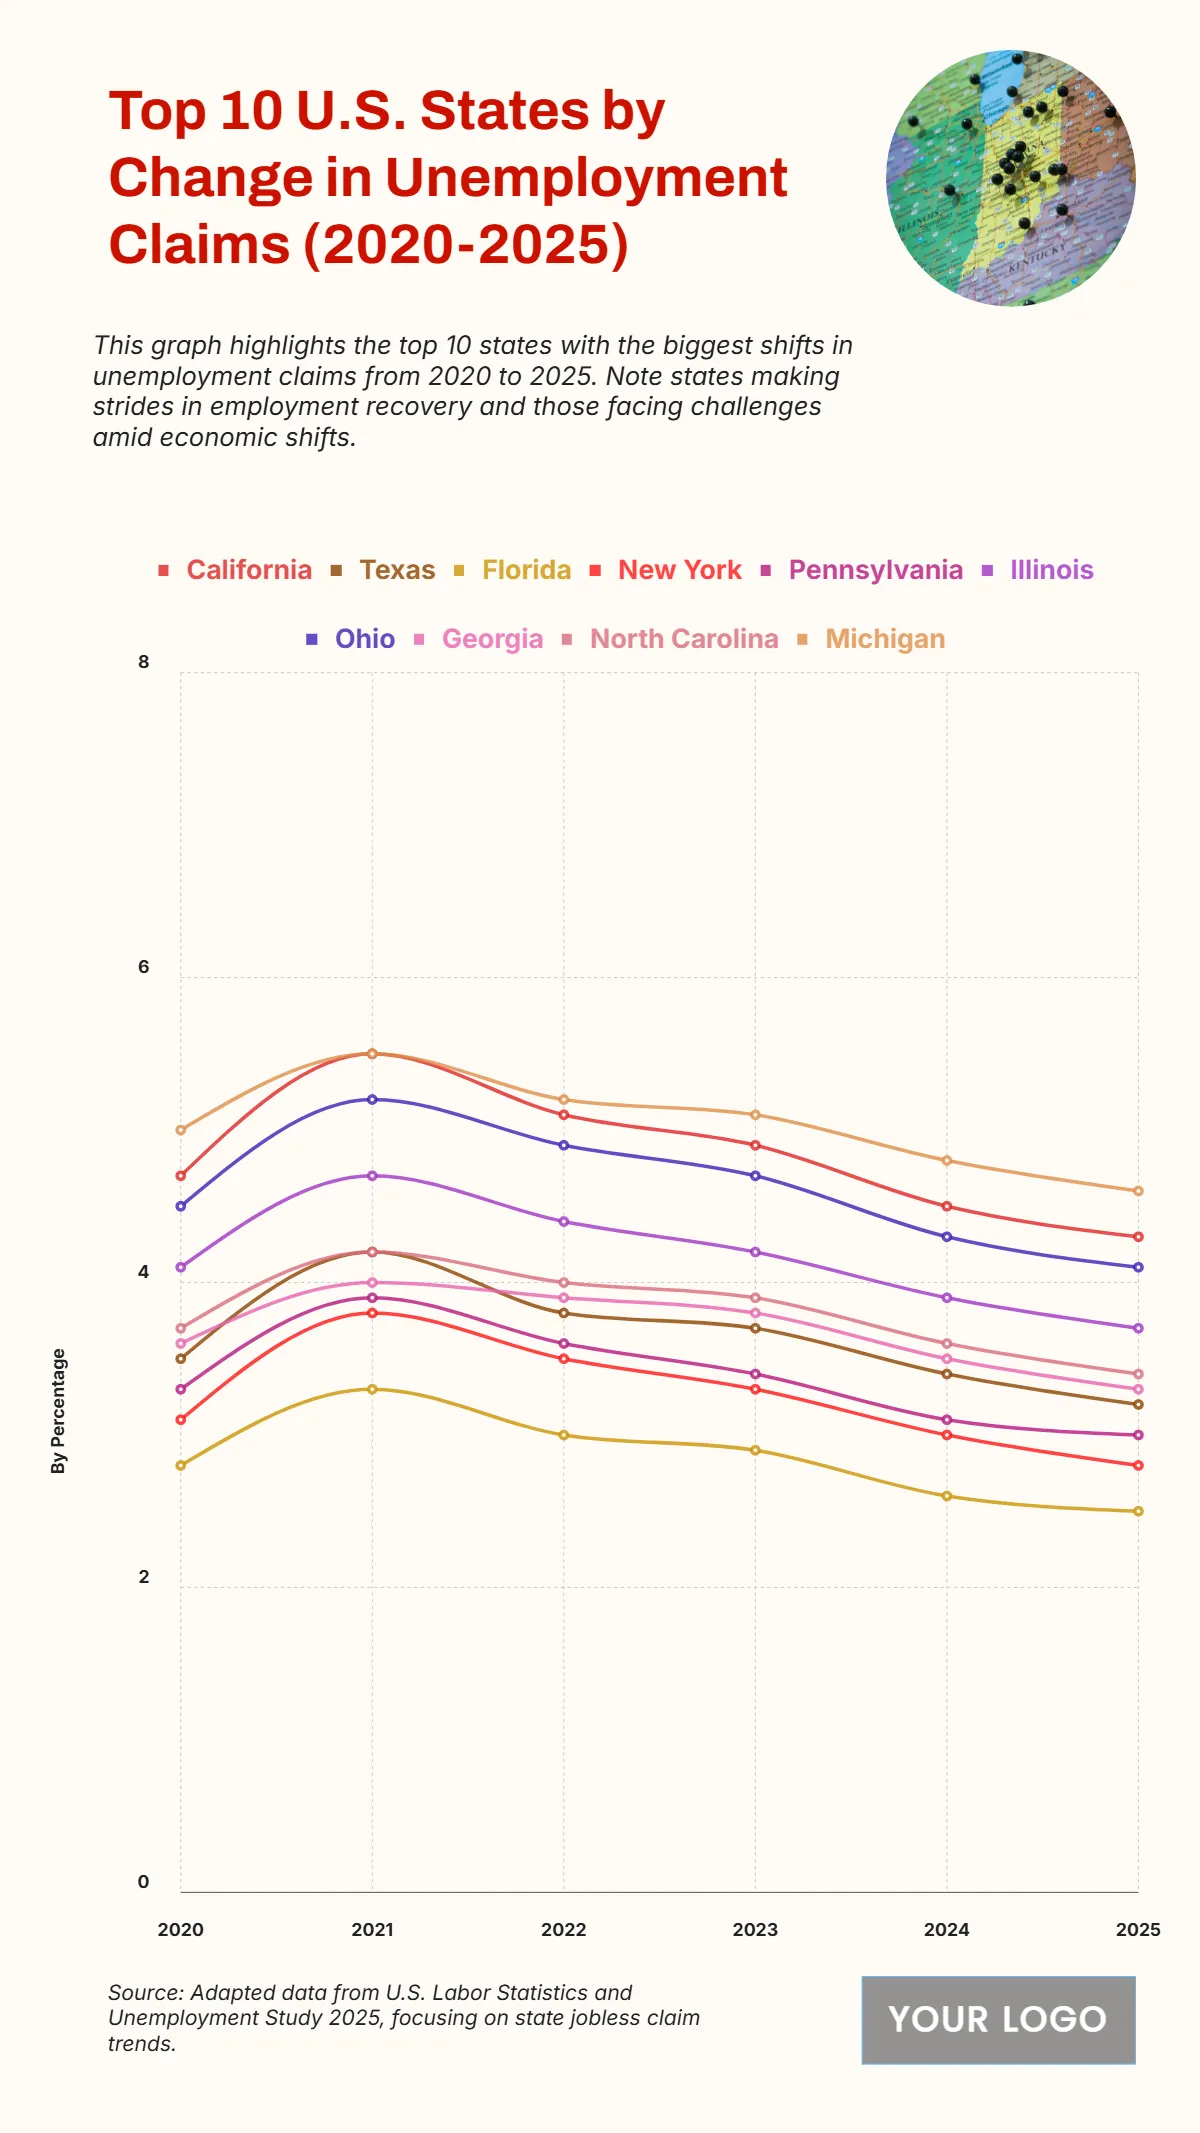
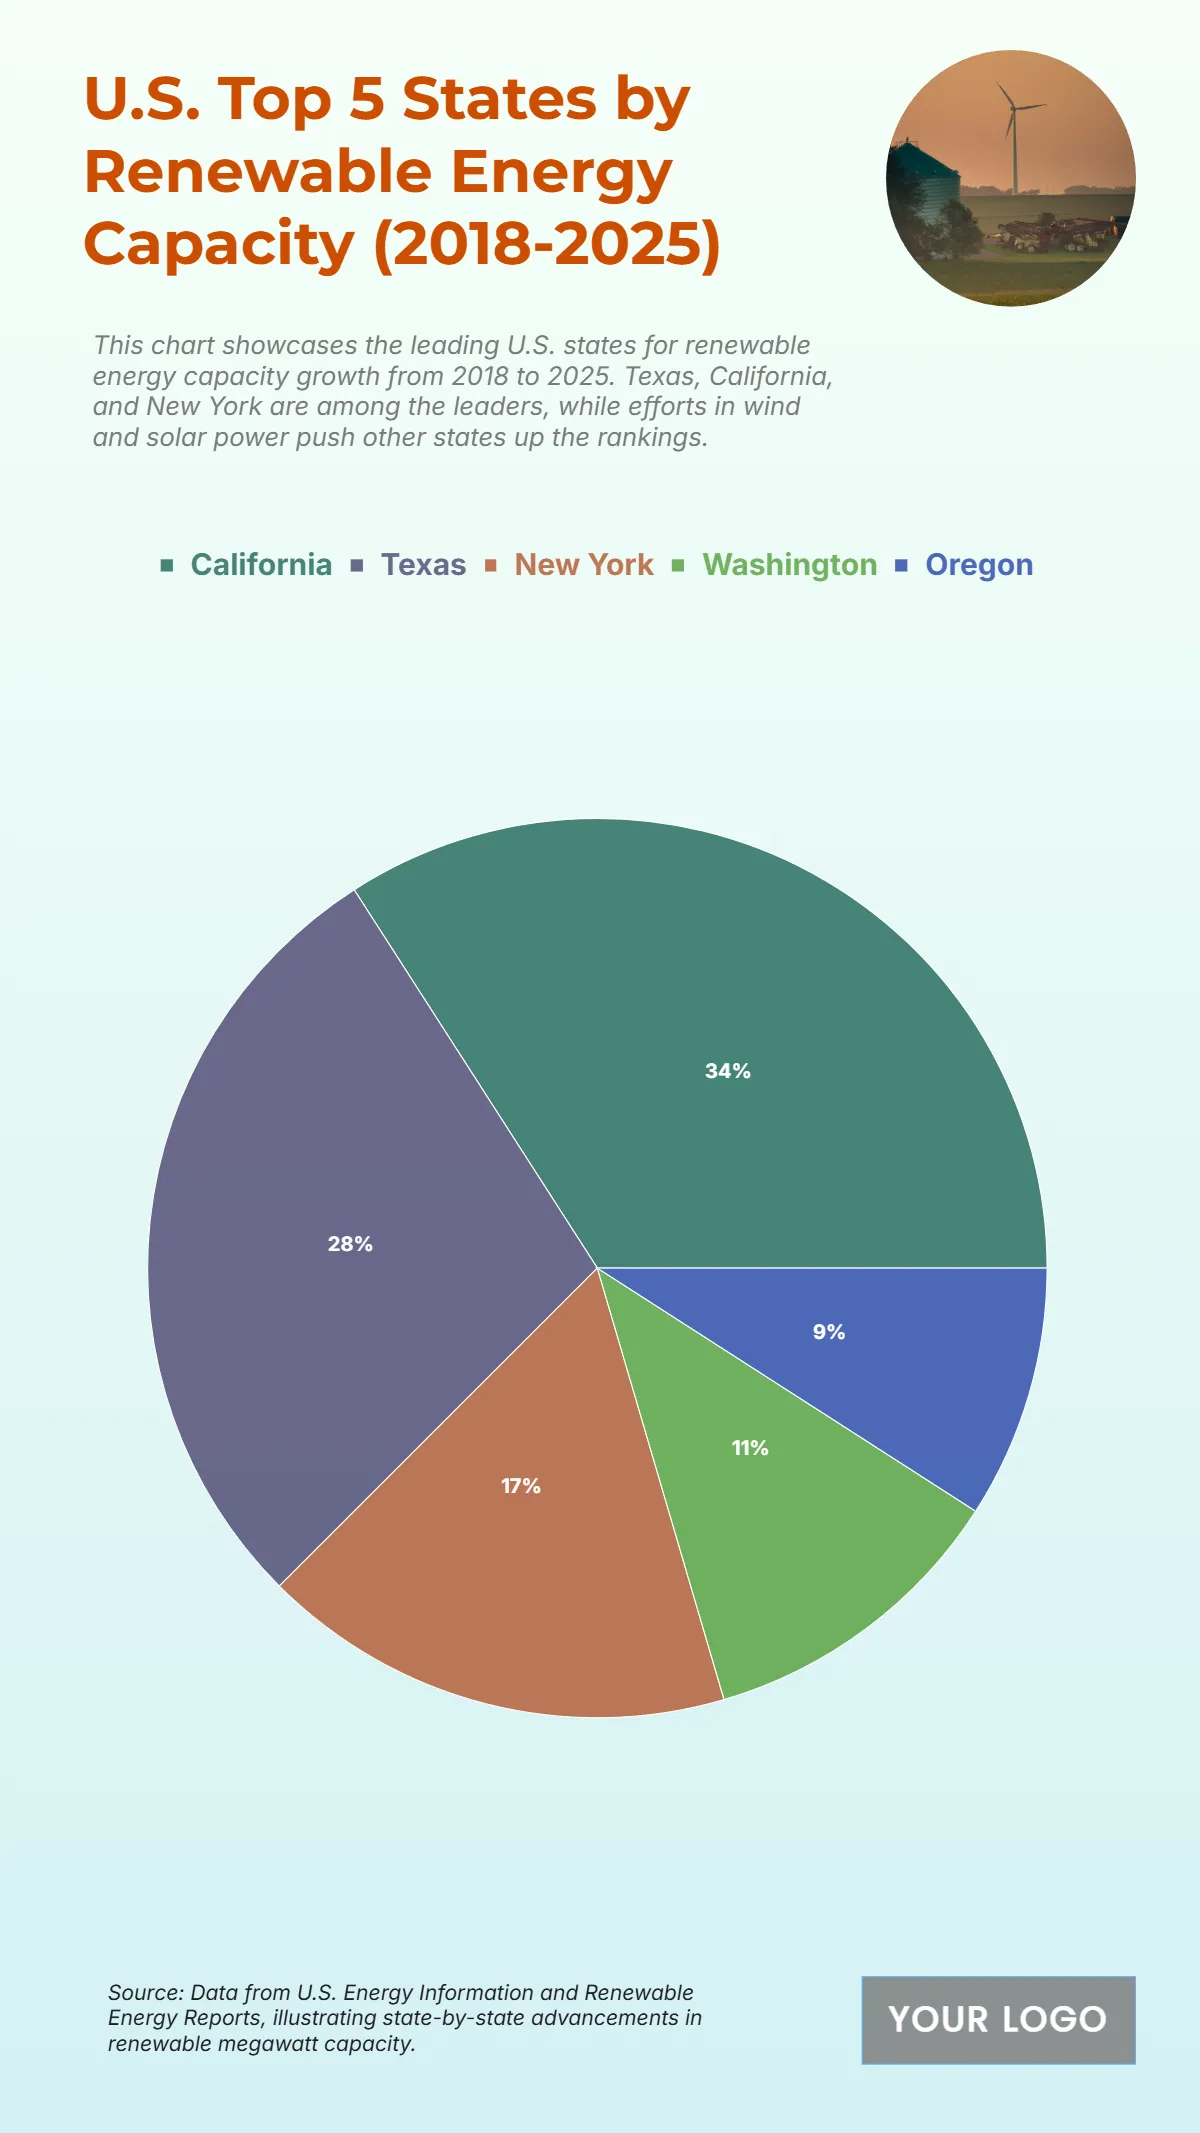
Discover the wide range of economy chart templates we have ready to support your goals. Choose from line charts, bar graphs, pie charts, and comparison tables that can be customized to match your branding and reporting style. Adjust colors, fonts, and chart types with just a few clicks, or enhance your visuals by adding icons, annotations, and advanced data highlights. With drag-and-drop ease and no design skills required, you can build professional charts in minutes. Plus, our ever-expanding library of updated templates ensures you’ll always have access to the latest styles and formats for every project. Once your chart is complete, download it for reports, share it digitally with stakeholders, or embed it in your presentations for a professional finish that drives decisions with confidence.


