Bring Your Data Visualization to Life with Scatter Graph Chart Templates from Template.net
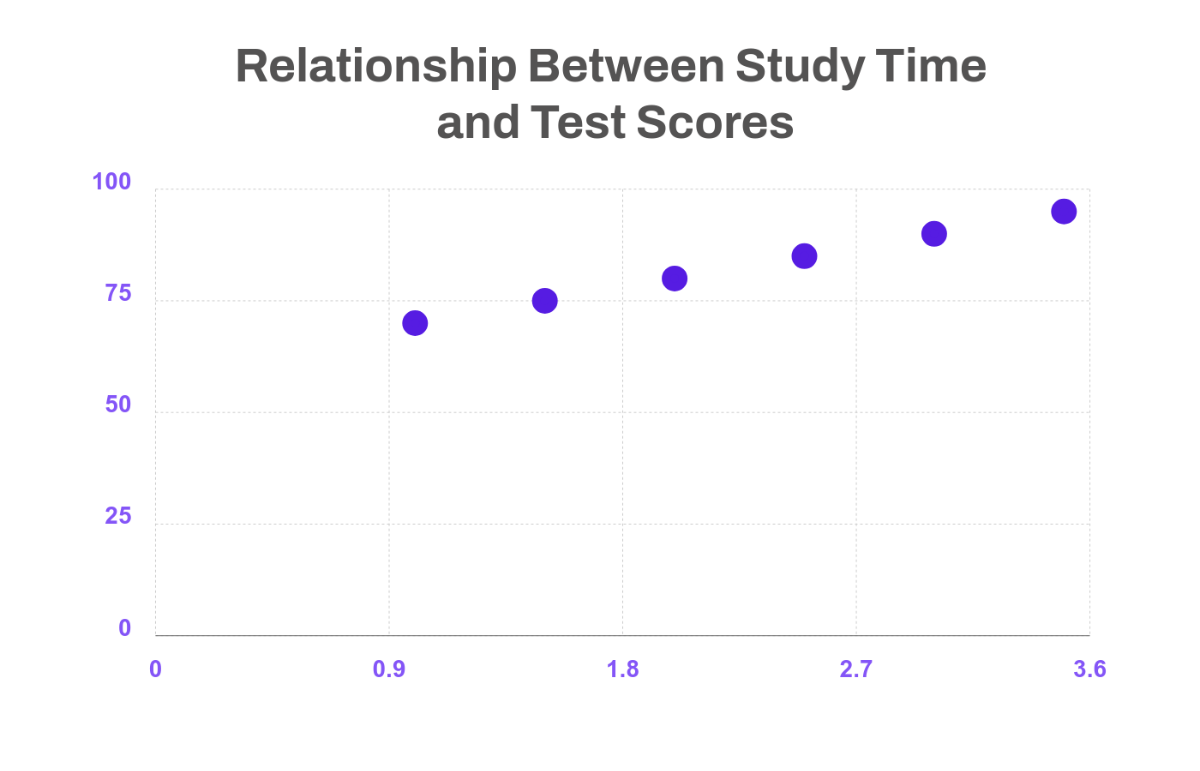
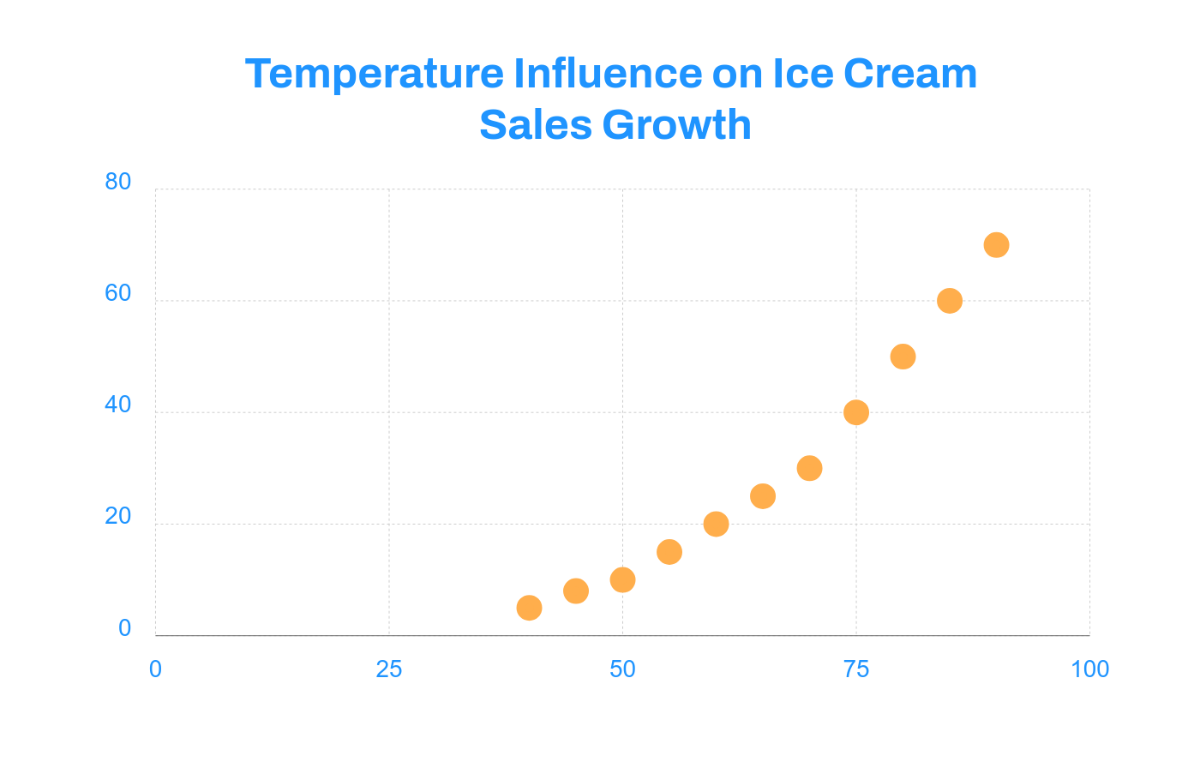
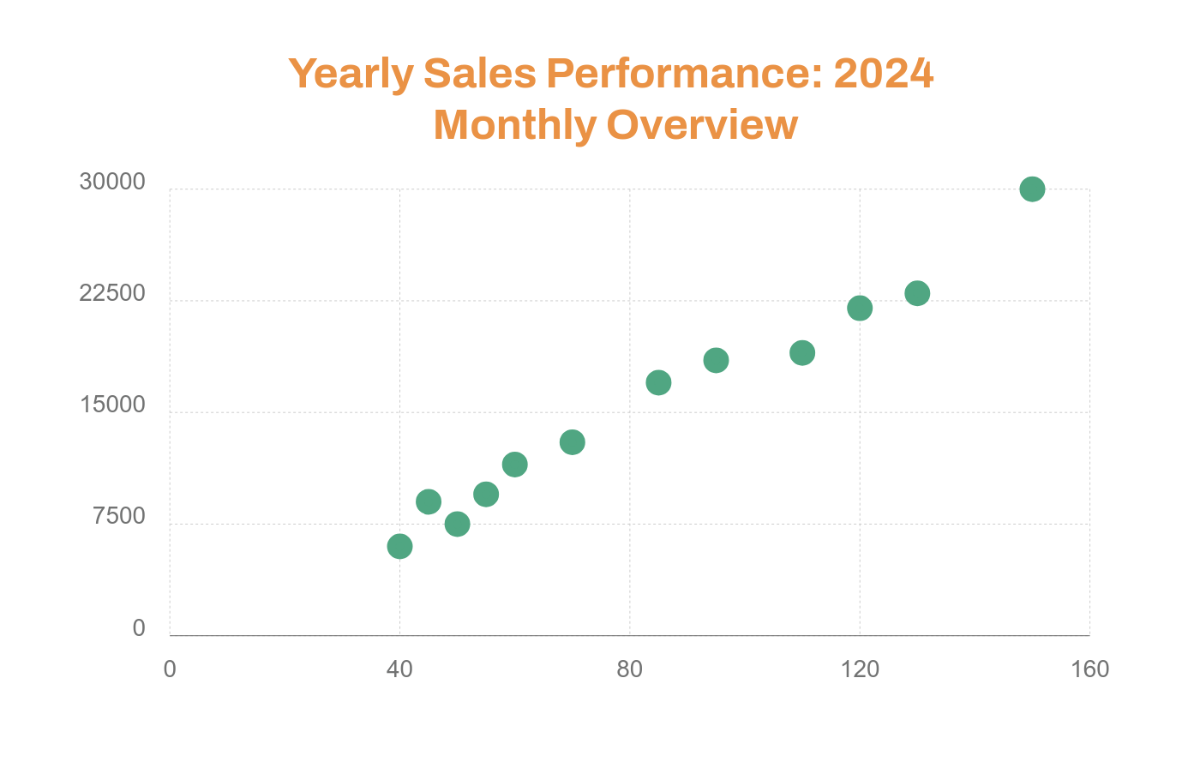
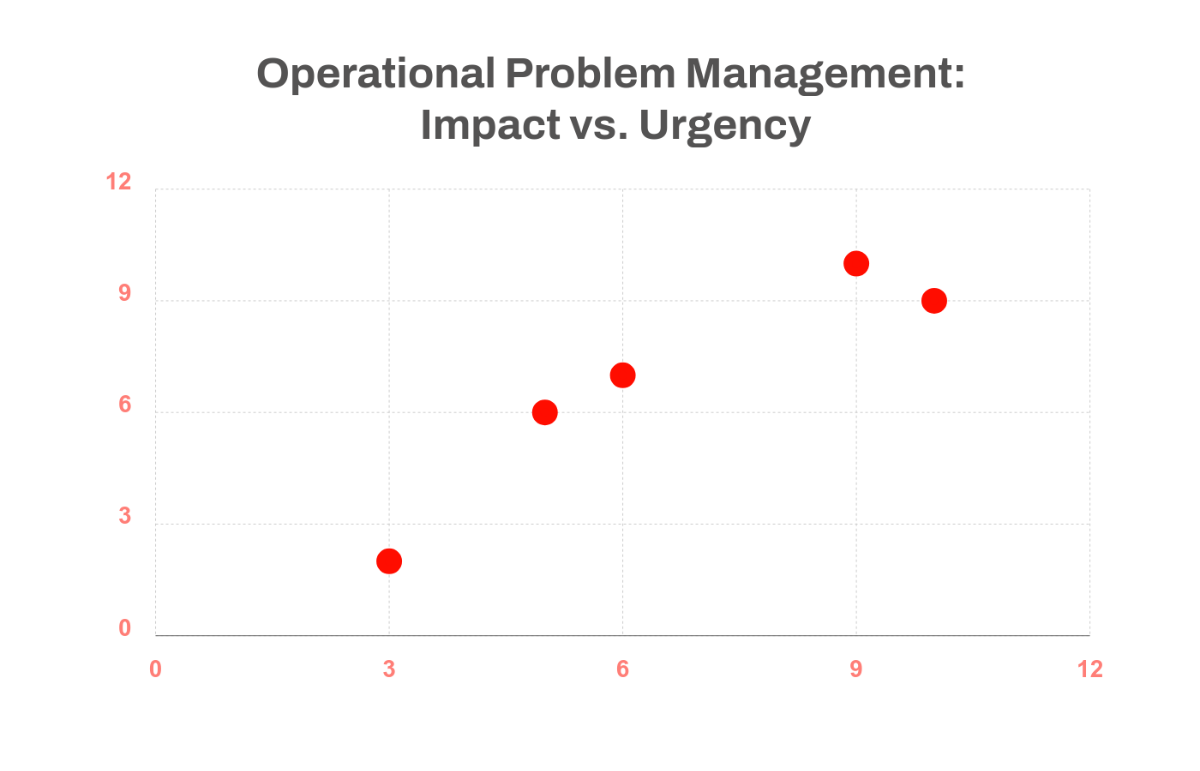
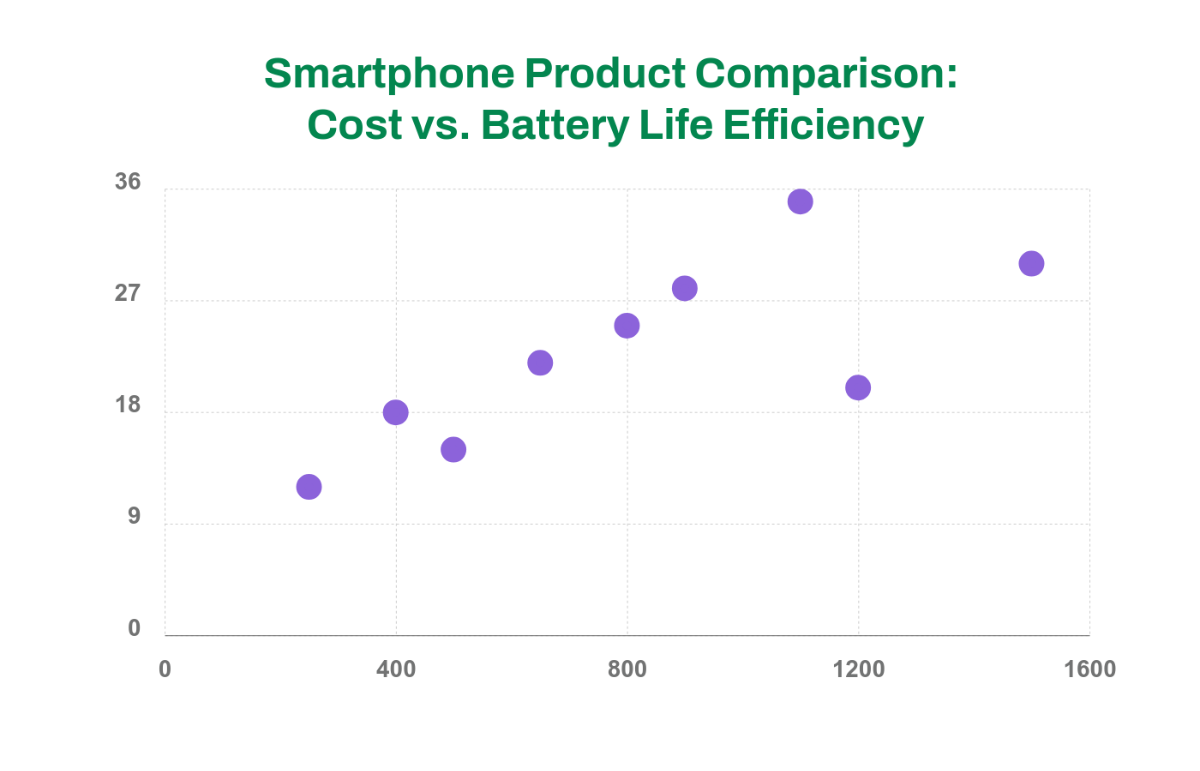
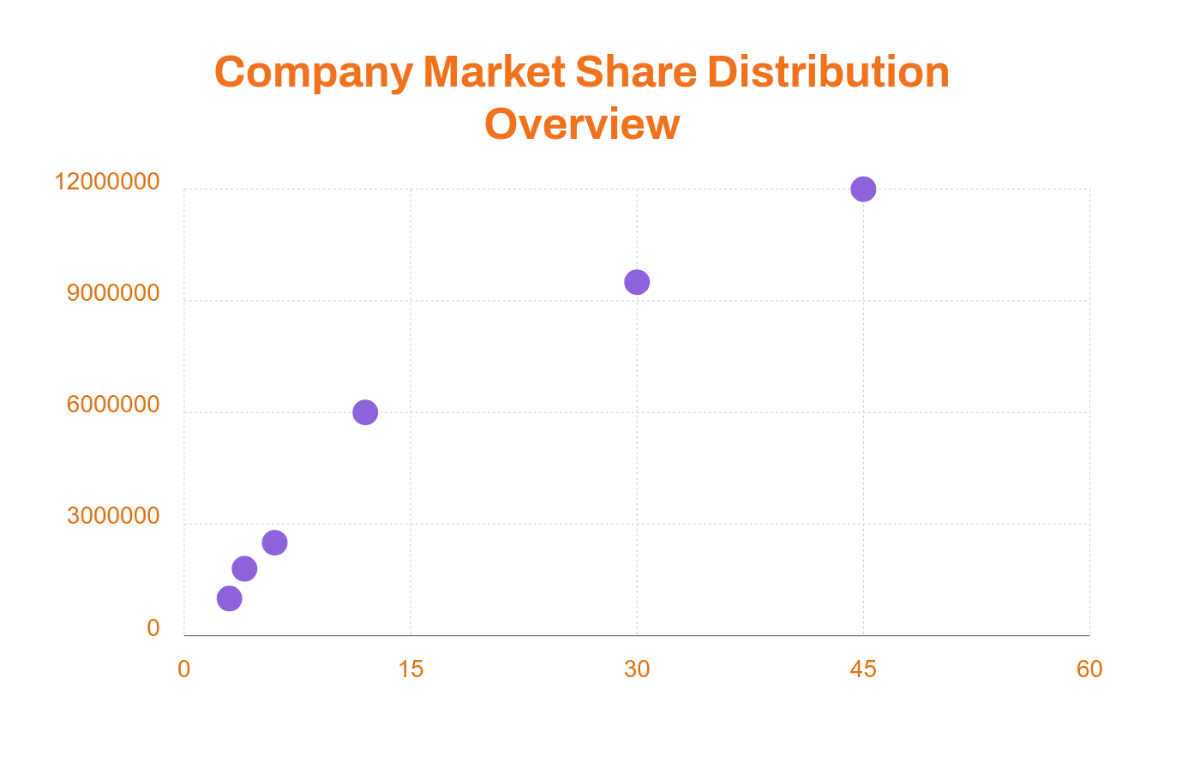
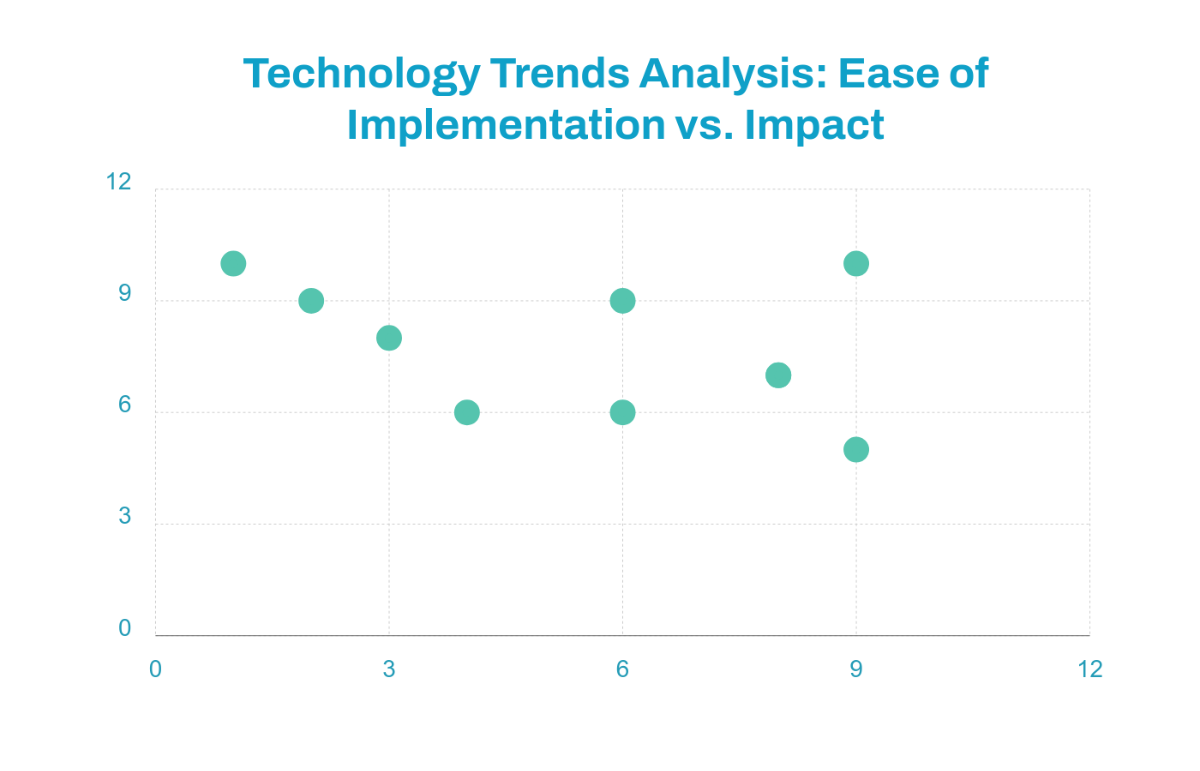
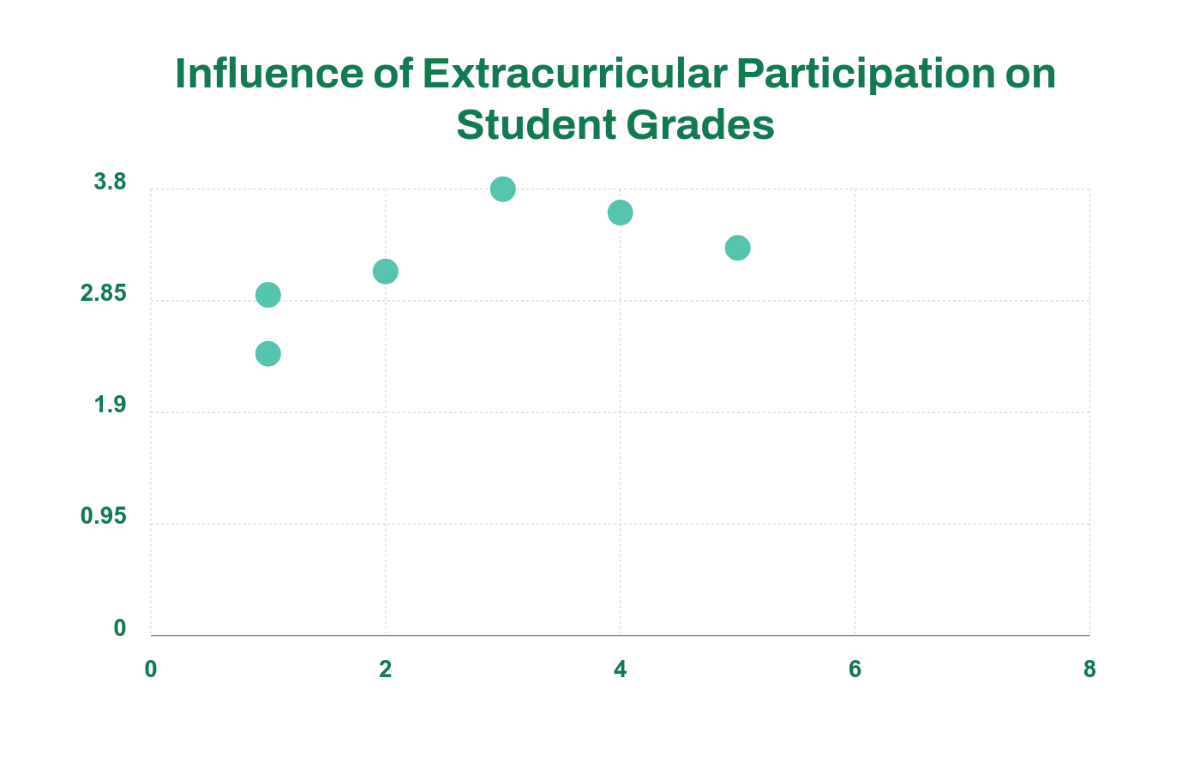
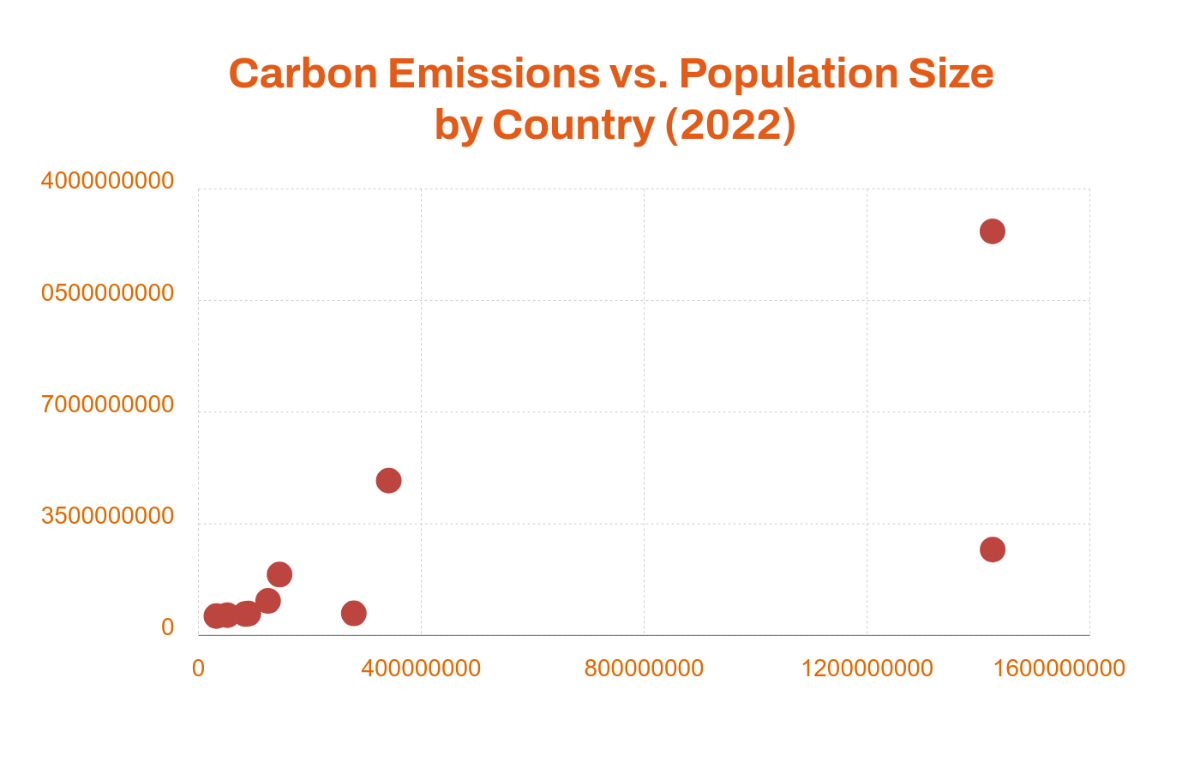
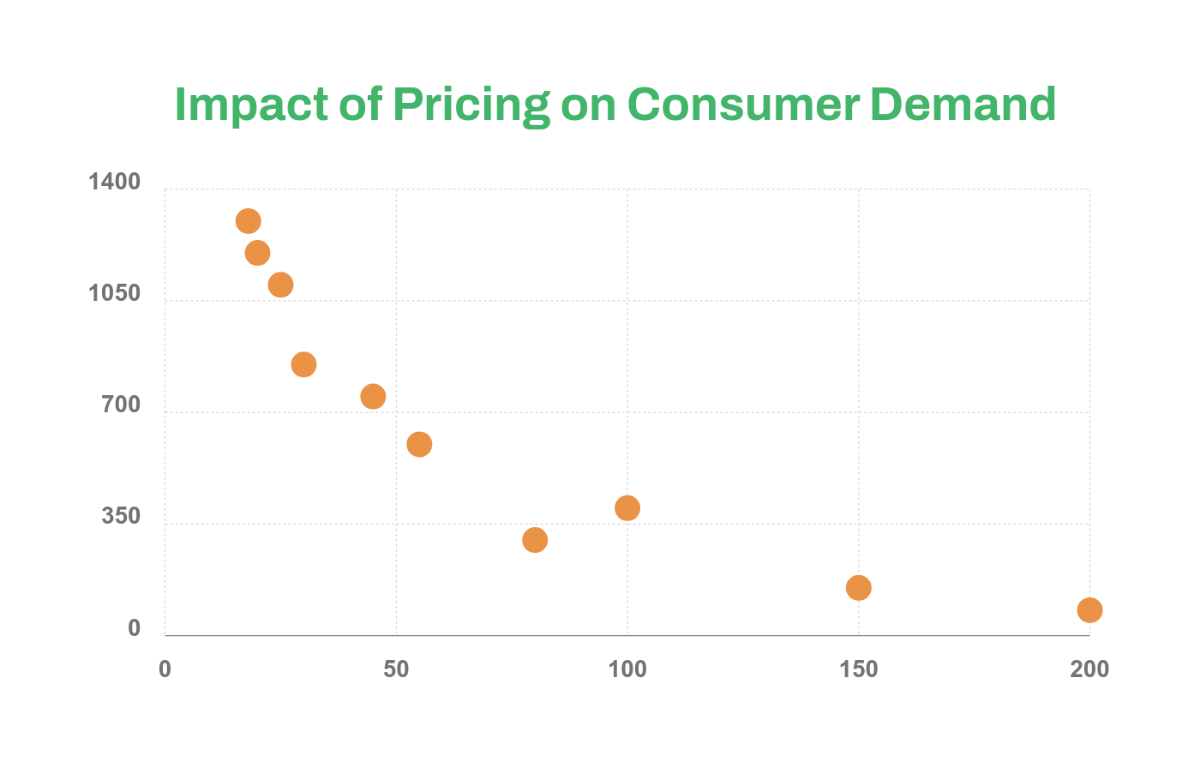
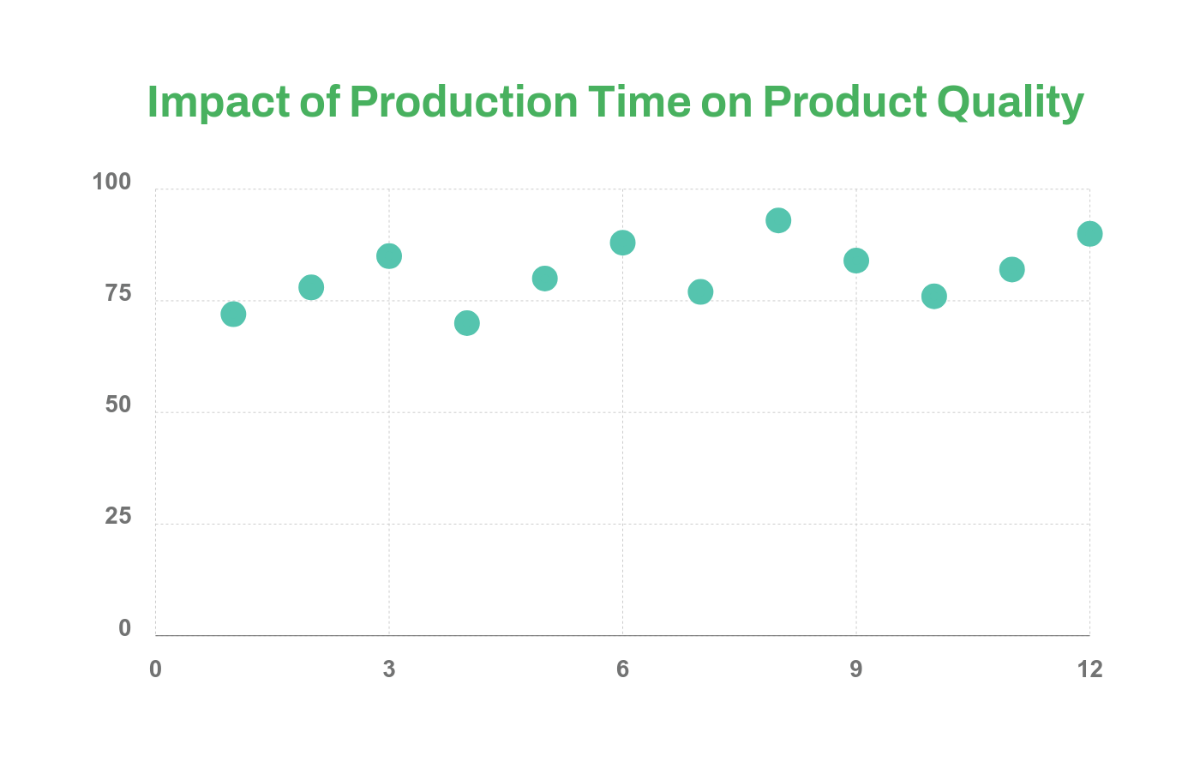
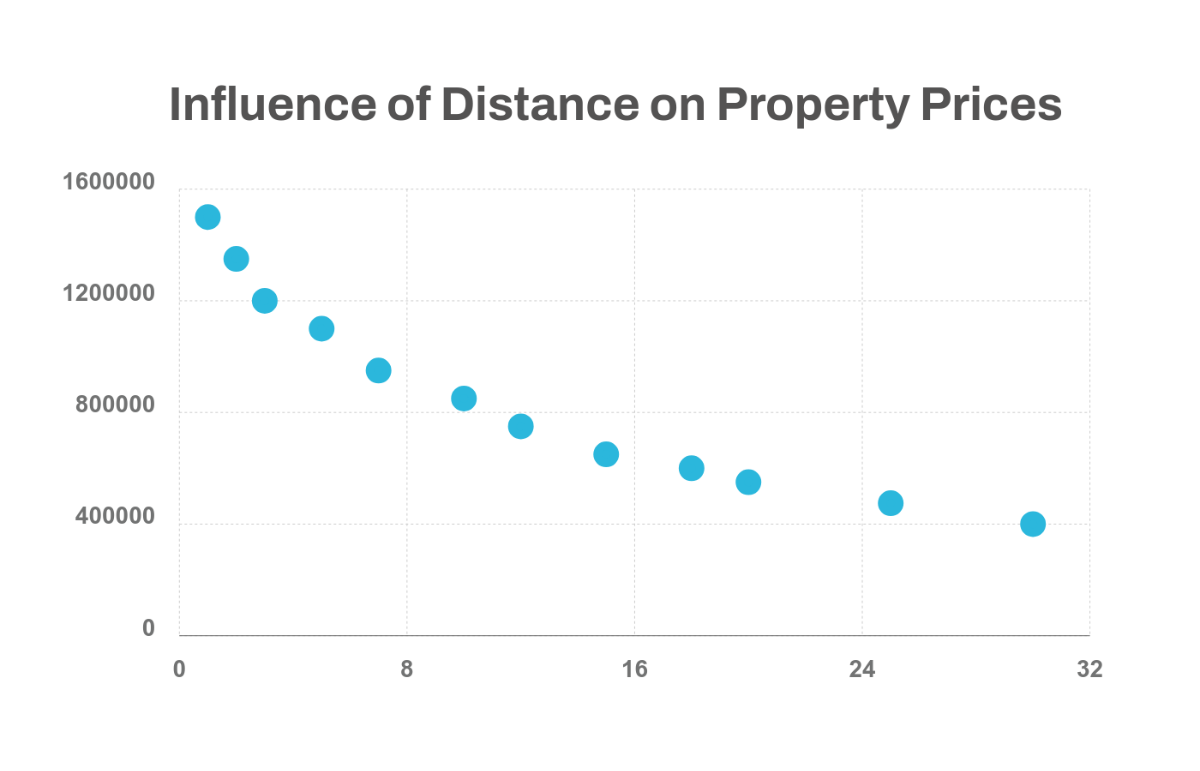
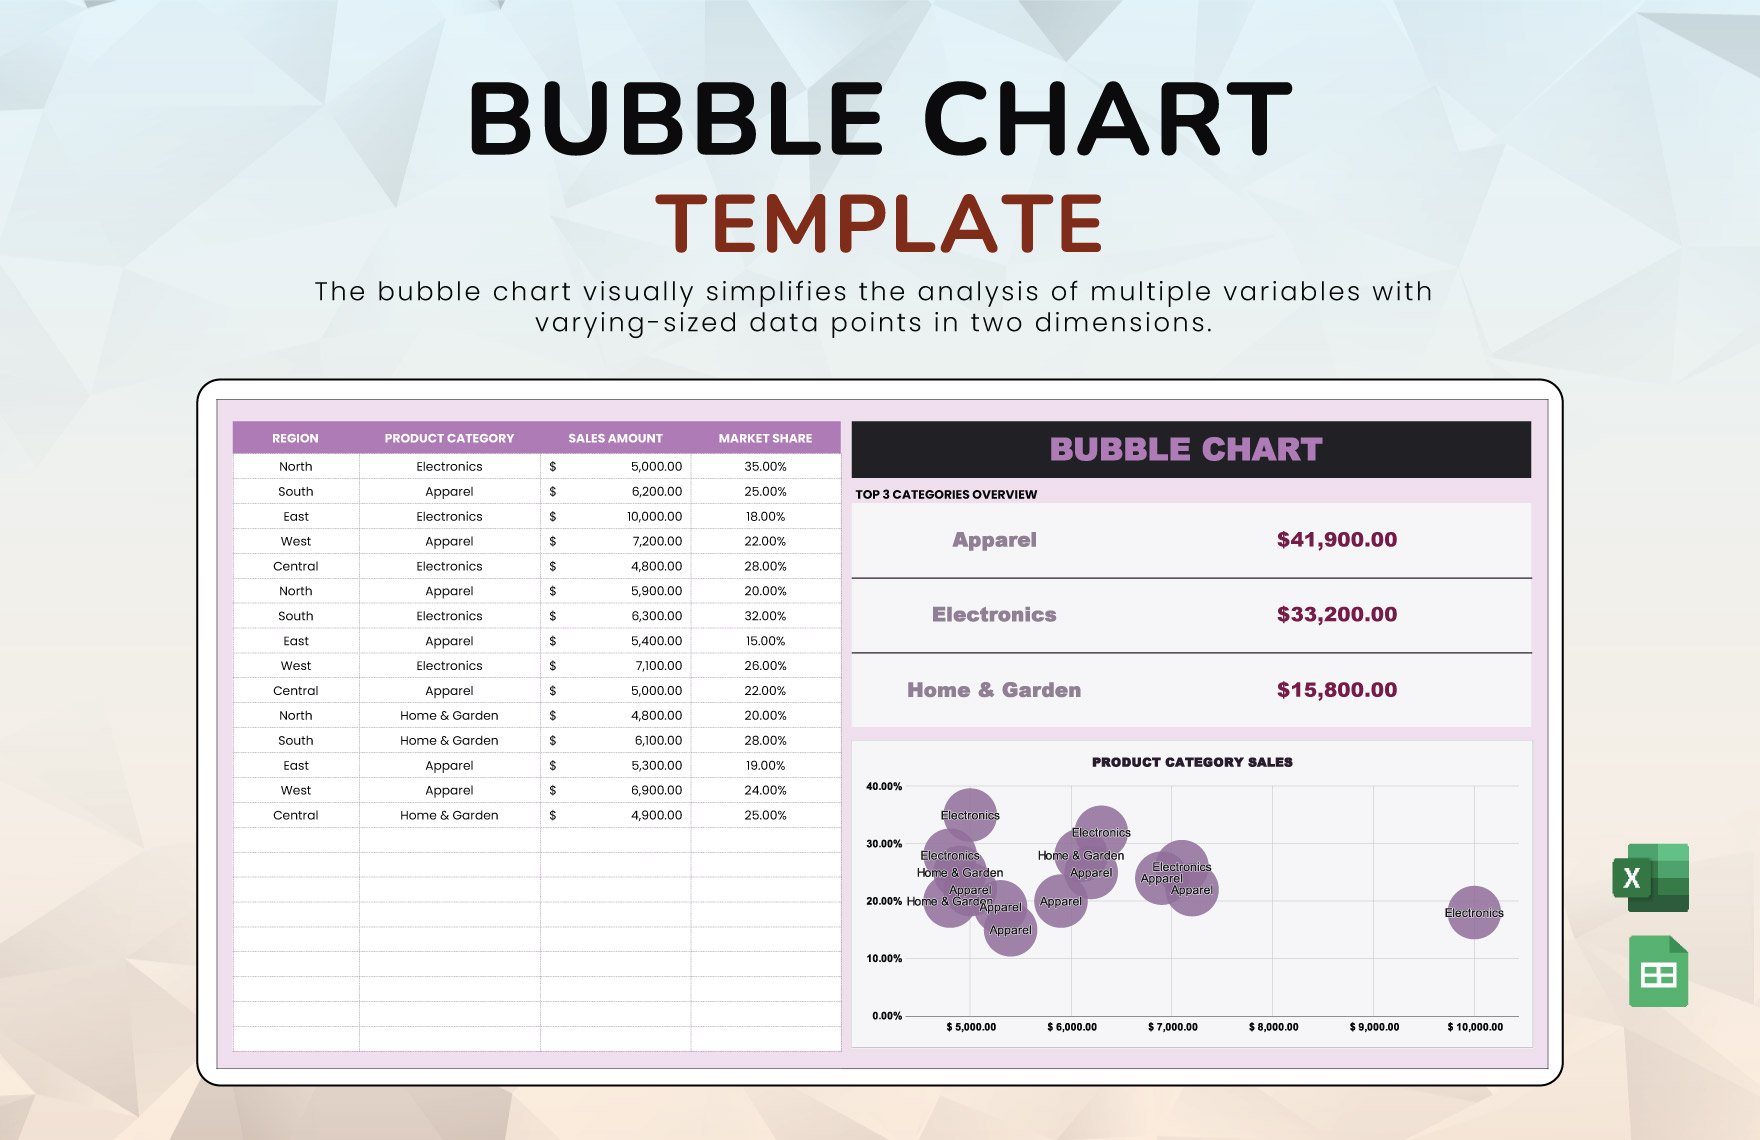
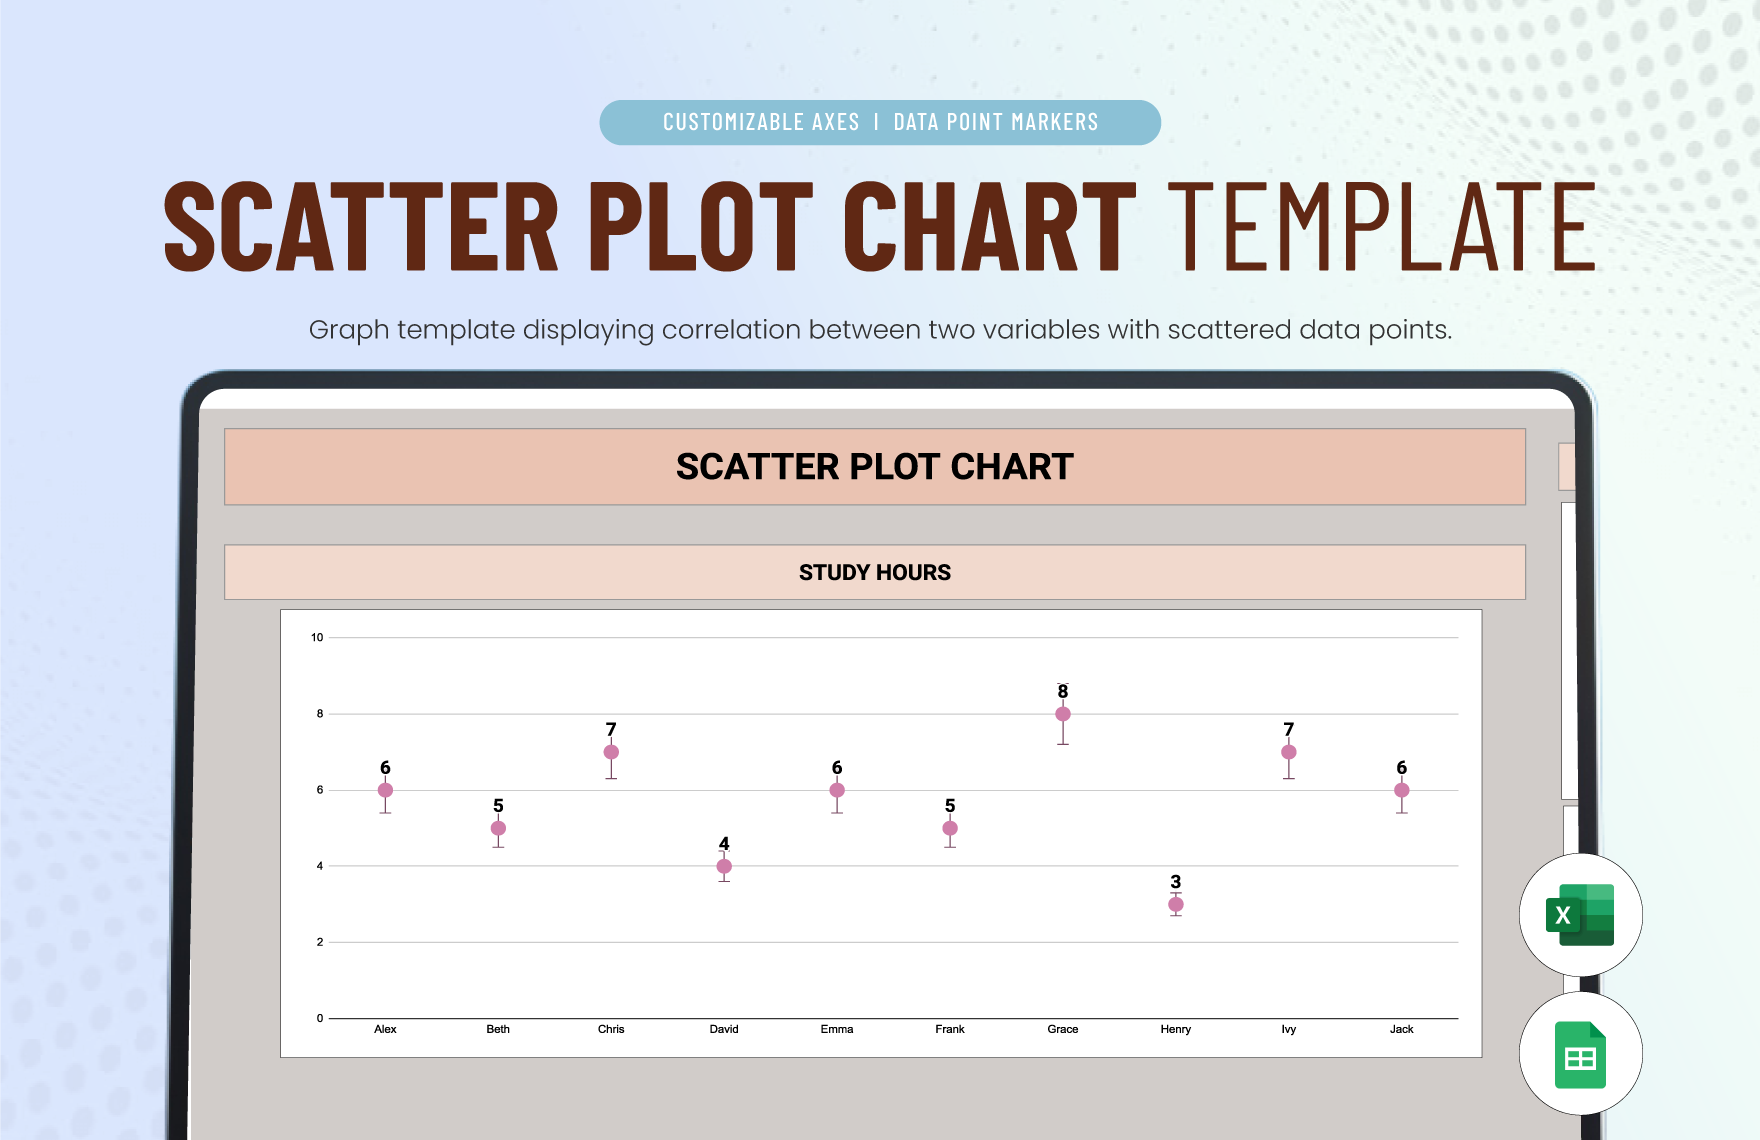
Keep your data-driven audiences engaged and elevate your presentations with the Scatter Graph Chart Templates from Template.net. Designed for business analysts, educators, and students, these templates enable you to clearly showcase trends and correlations in data with ease. Whether you need to promote a data-driven project or visualize research findings for a conference, our templates provide the professional finish you require. Each template includes fields for specifying time, date, and data set parameters, ensuring that your visualizations are both accurate and effective. Click here to Scatter Graph Chart Maker without any technical expertise required. Enjoy professional-grade design and customizable layouts suitable for both print and digital distribution.
Discover the many Scatter Graph Chart Templates we have on hand, each designed to suit different data visualization needs. Customize your choice by selecting a template, swapping in your data, and tweaking the colors and fonts to match your brand identity. Add advanced touches by dragging and dropping icons or graphics, using animated effects to highlight specific data points, and leveraging AI-powered text tools that assist without a steep learning curve. The possibilities are endless, inviting creativity and exploration with no prior design skills needed. Our regularly updated library ensures fresh and innovative designs are always available. When you're finished, download or share your chart via link, print, or export, and even publish directly to social media platforms, making it ideal for reaching audiences across multiple channels.
