Discover your Perfect Data Visualization with Donut Chart Templates from Template.net
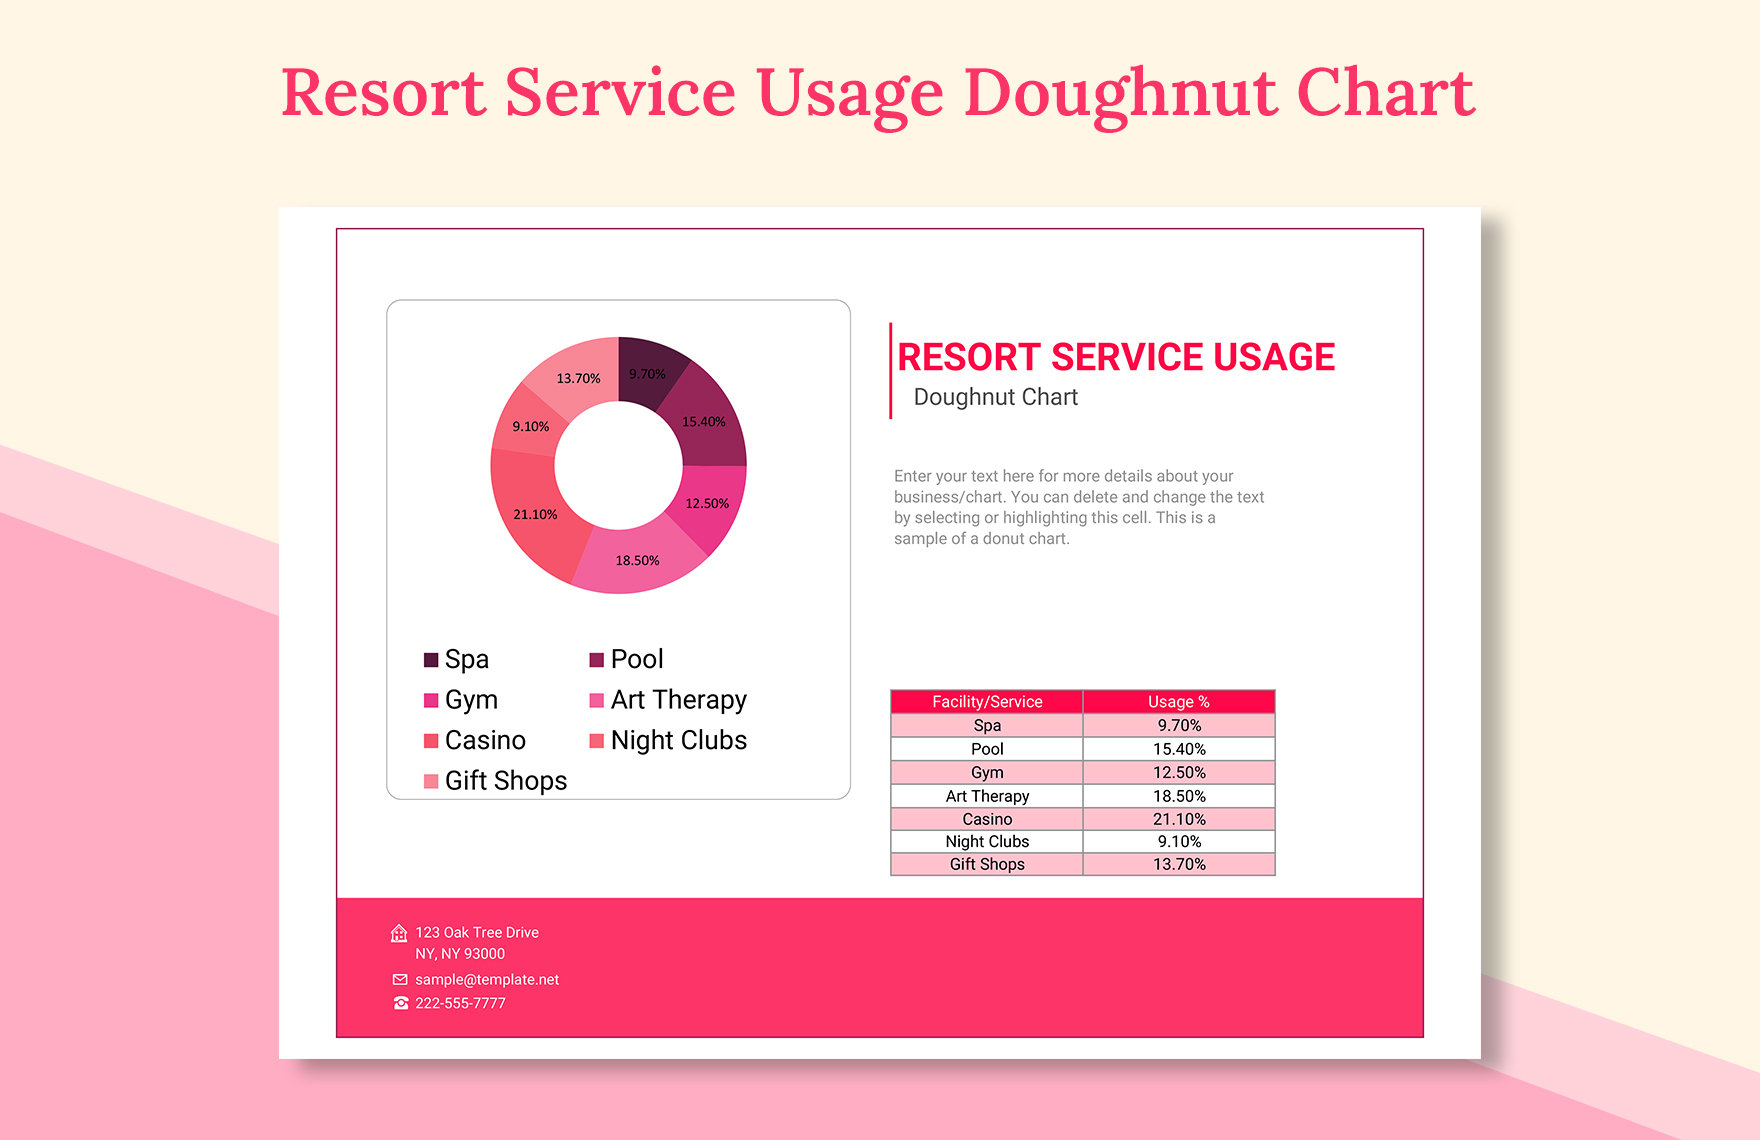
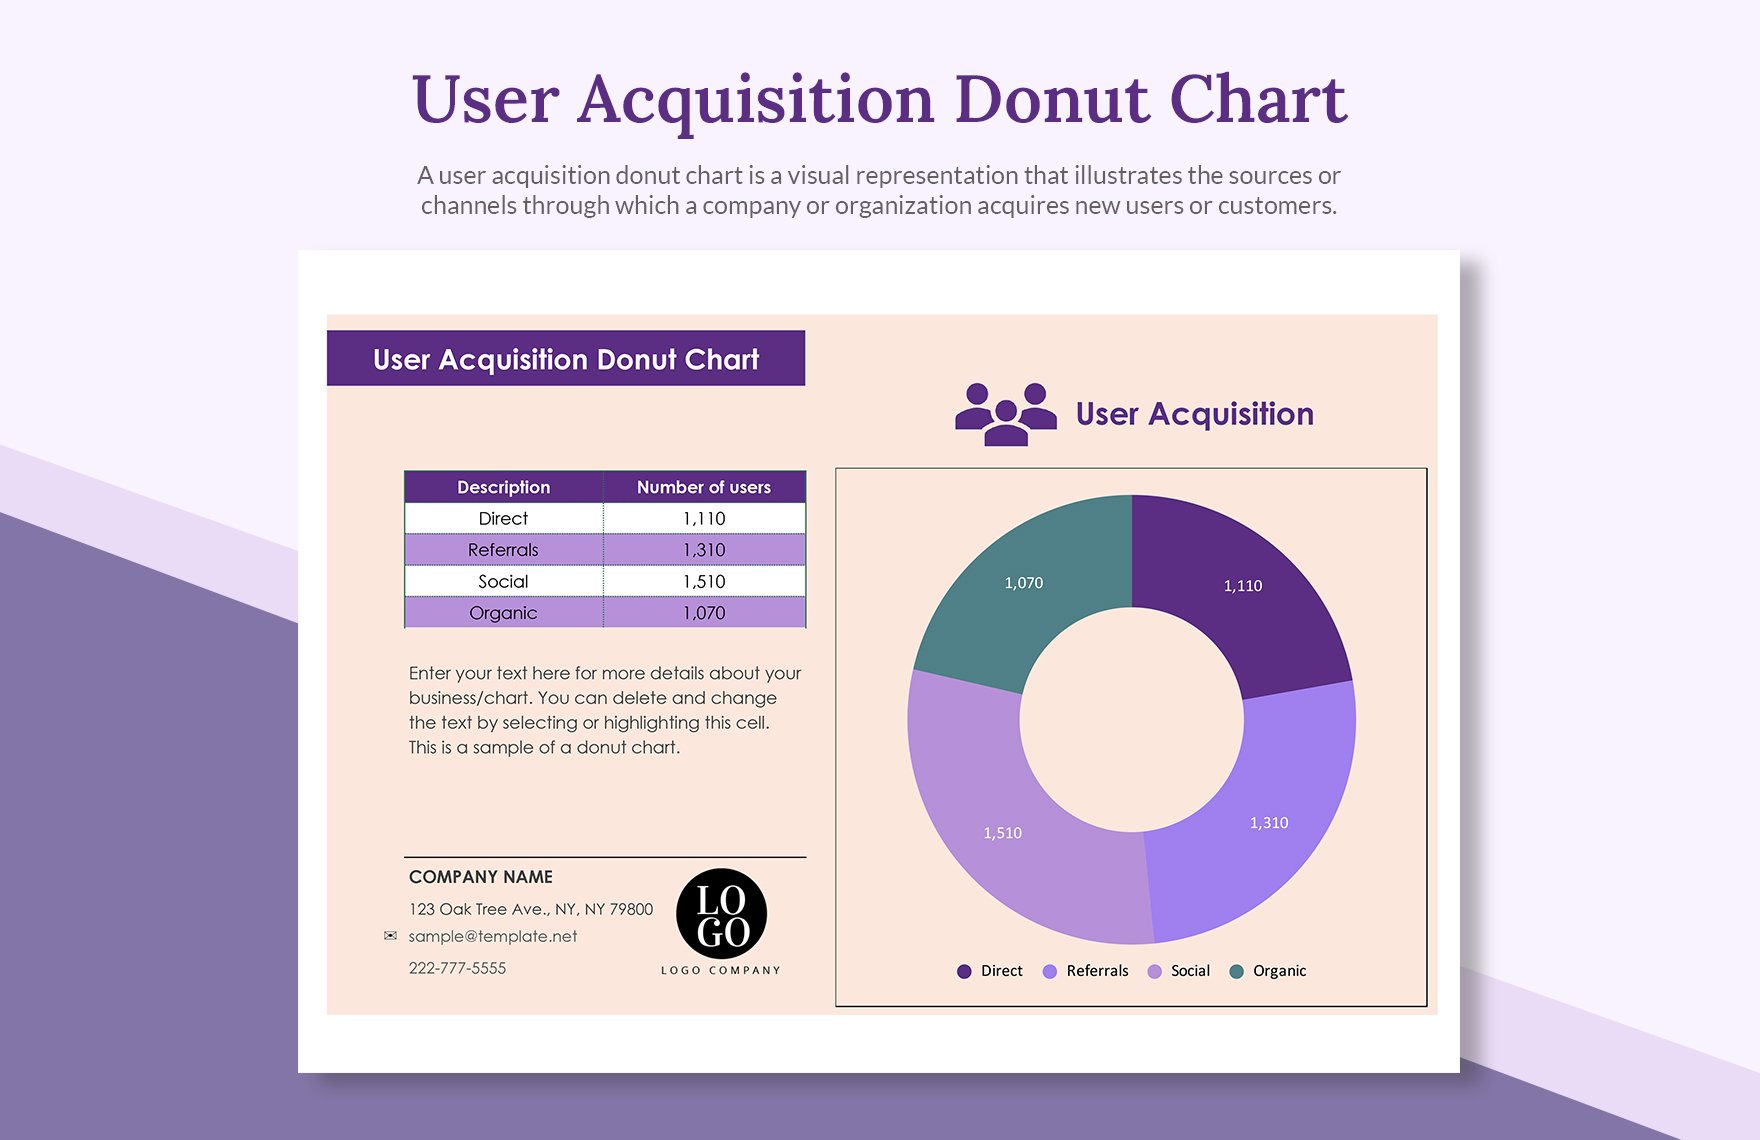
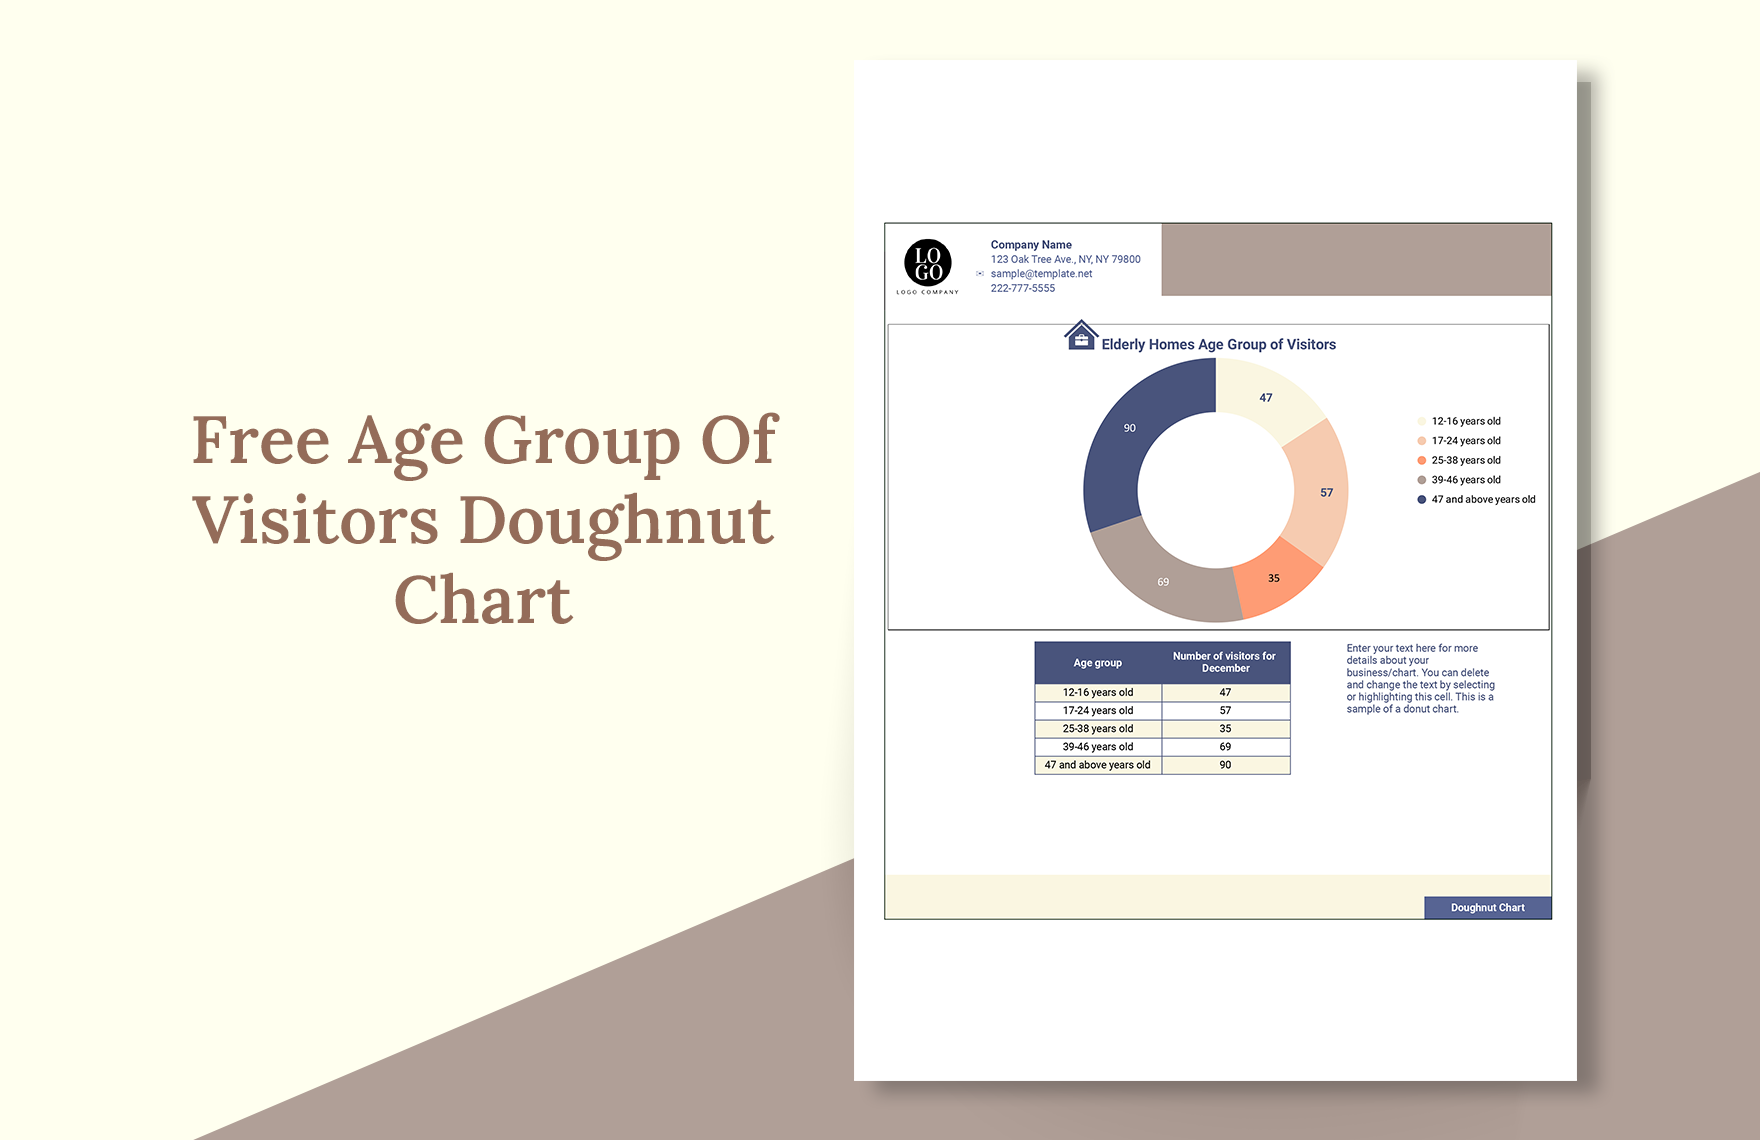
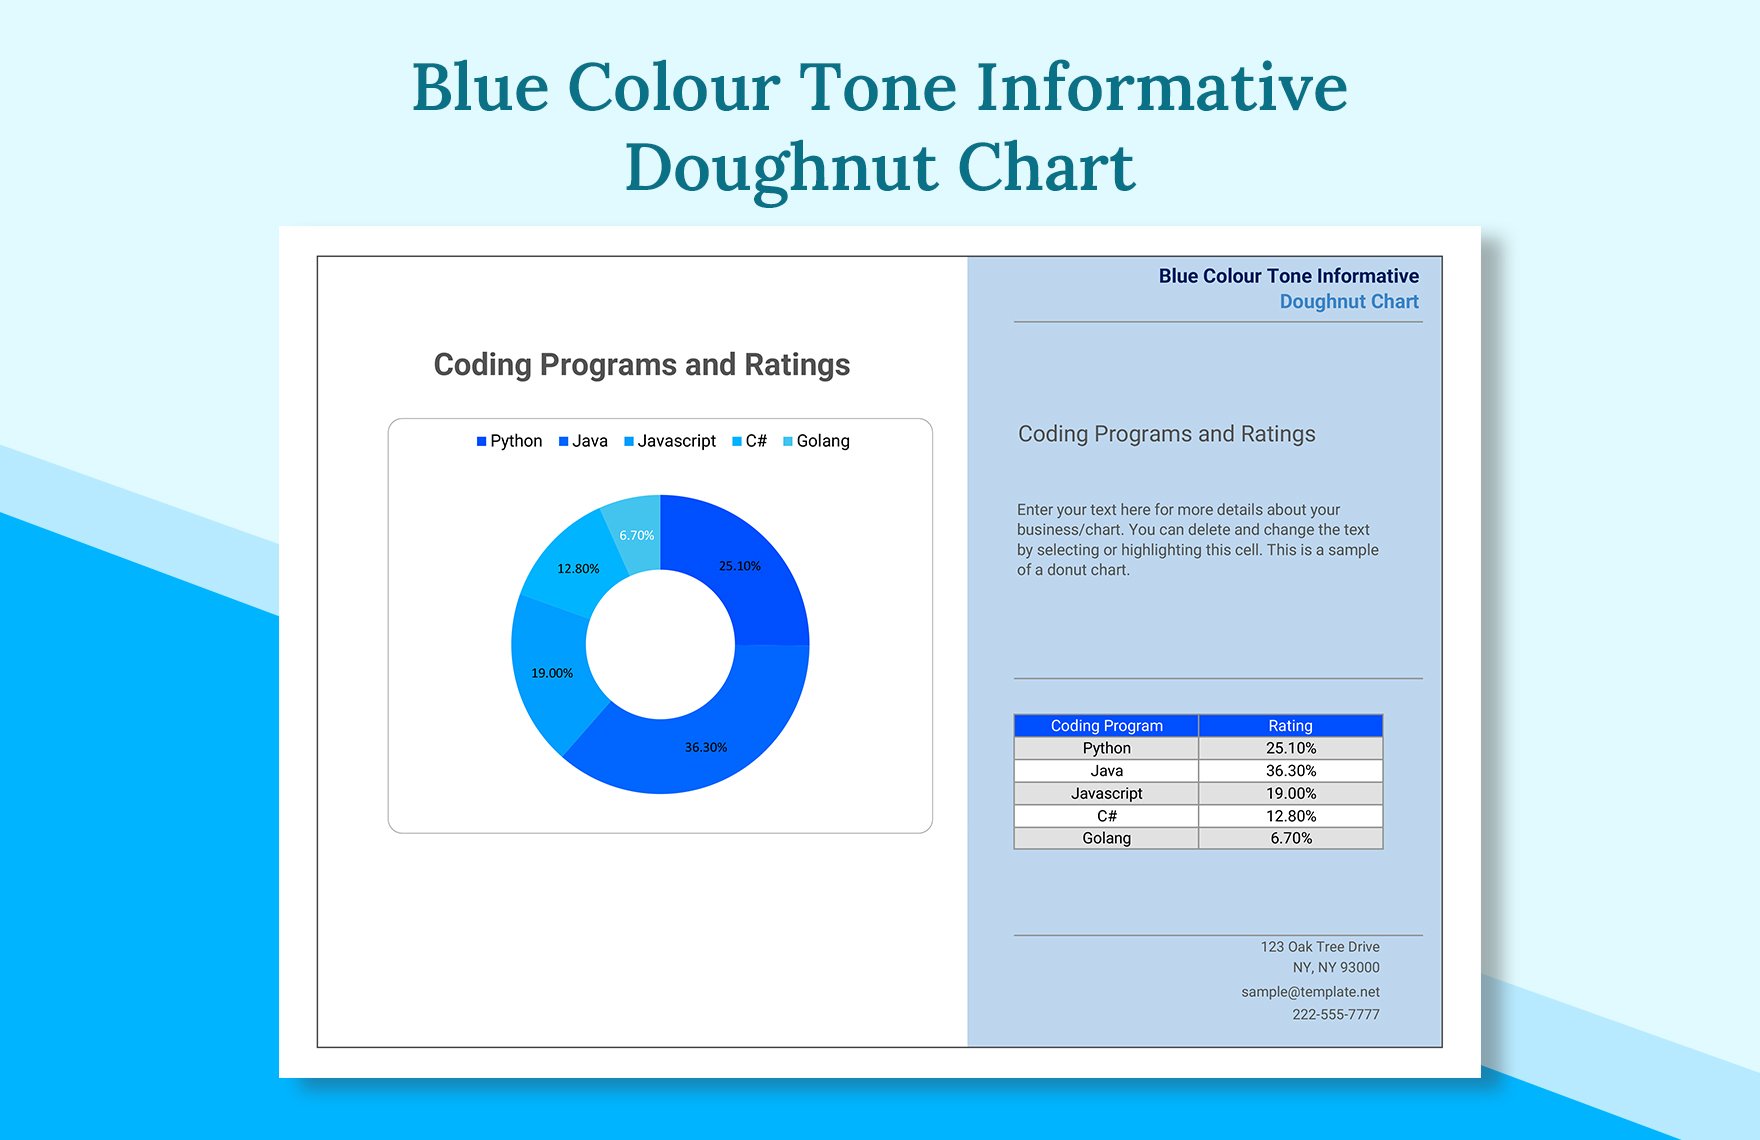
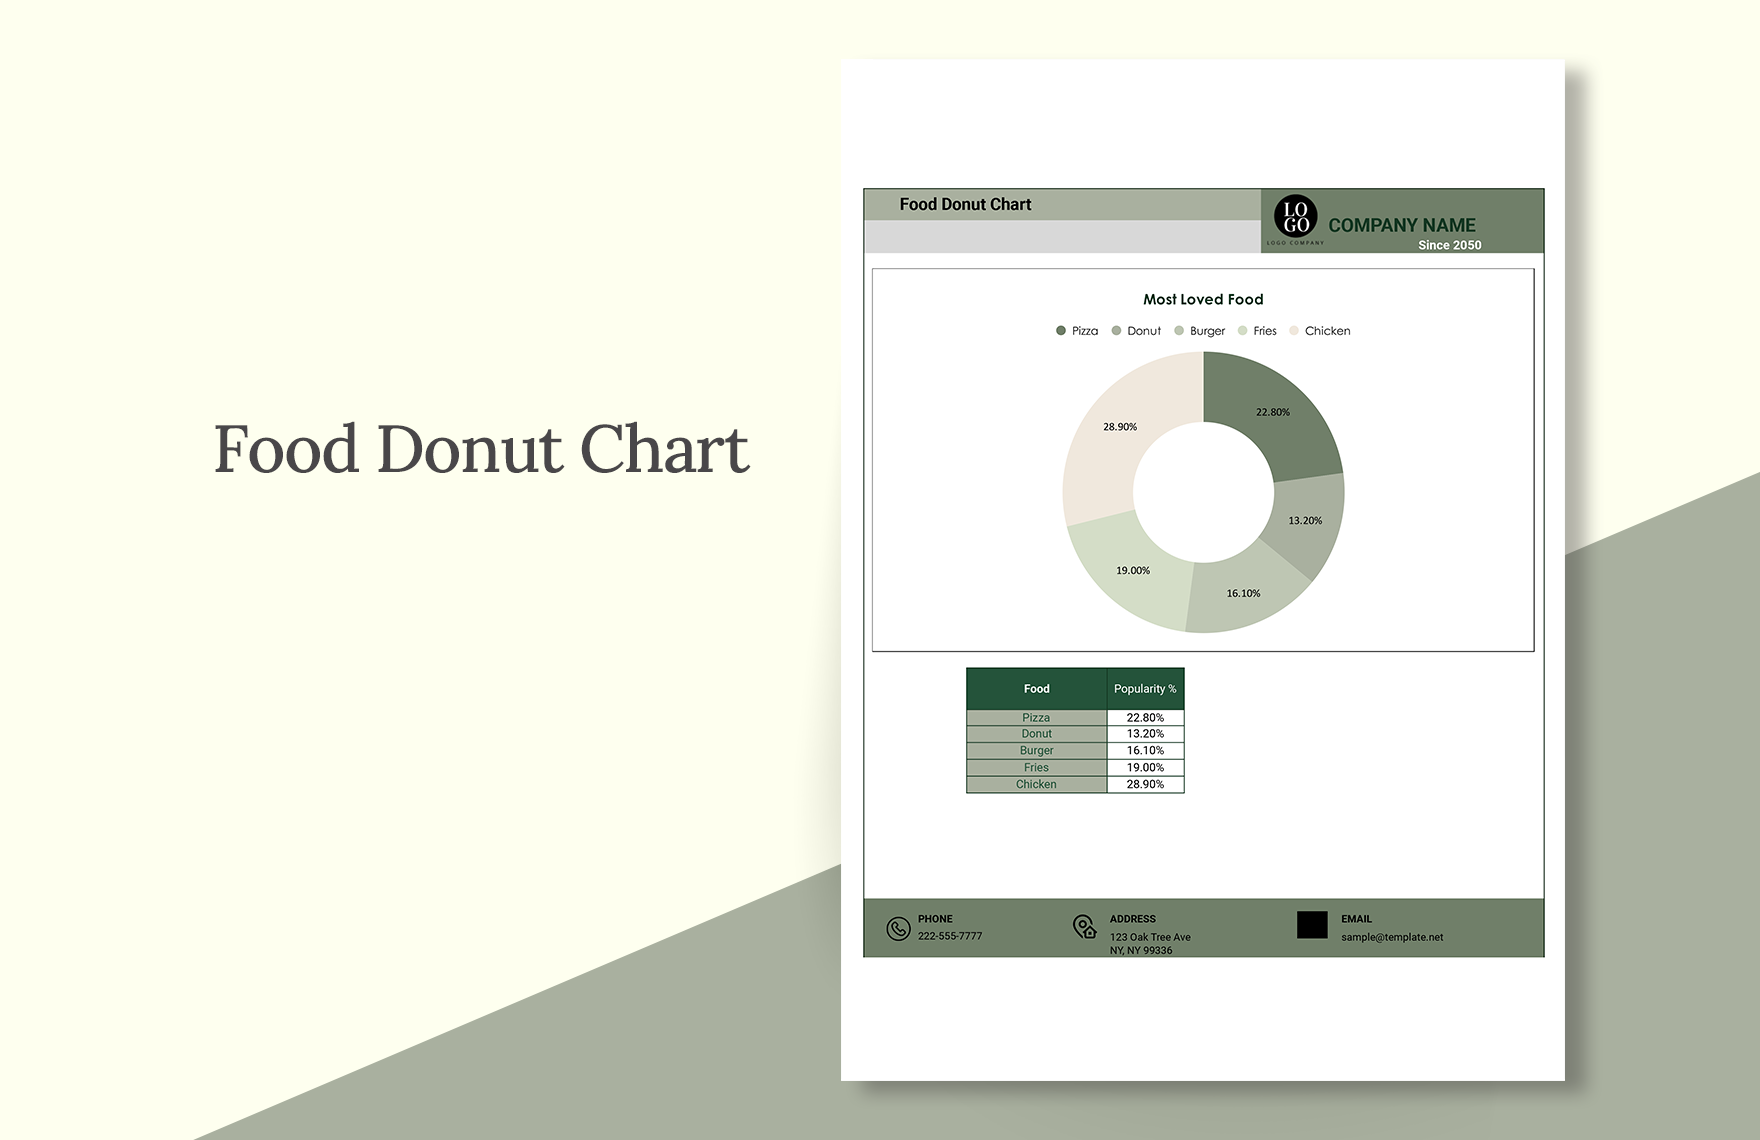
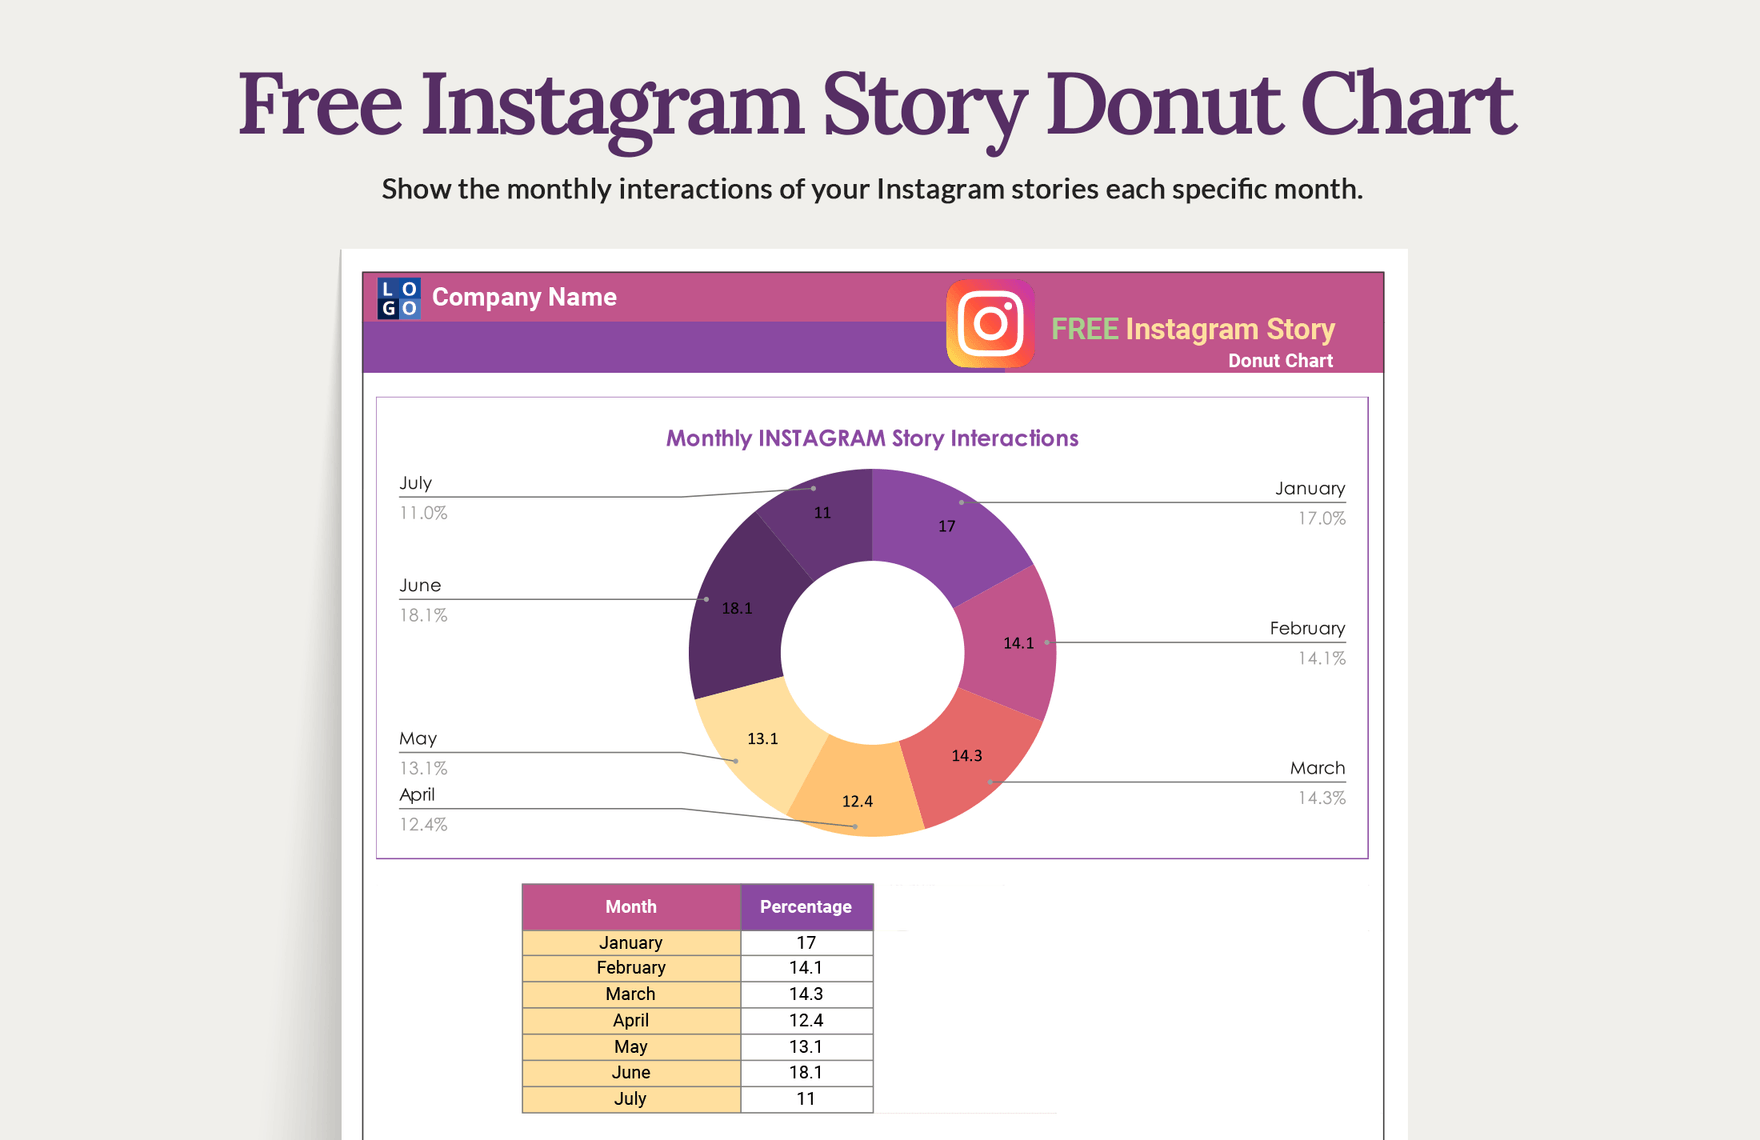
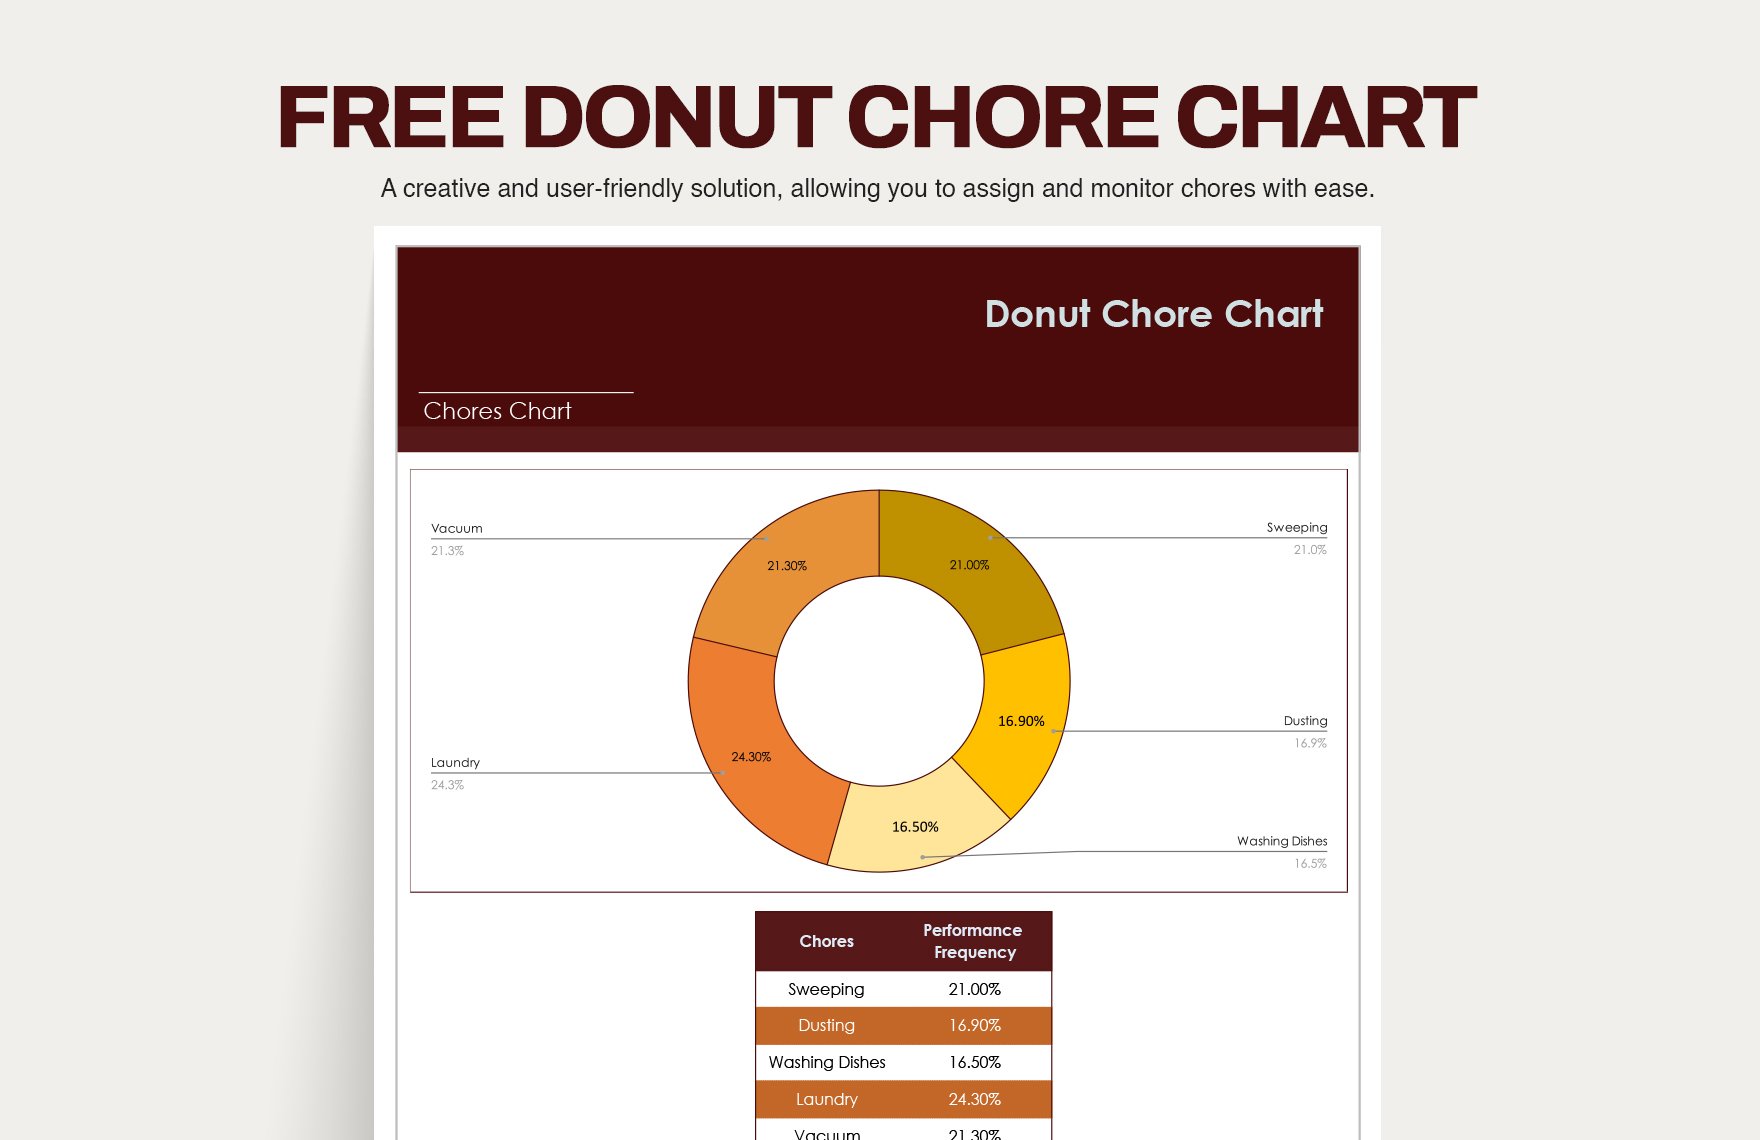
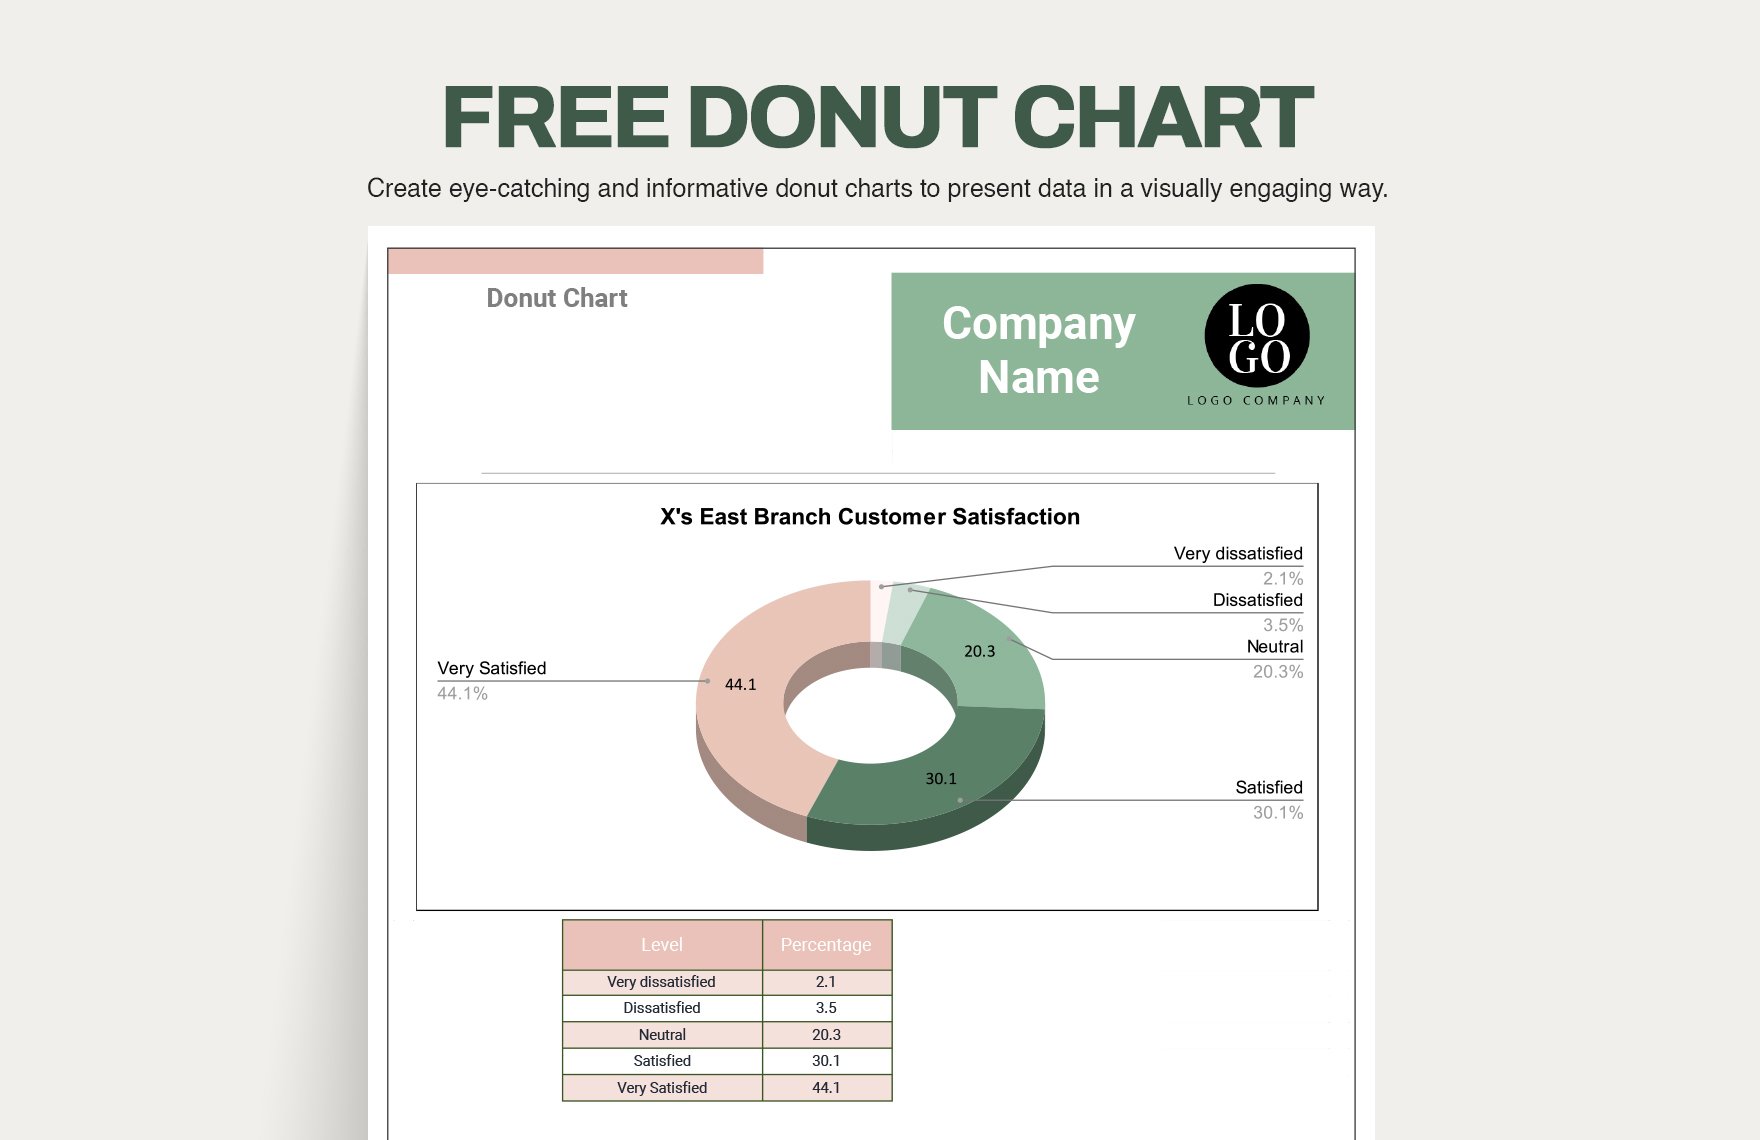
Bring your data storytelling to life with Donut Chart Templates from Template.net. Designed for analysts, marketers, and business professionals, these templates help you keep your audience engaged, present insights clearly, and simplify complex data into visually appealing graphics. Whether you’re promoting a quarterly report or visualizing customer demographics for a presentation, these templates make it easy to convey meaningful information. Each template includes customizable sections for data points, labels, and even color schemes to fit your branding. Best of all, no graphic design skills are required to create professional-grade charts, saving you time and effort. With digital and print-ready formats, you can seamlessly share your visuals across multiple platforms or include them in your marketing materials.
Discover the many chart templates we have on hand with Template.net's extensive collection of Donut Chart Templates. Choose from a wide range of templates to suit any data presentation need, swap in your data, and easily adjust colors and fonts to reflect your brand identity. Elevate your charts by dragging and dropping icons or graphics, incorporating animated effects, and employing AI-powered text tools for insightful descriptions. With endless possibilities, creating the perfect chart is both fun and skill-free. Explore regularly updated templates to keep your charts fresh and current. When you’re finished, download or share your completed masterpiece via link, print, or export to suit your specific needs—ideal for multiple channels and real-time collaboration.
