Bring Your Data Visualizations to Life with Column Chart Templates from Template.net
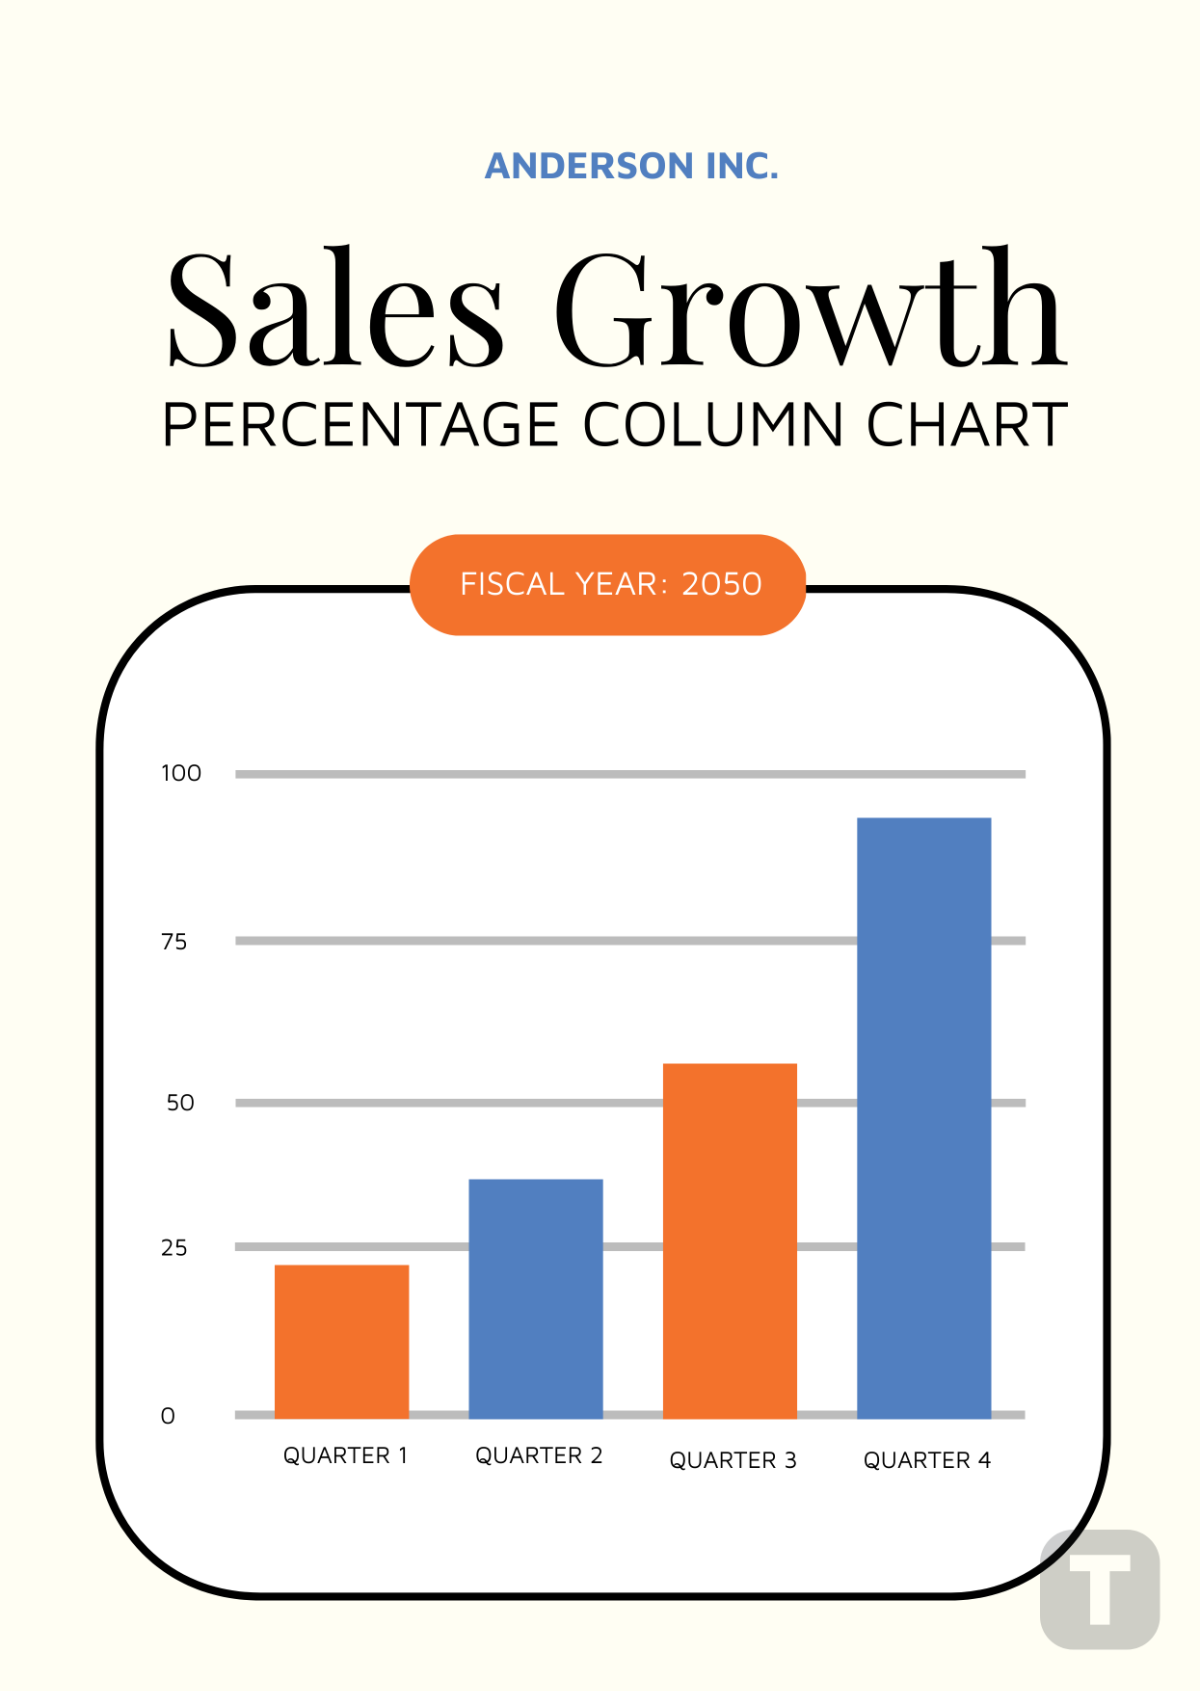
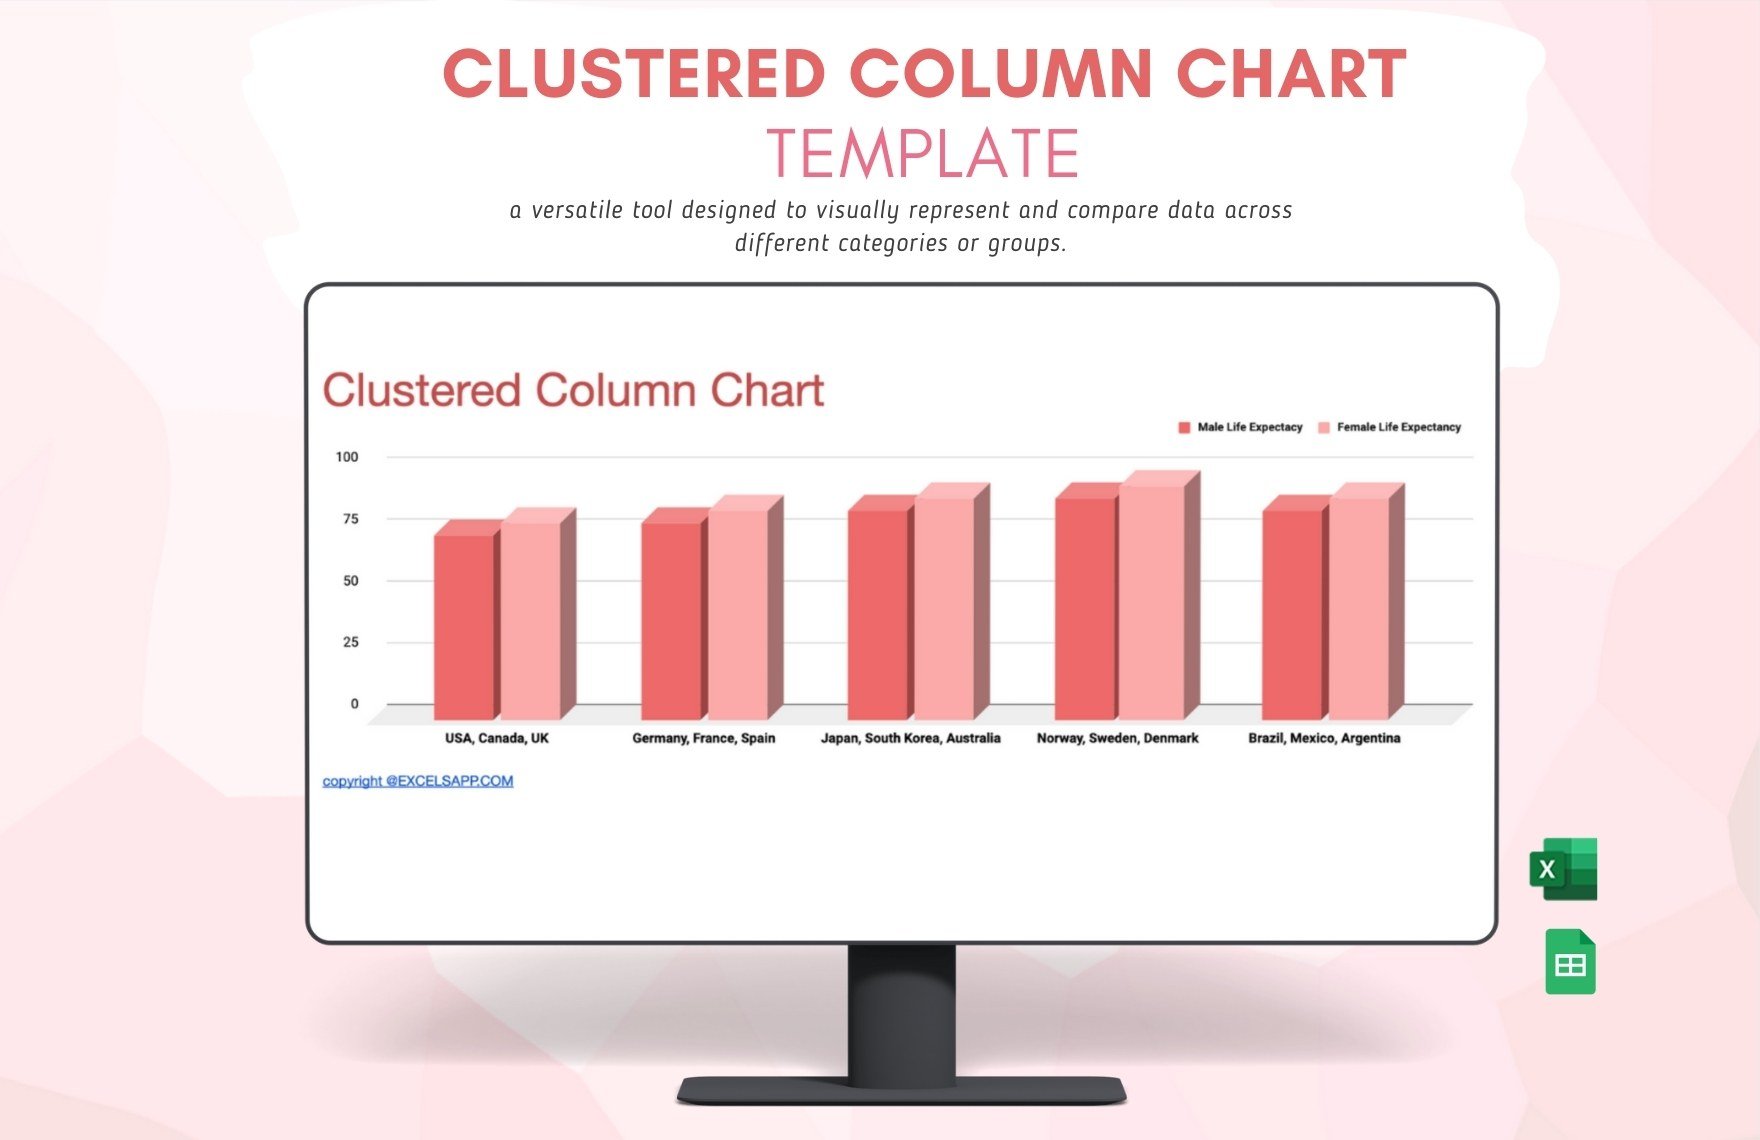
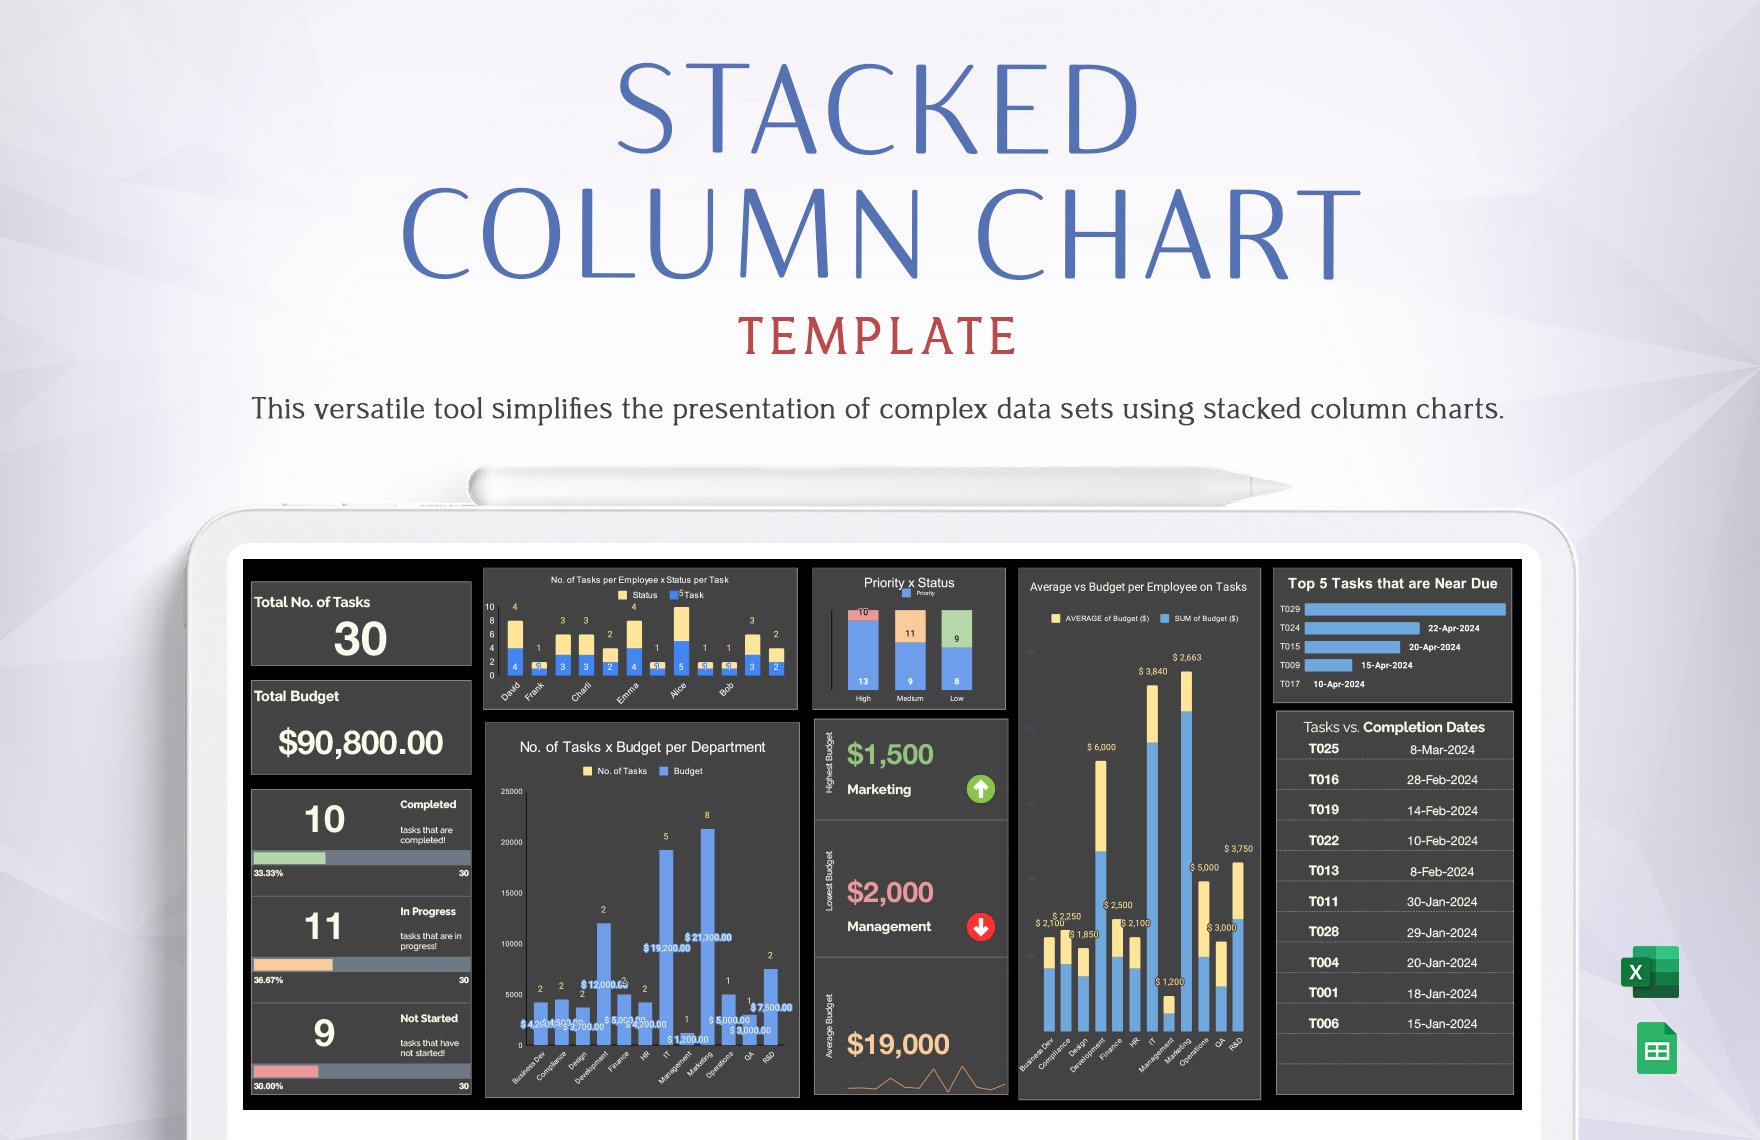
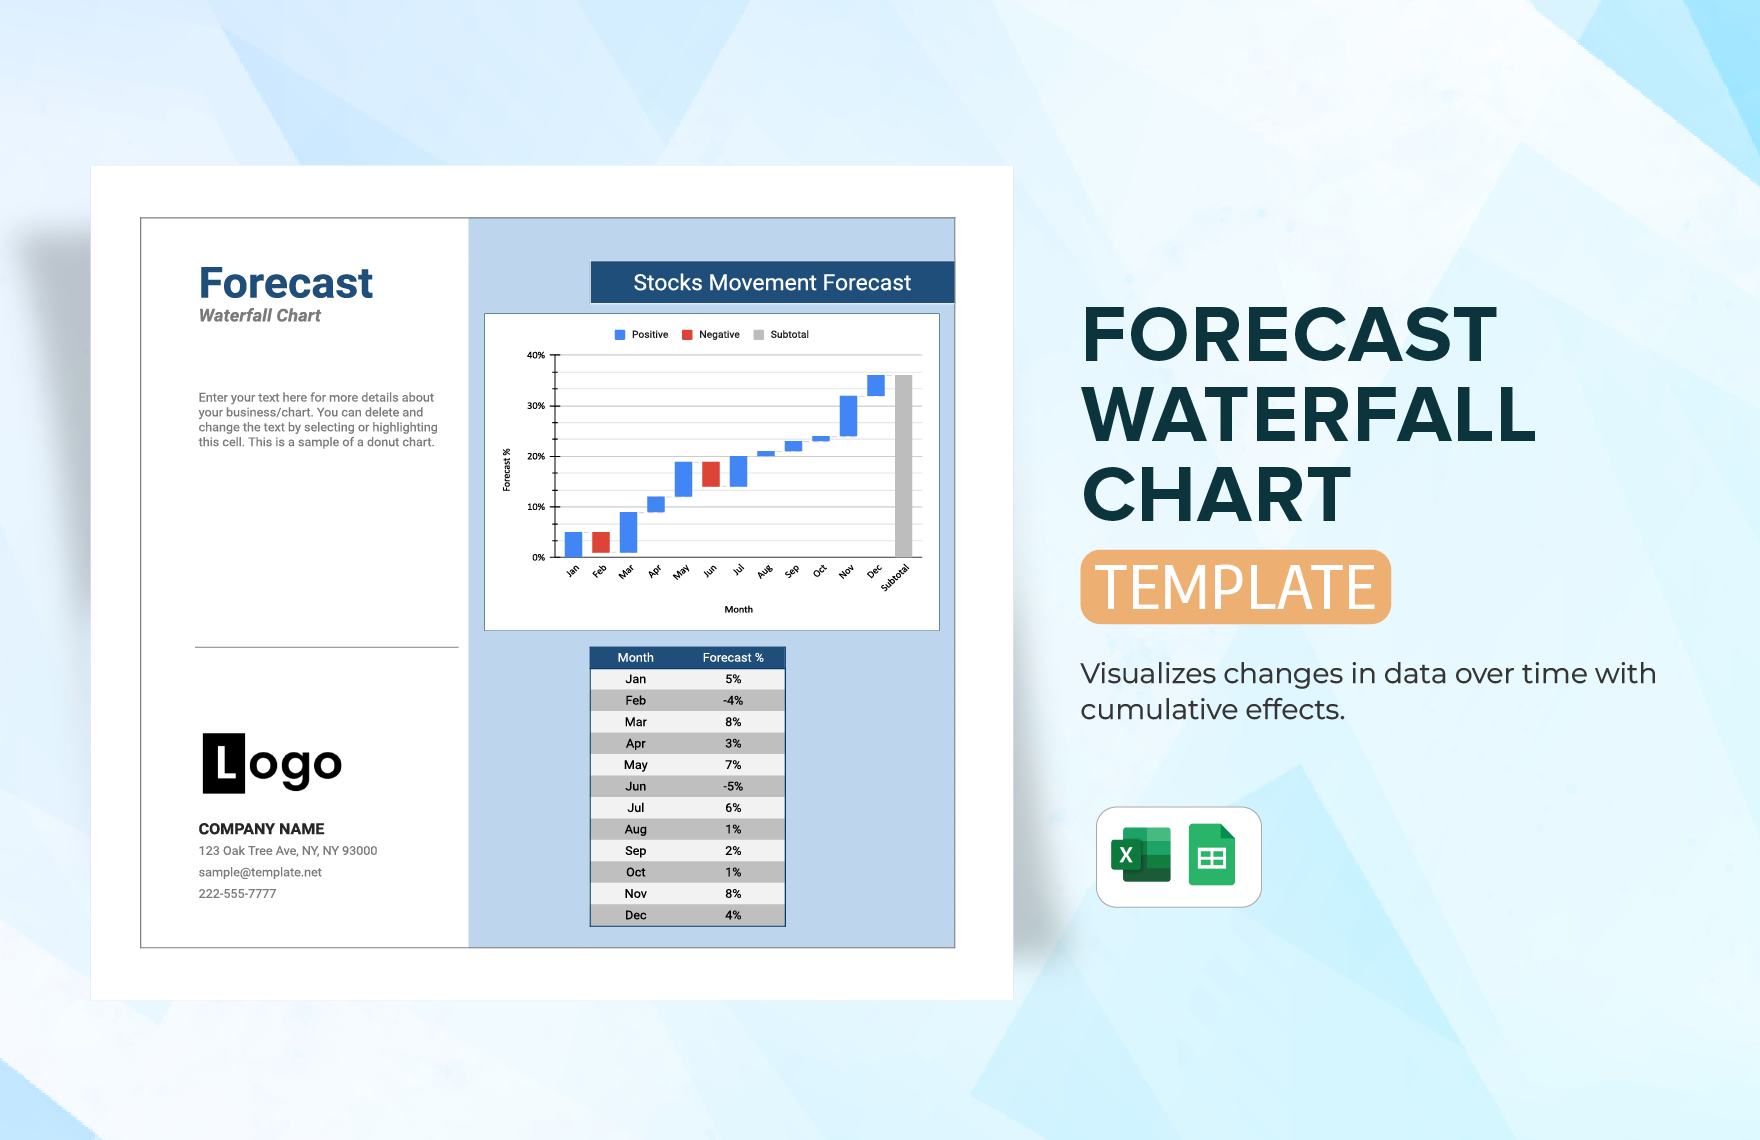
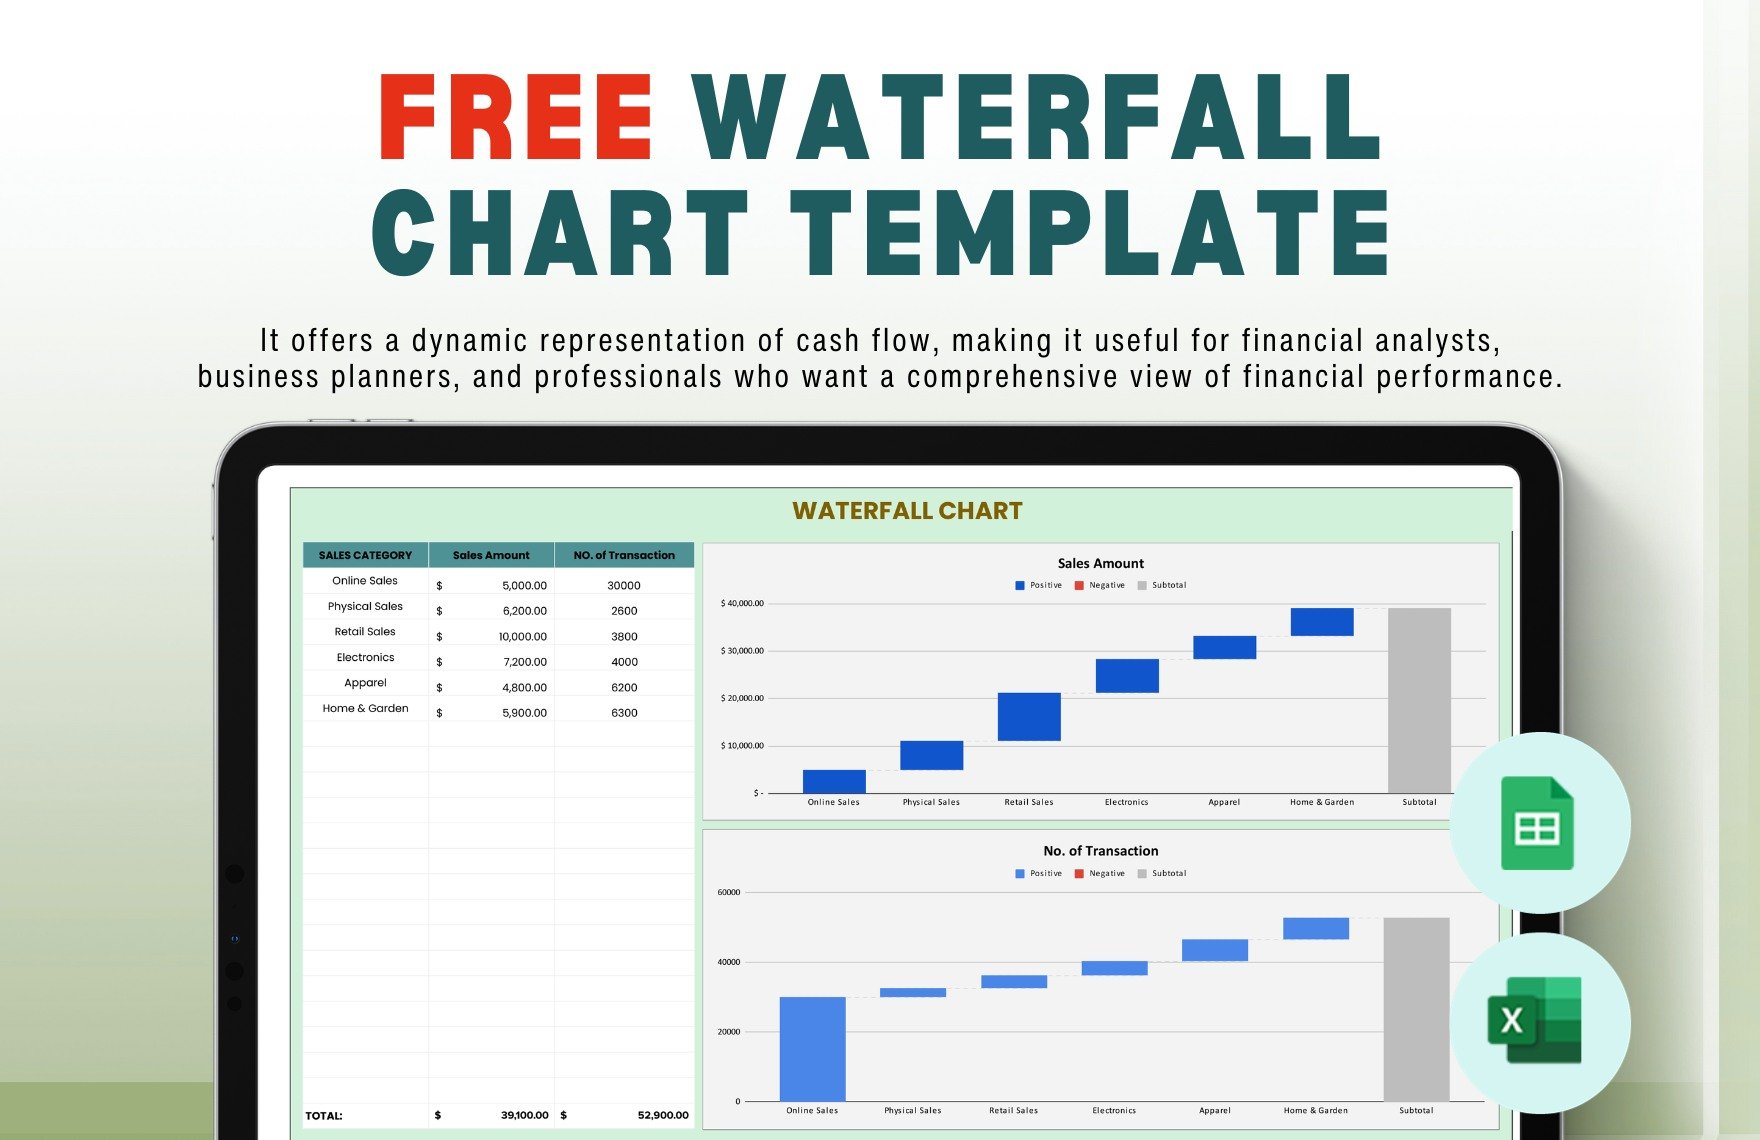
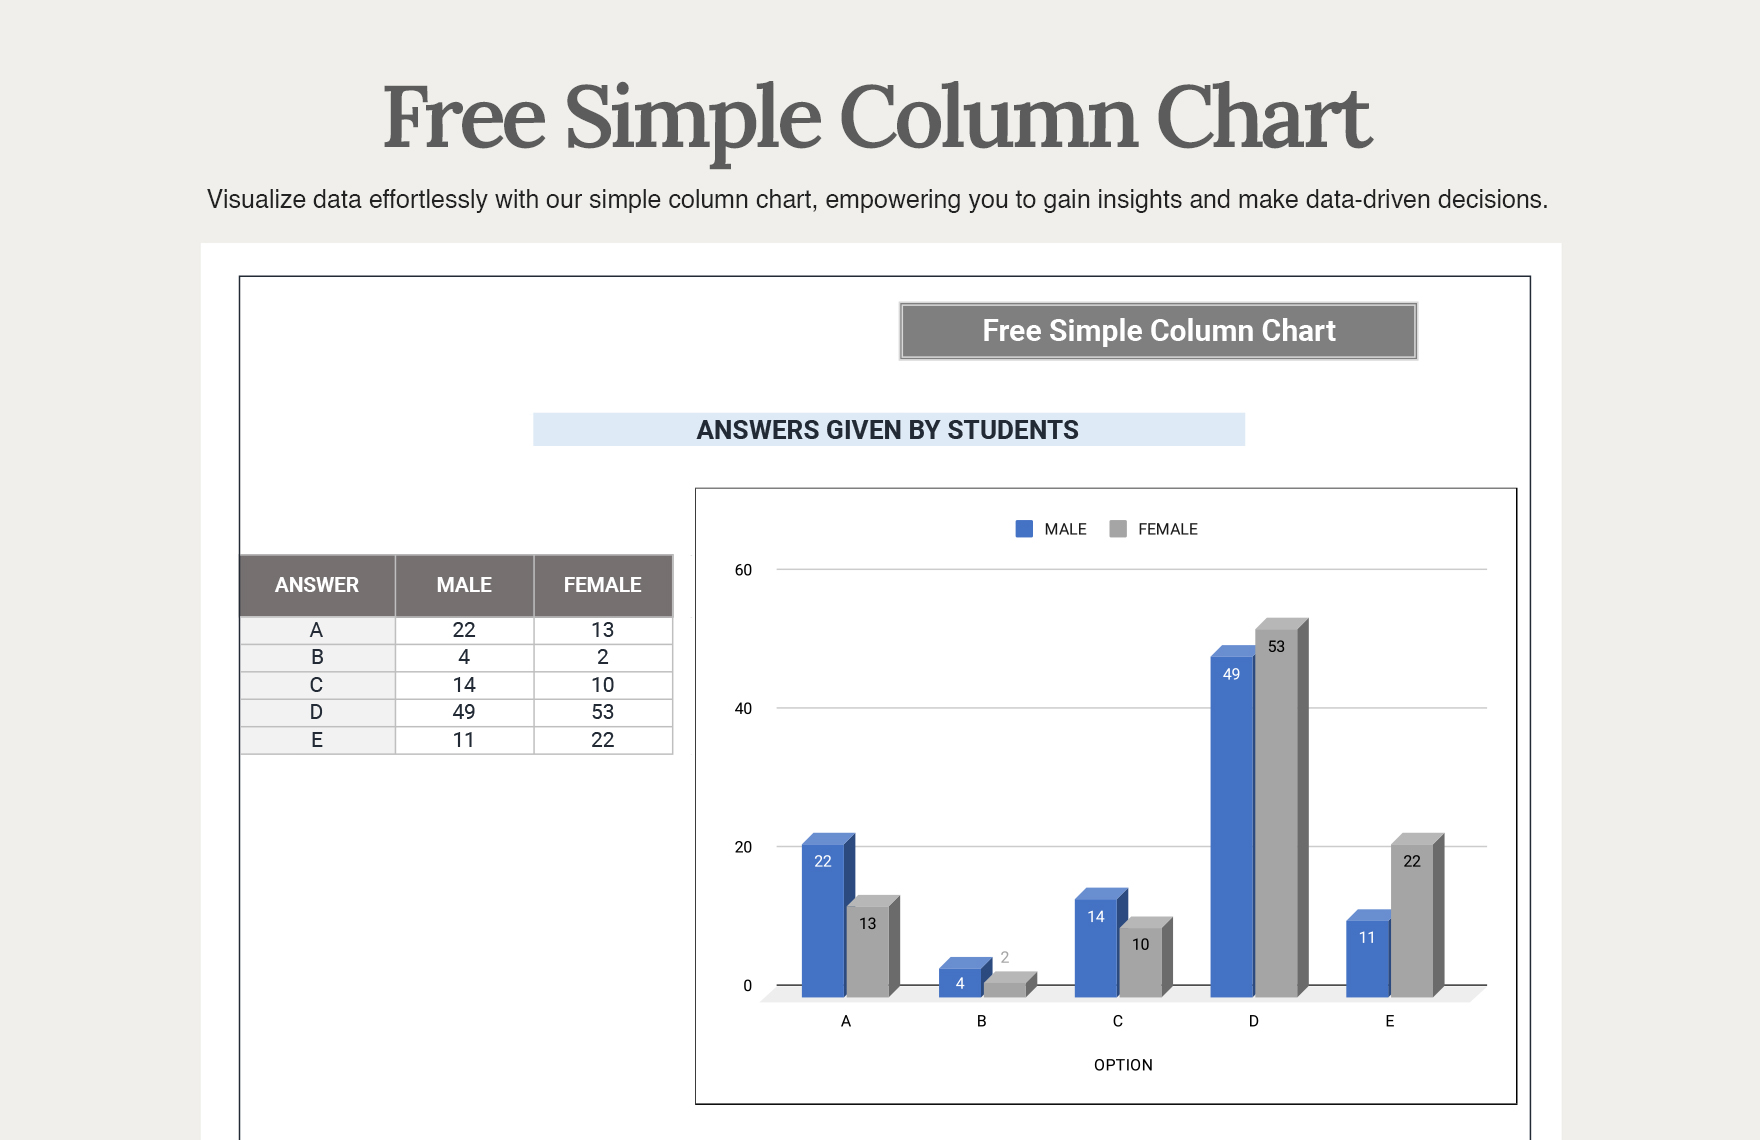
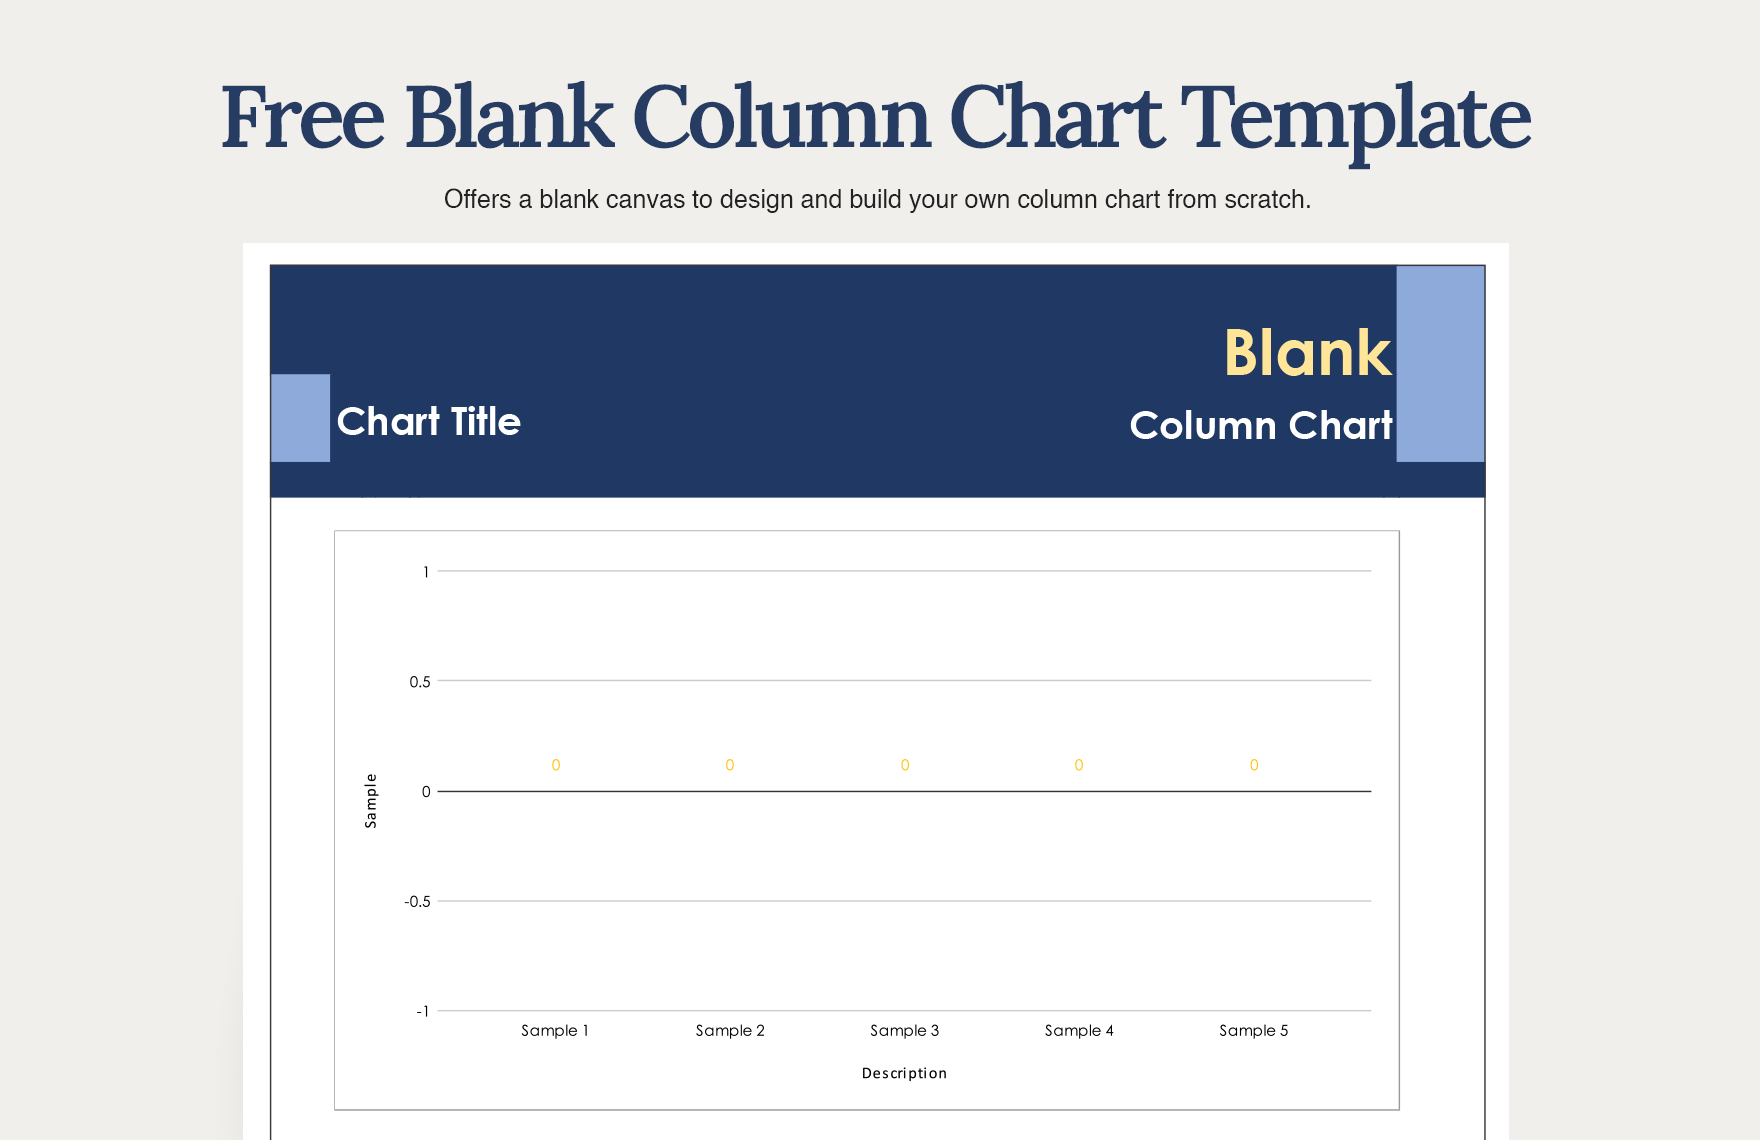
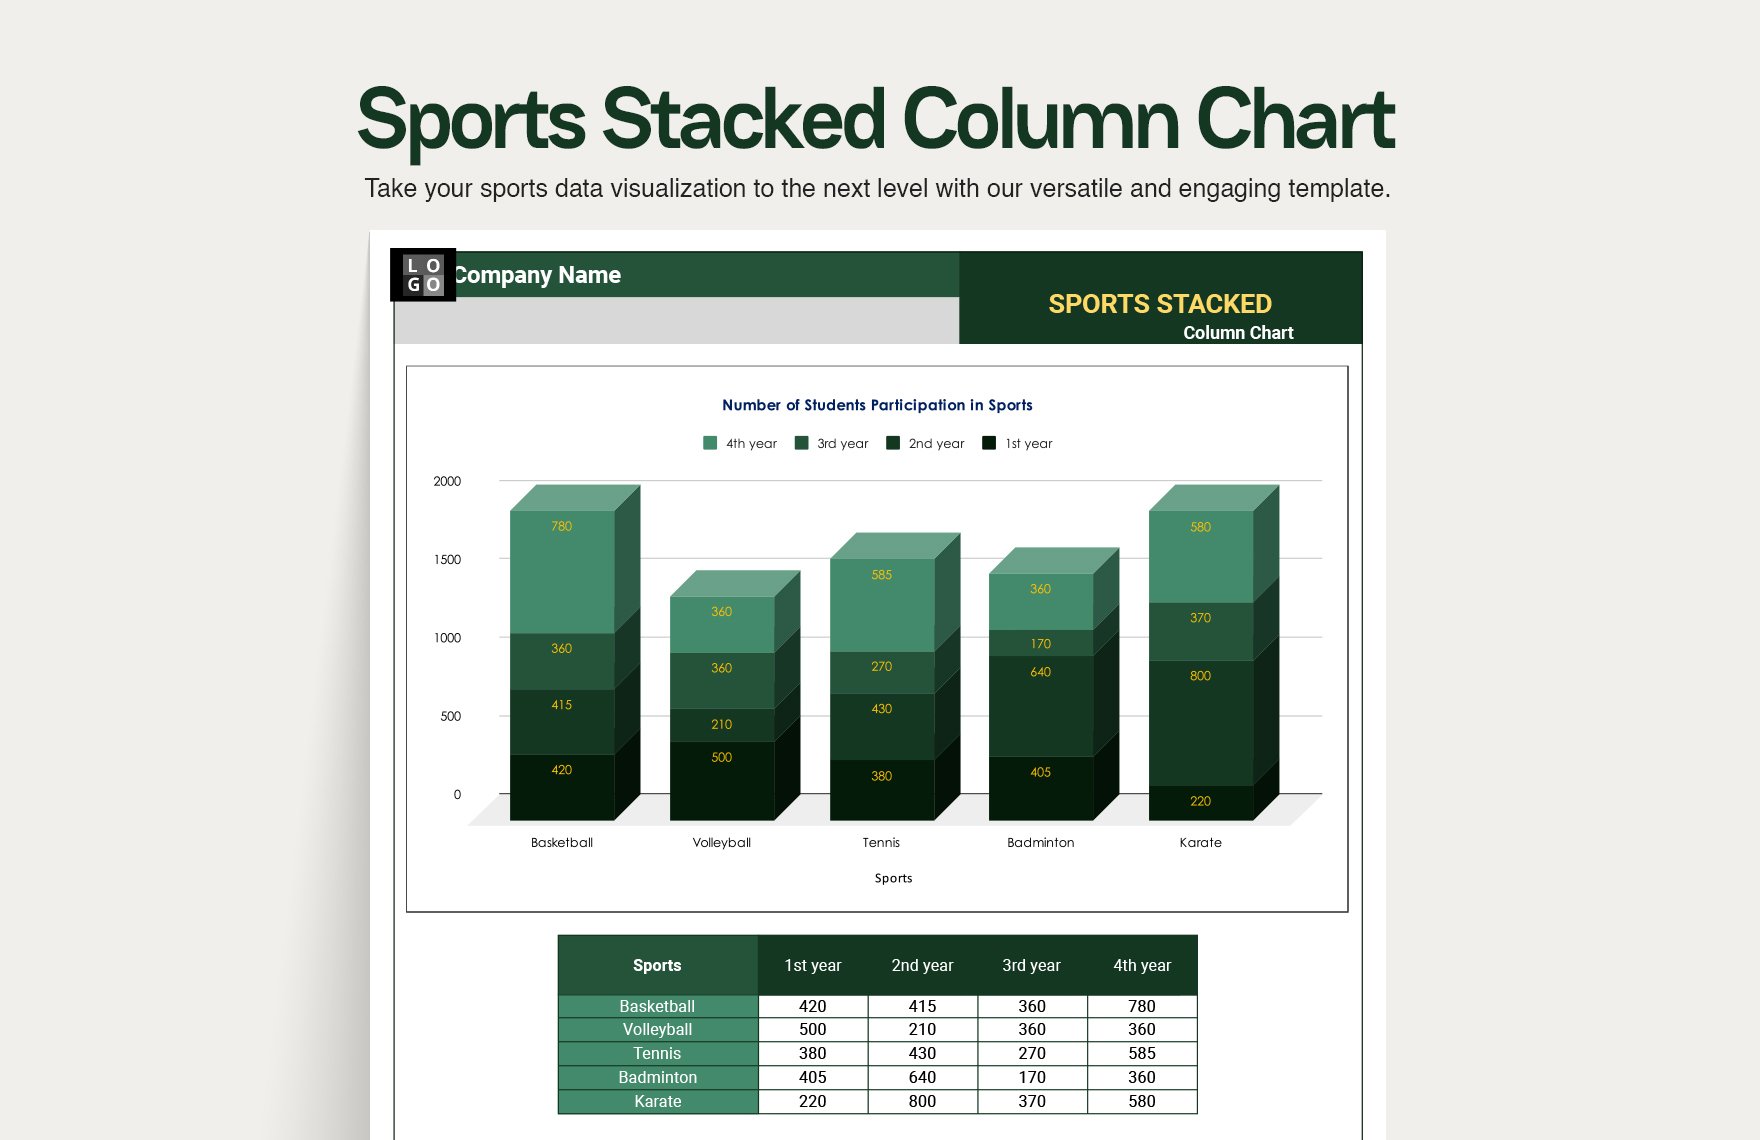
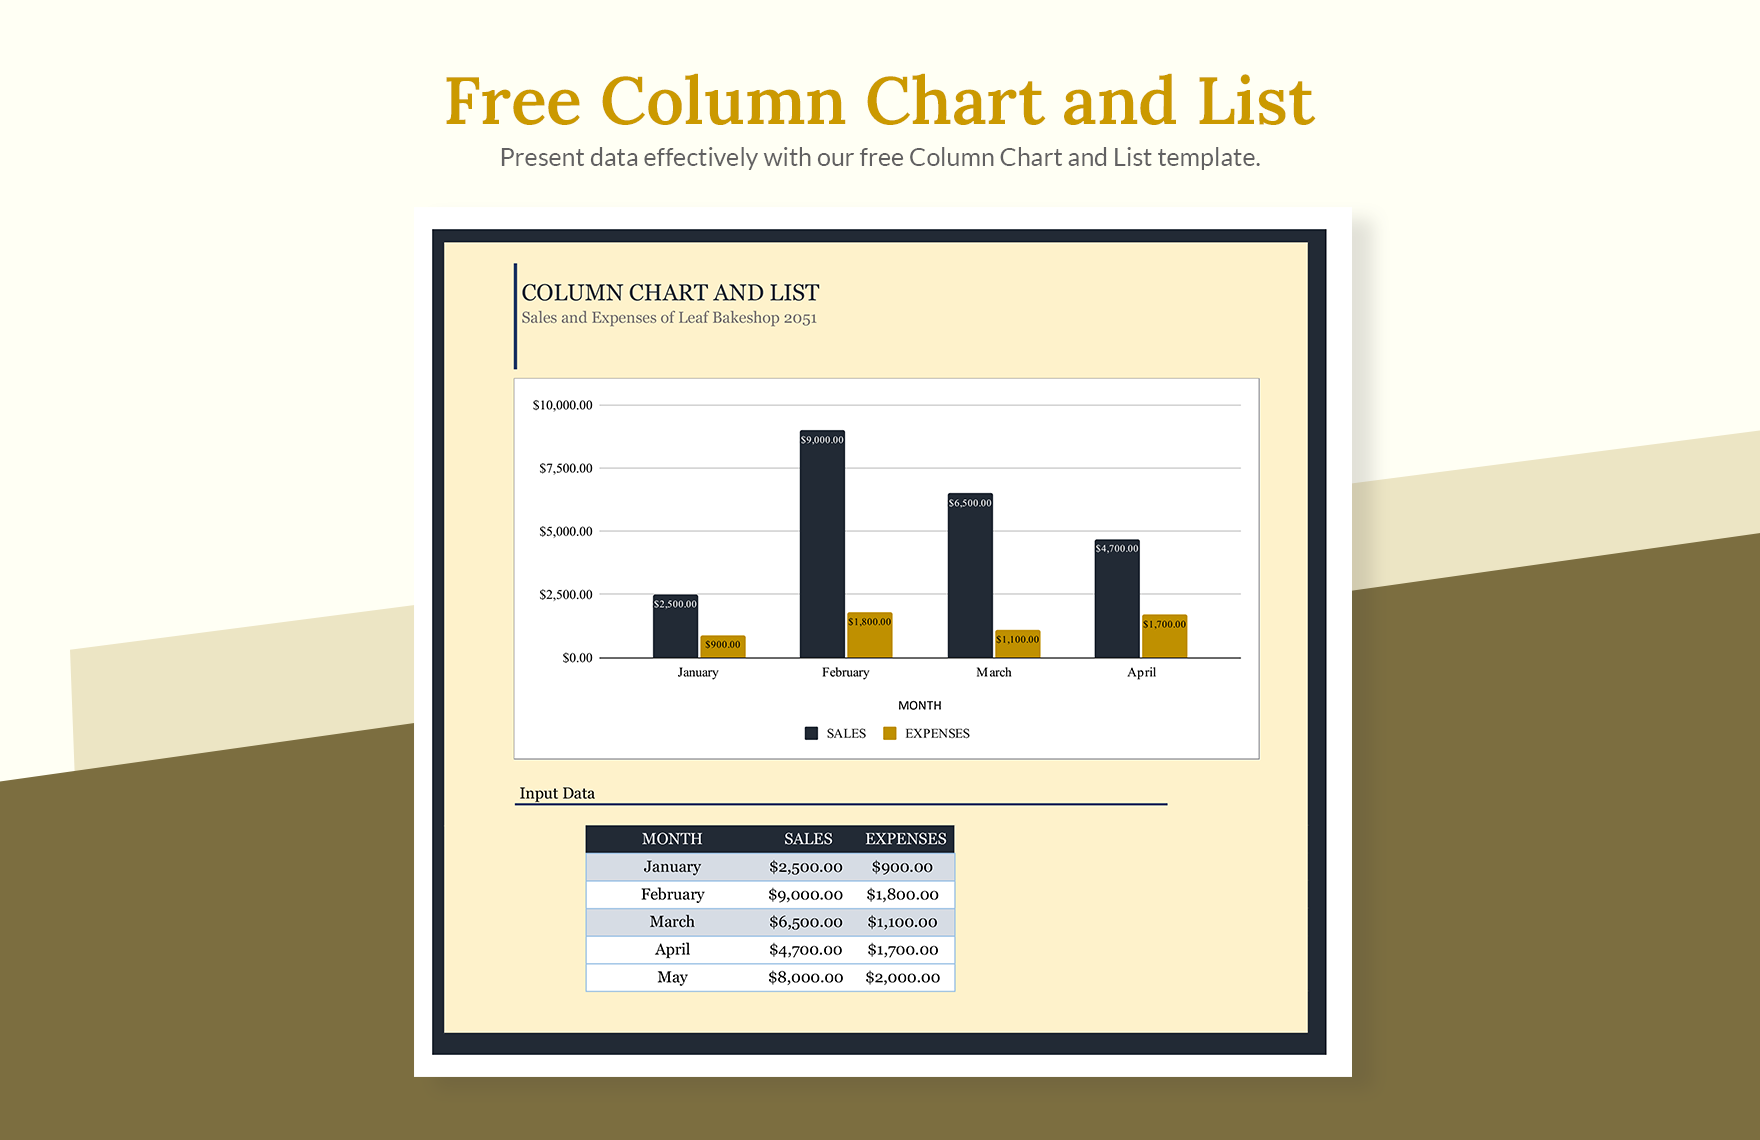
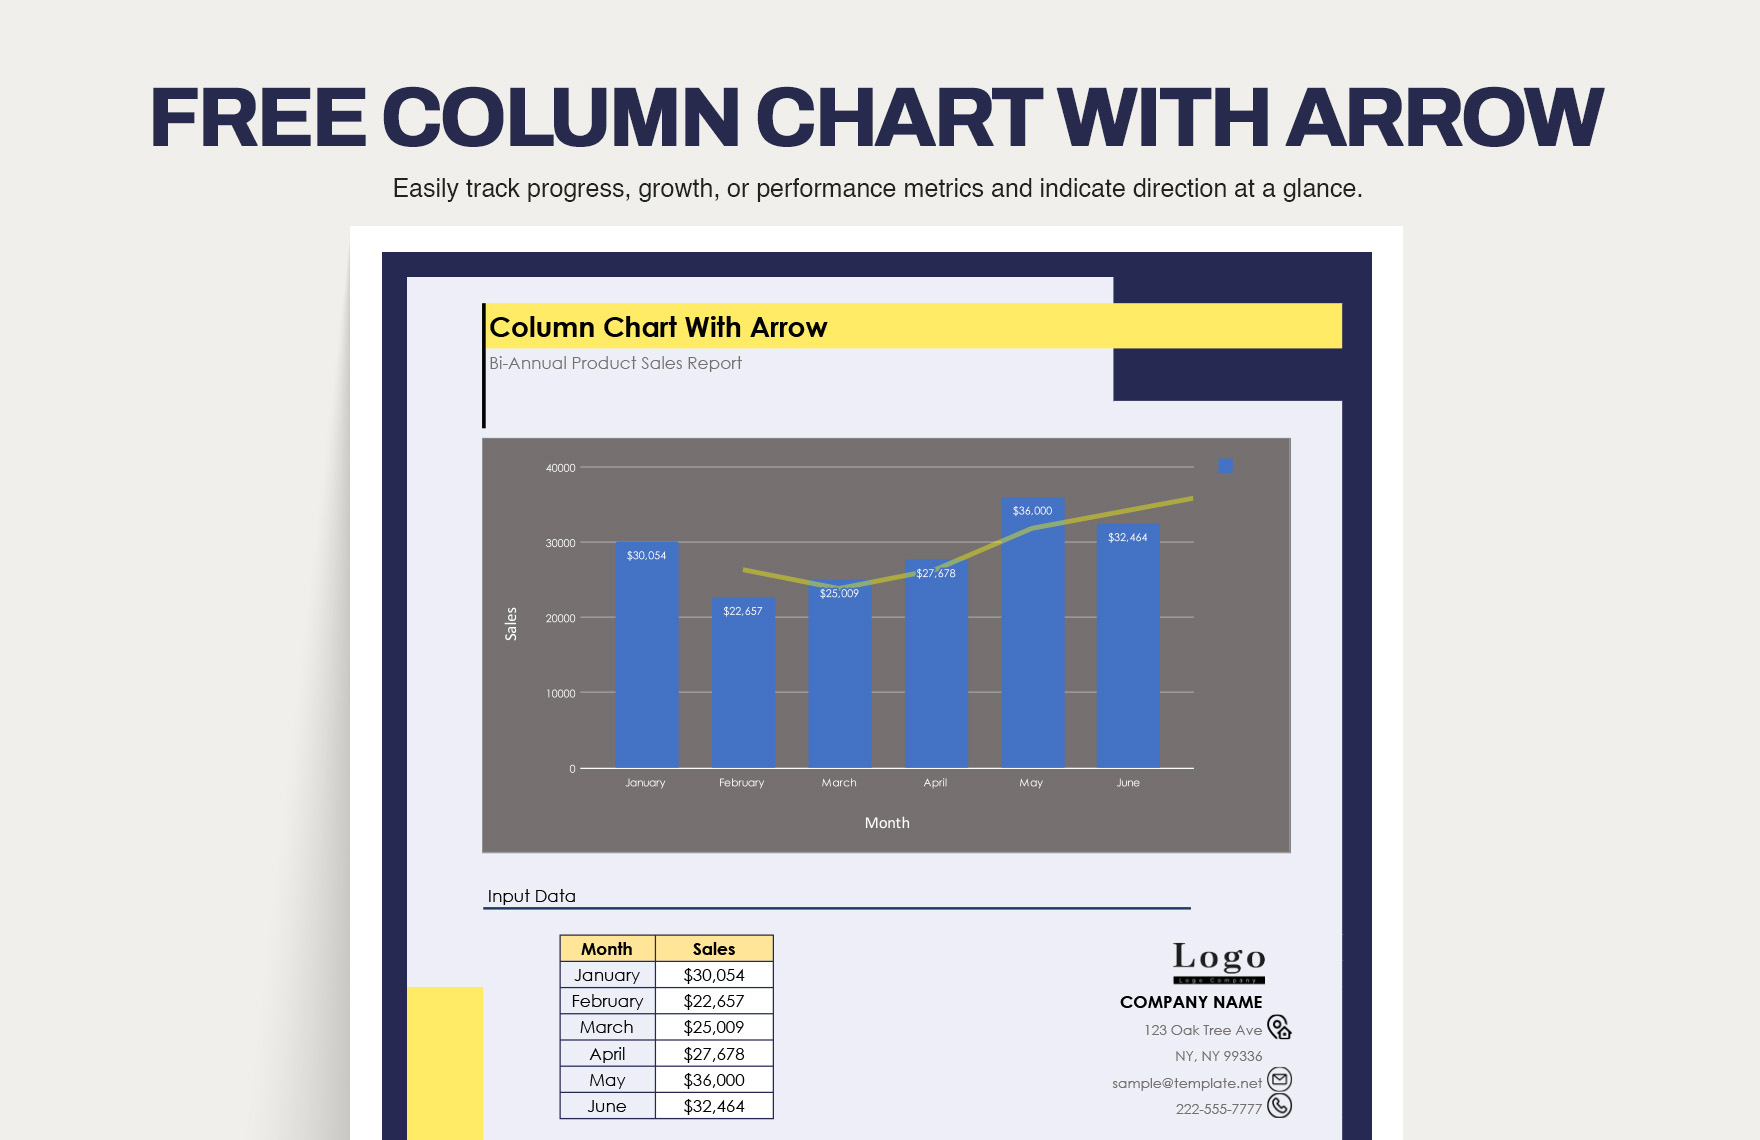
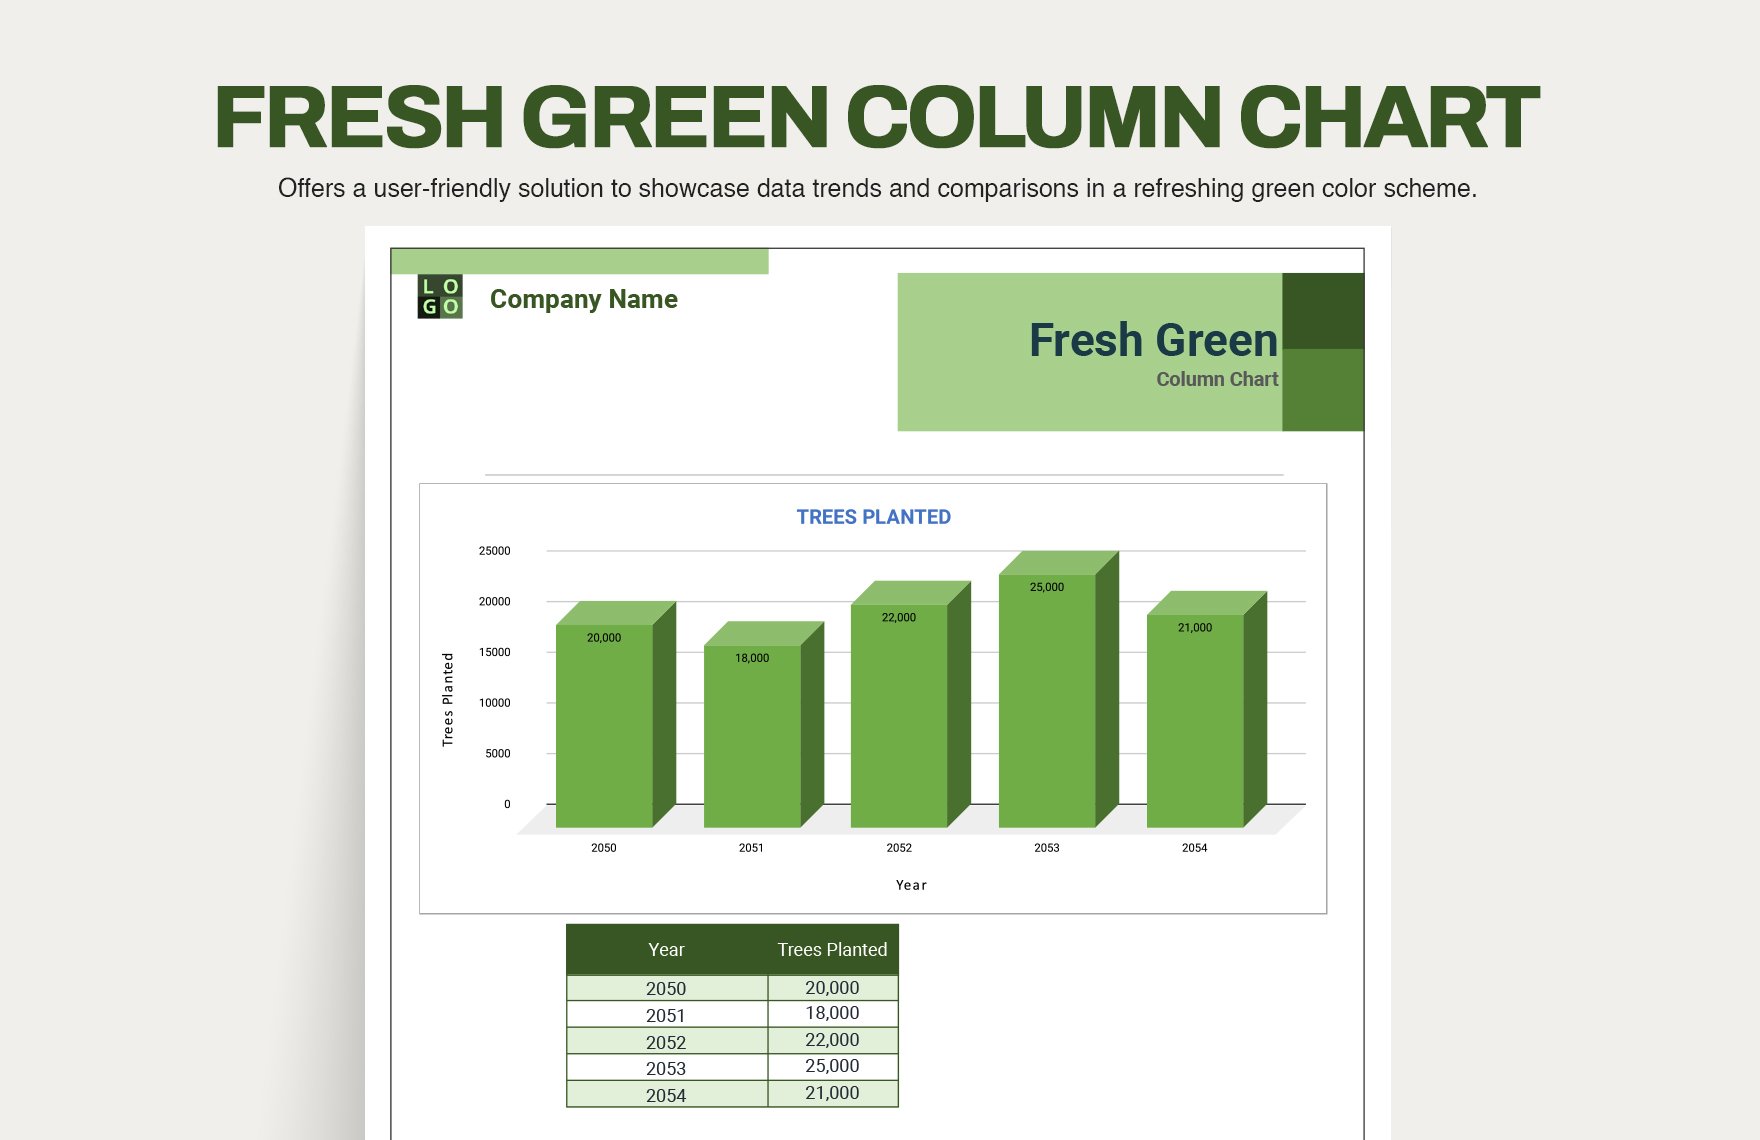
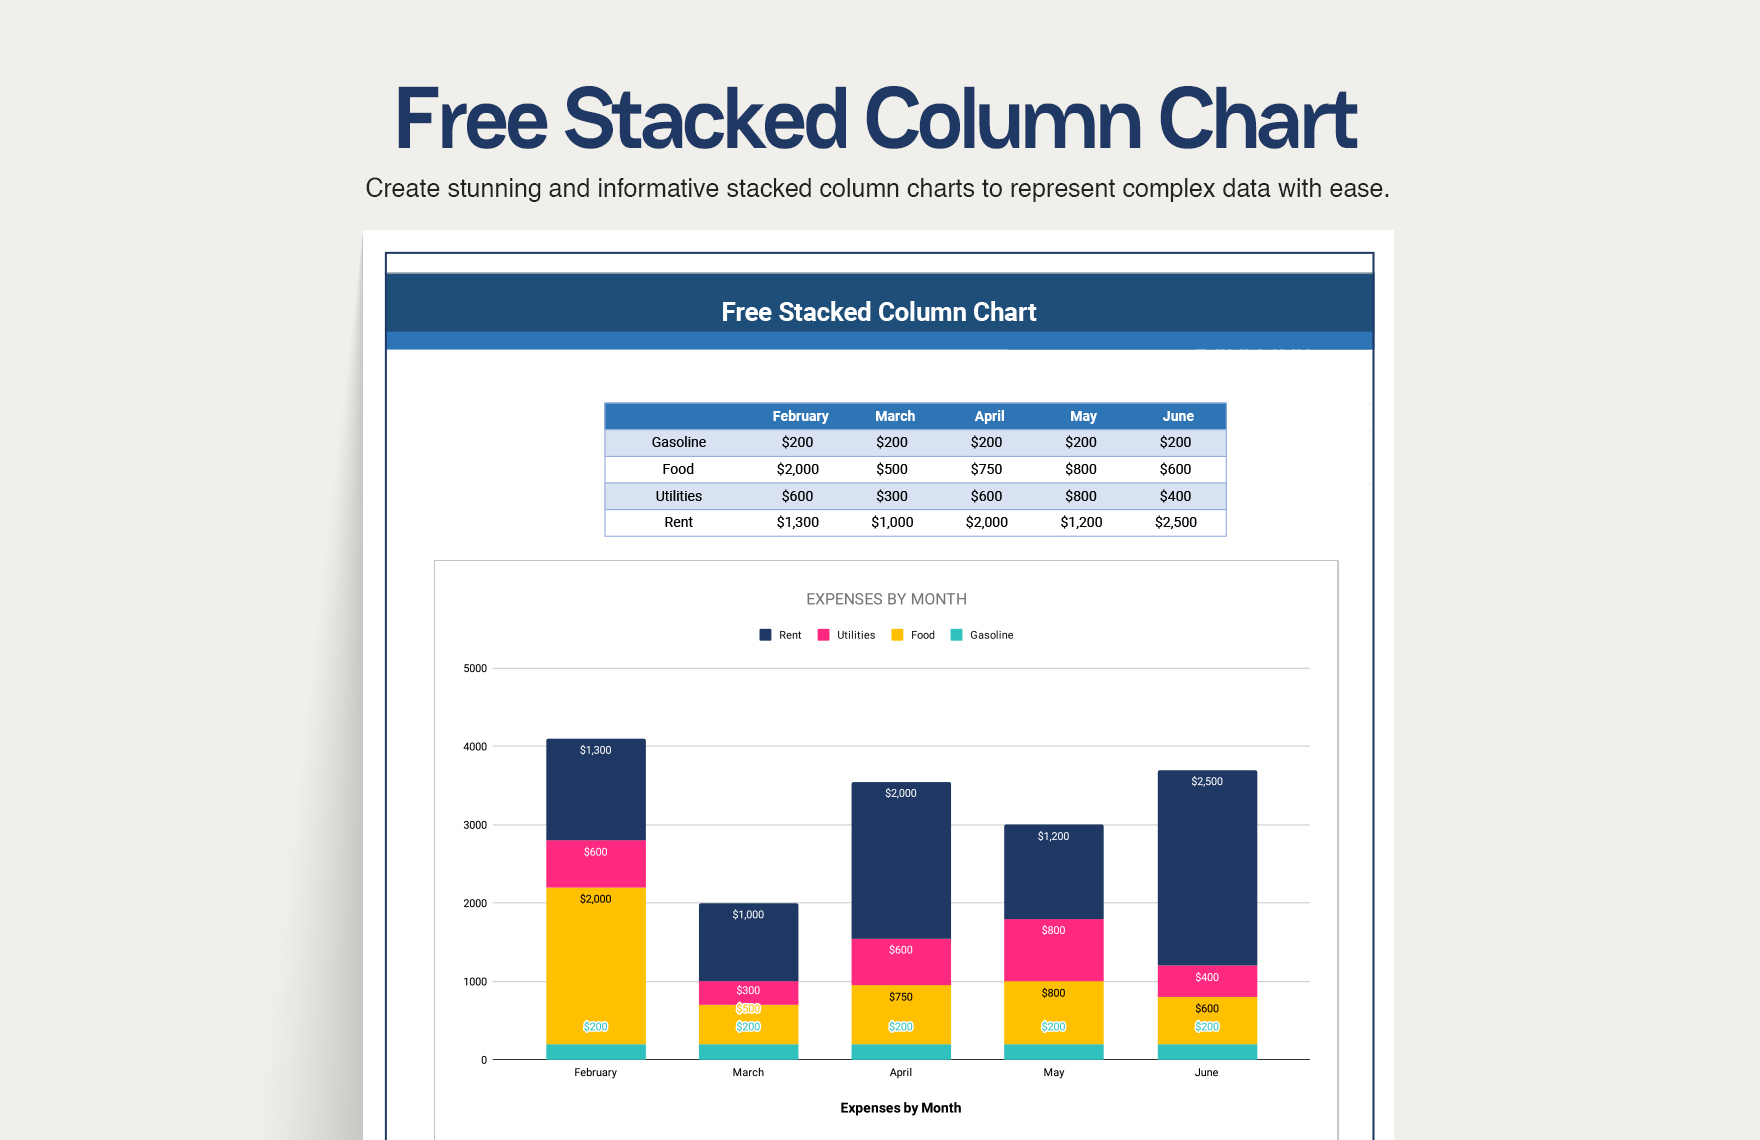
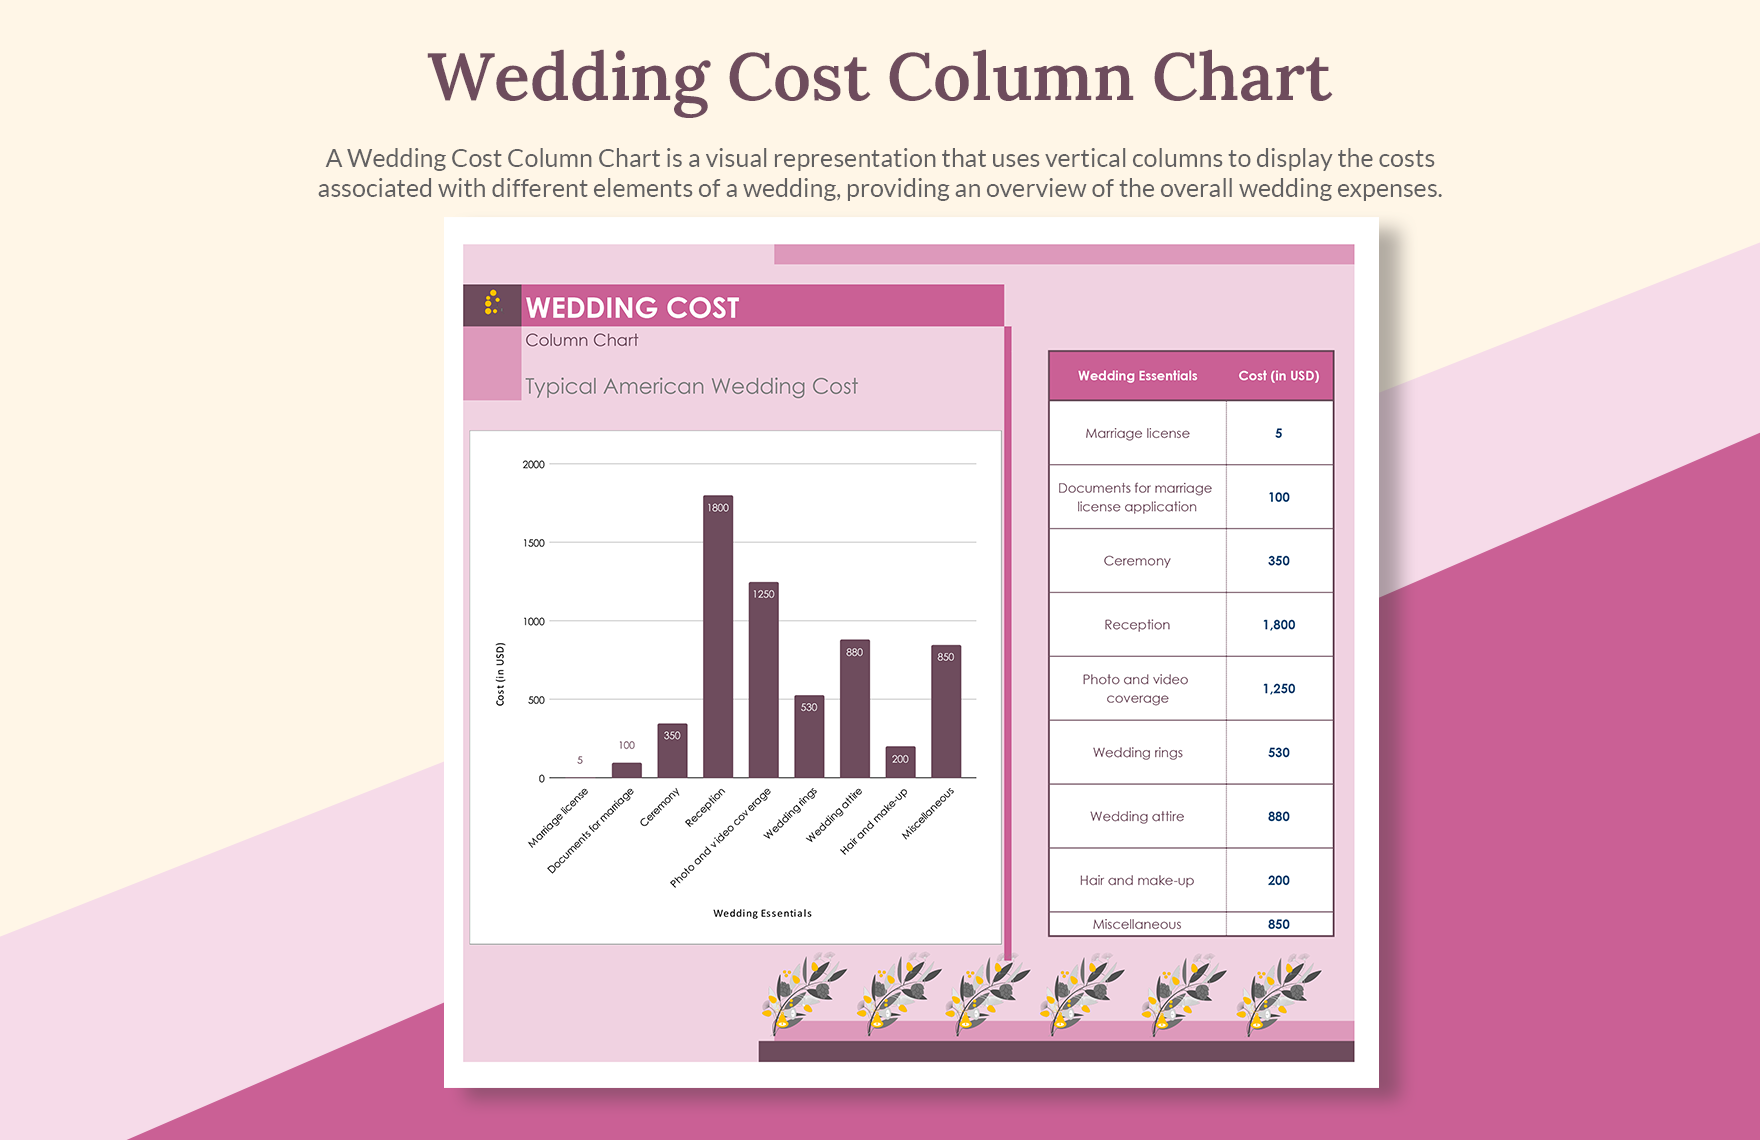
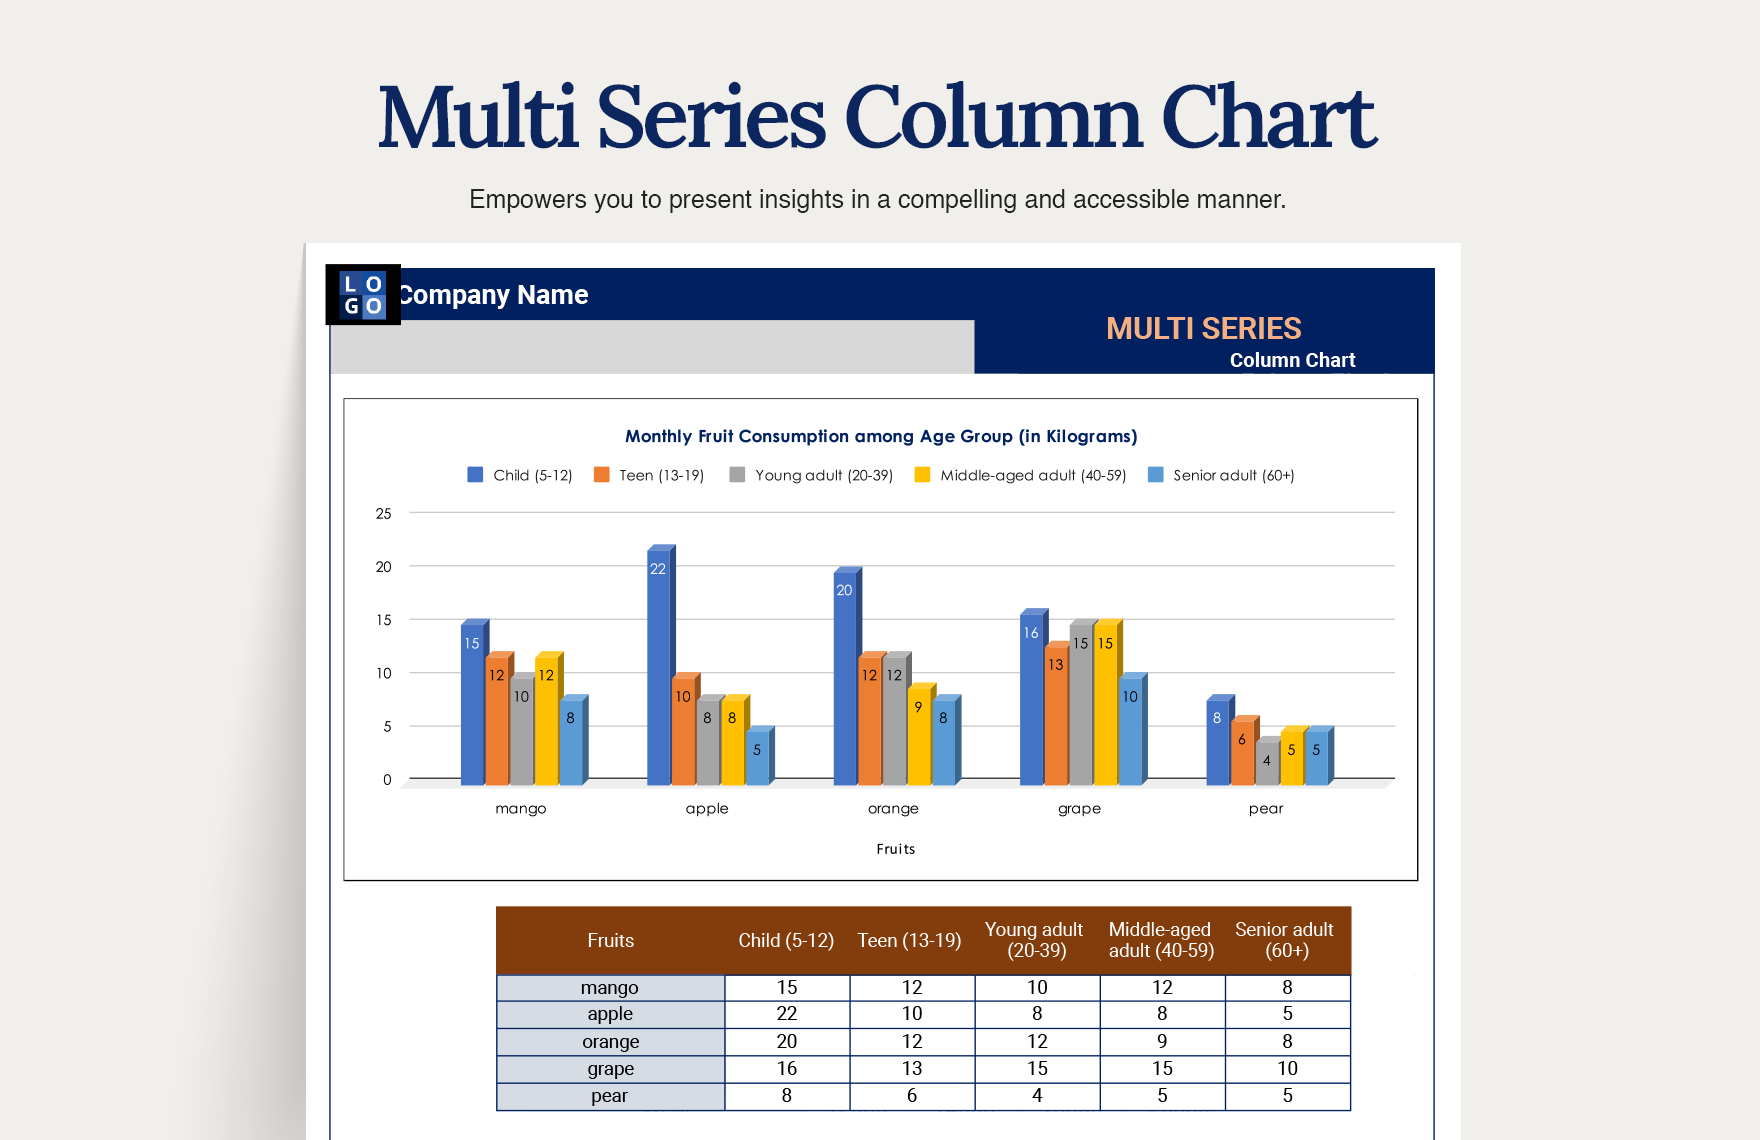
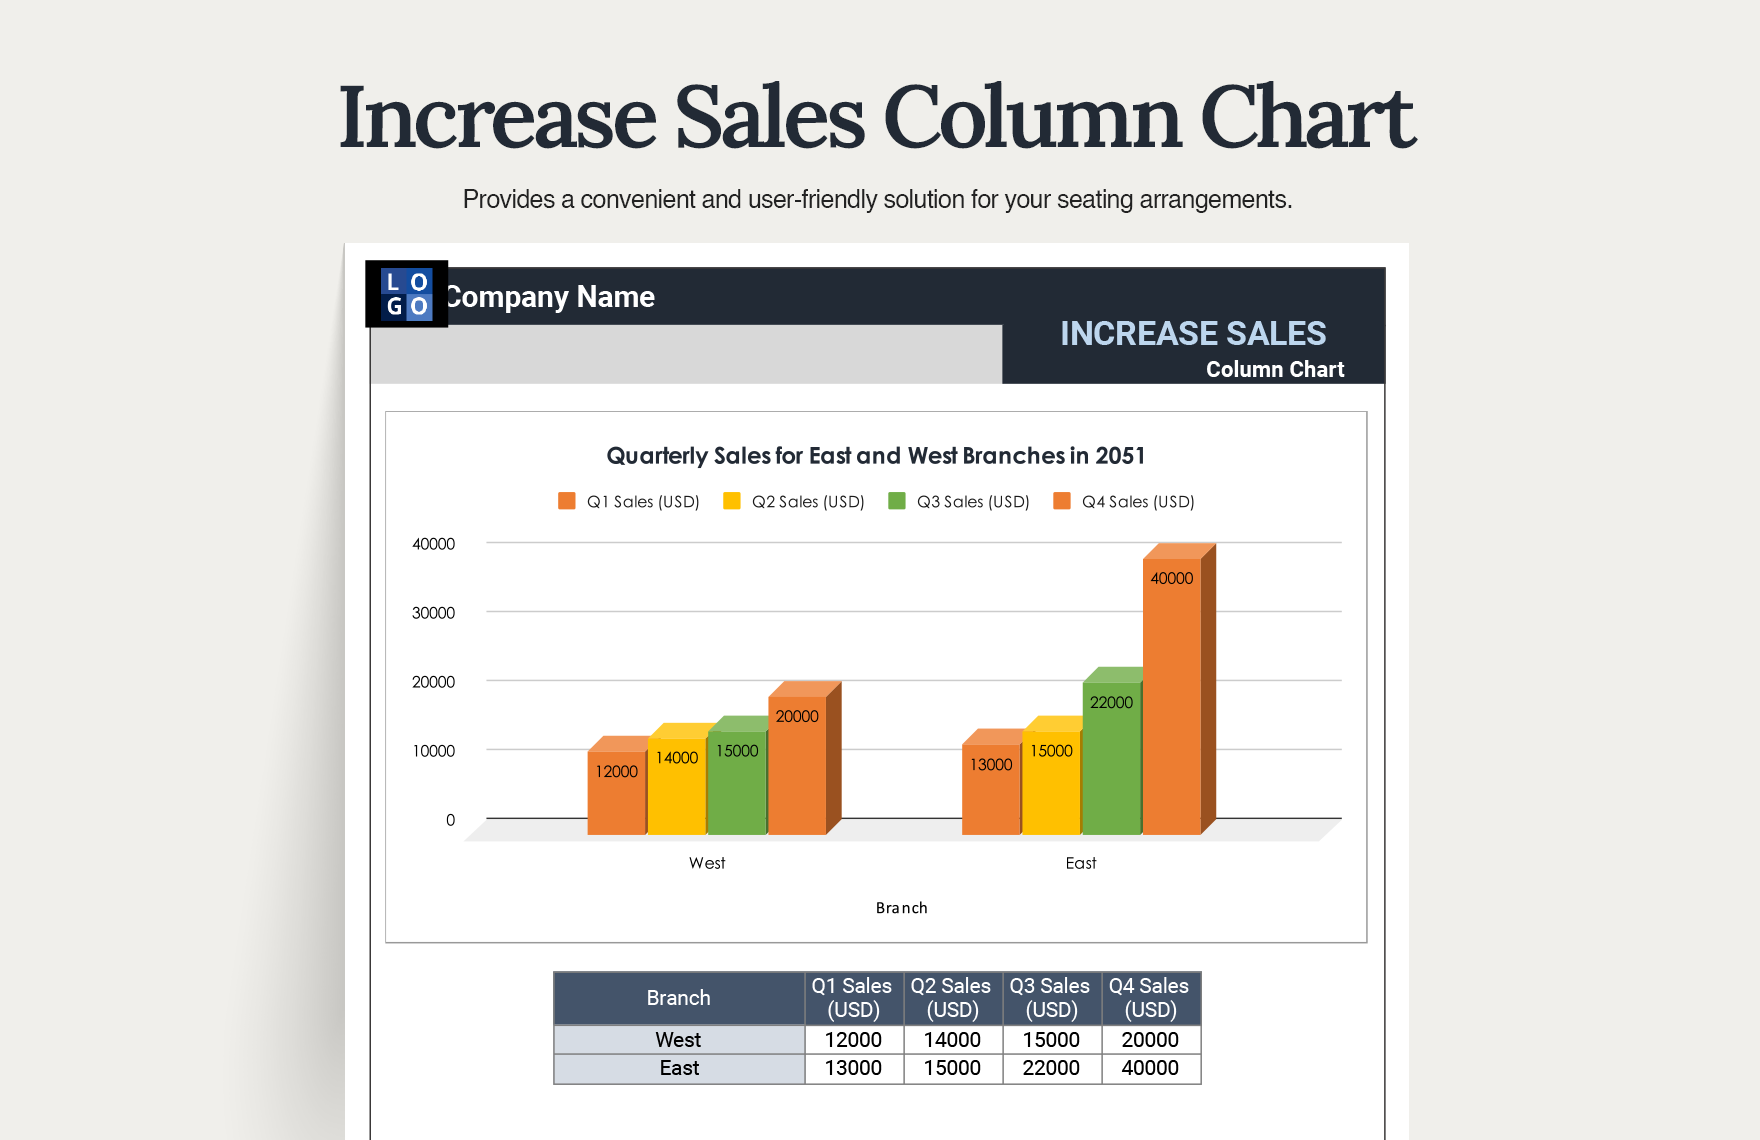
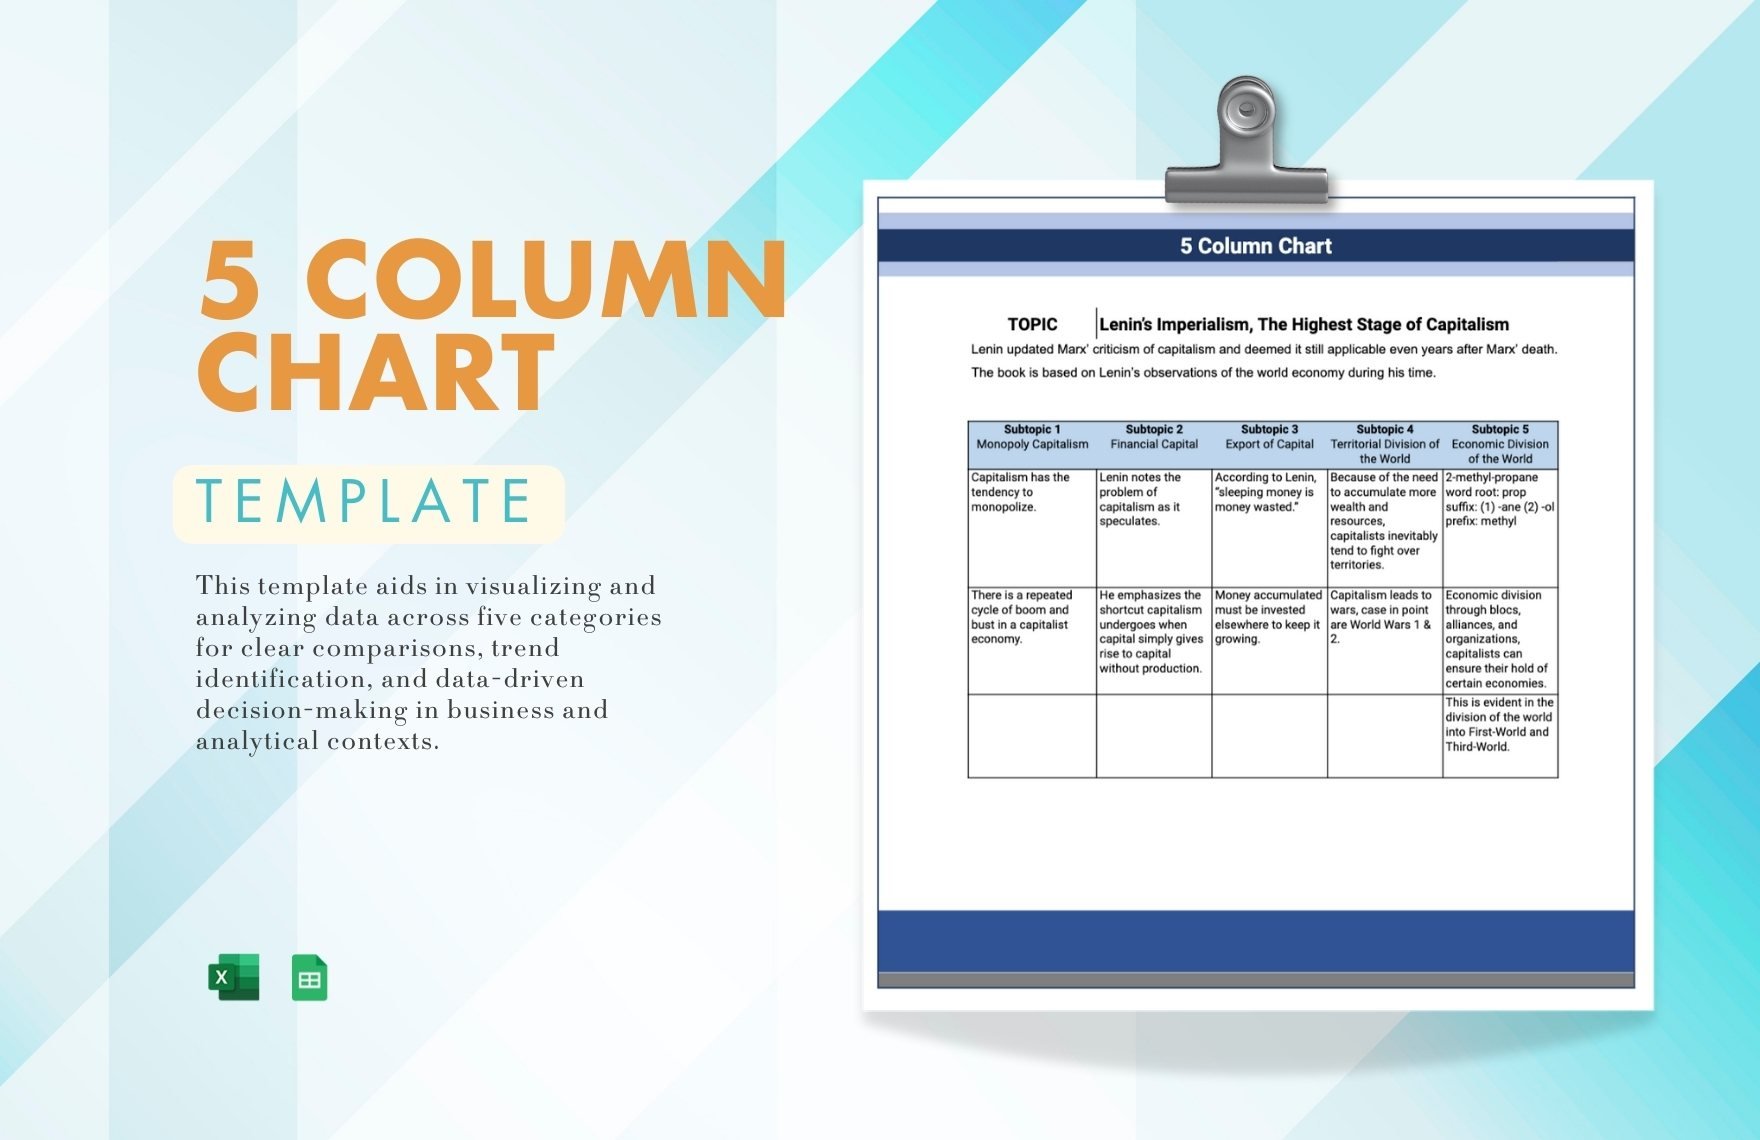
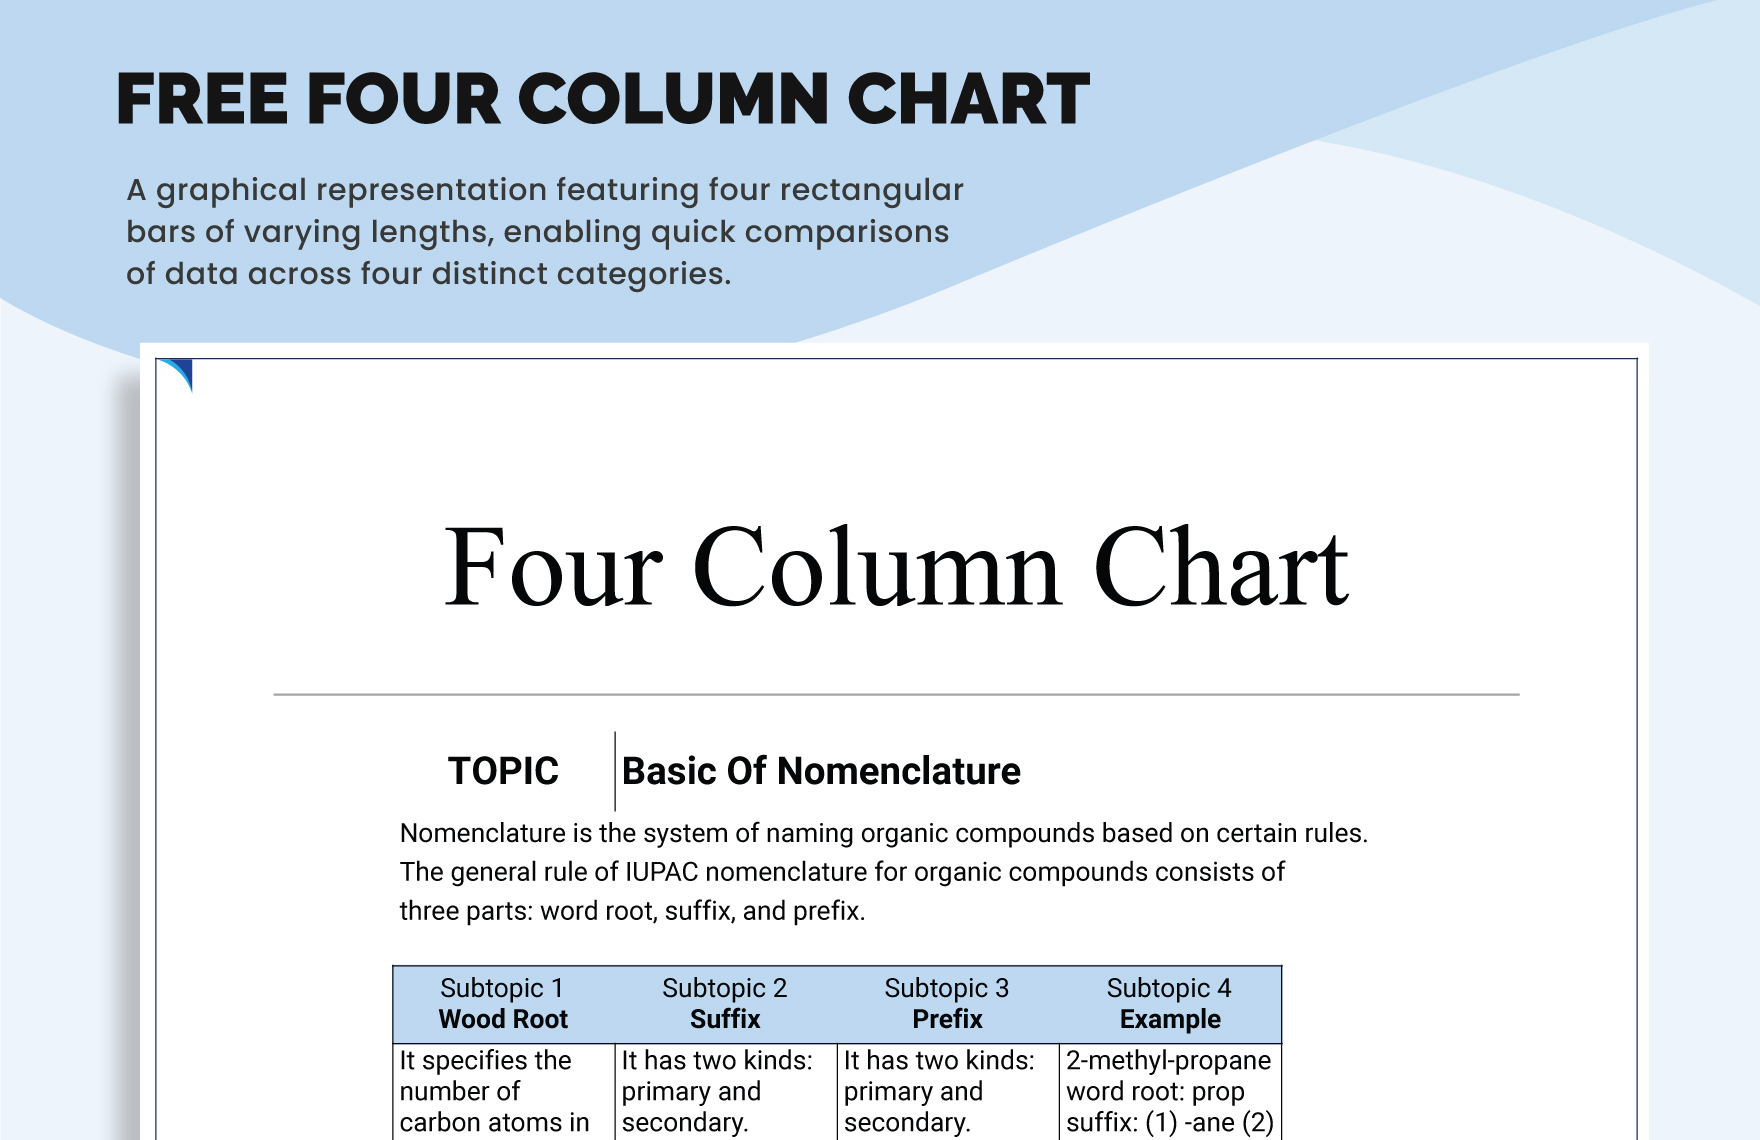
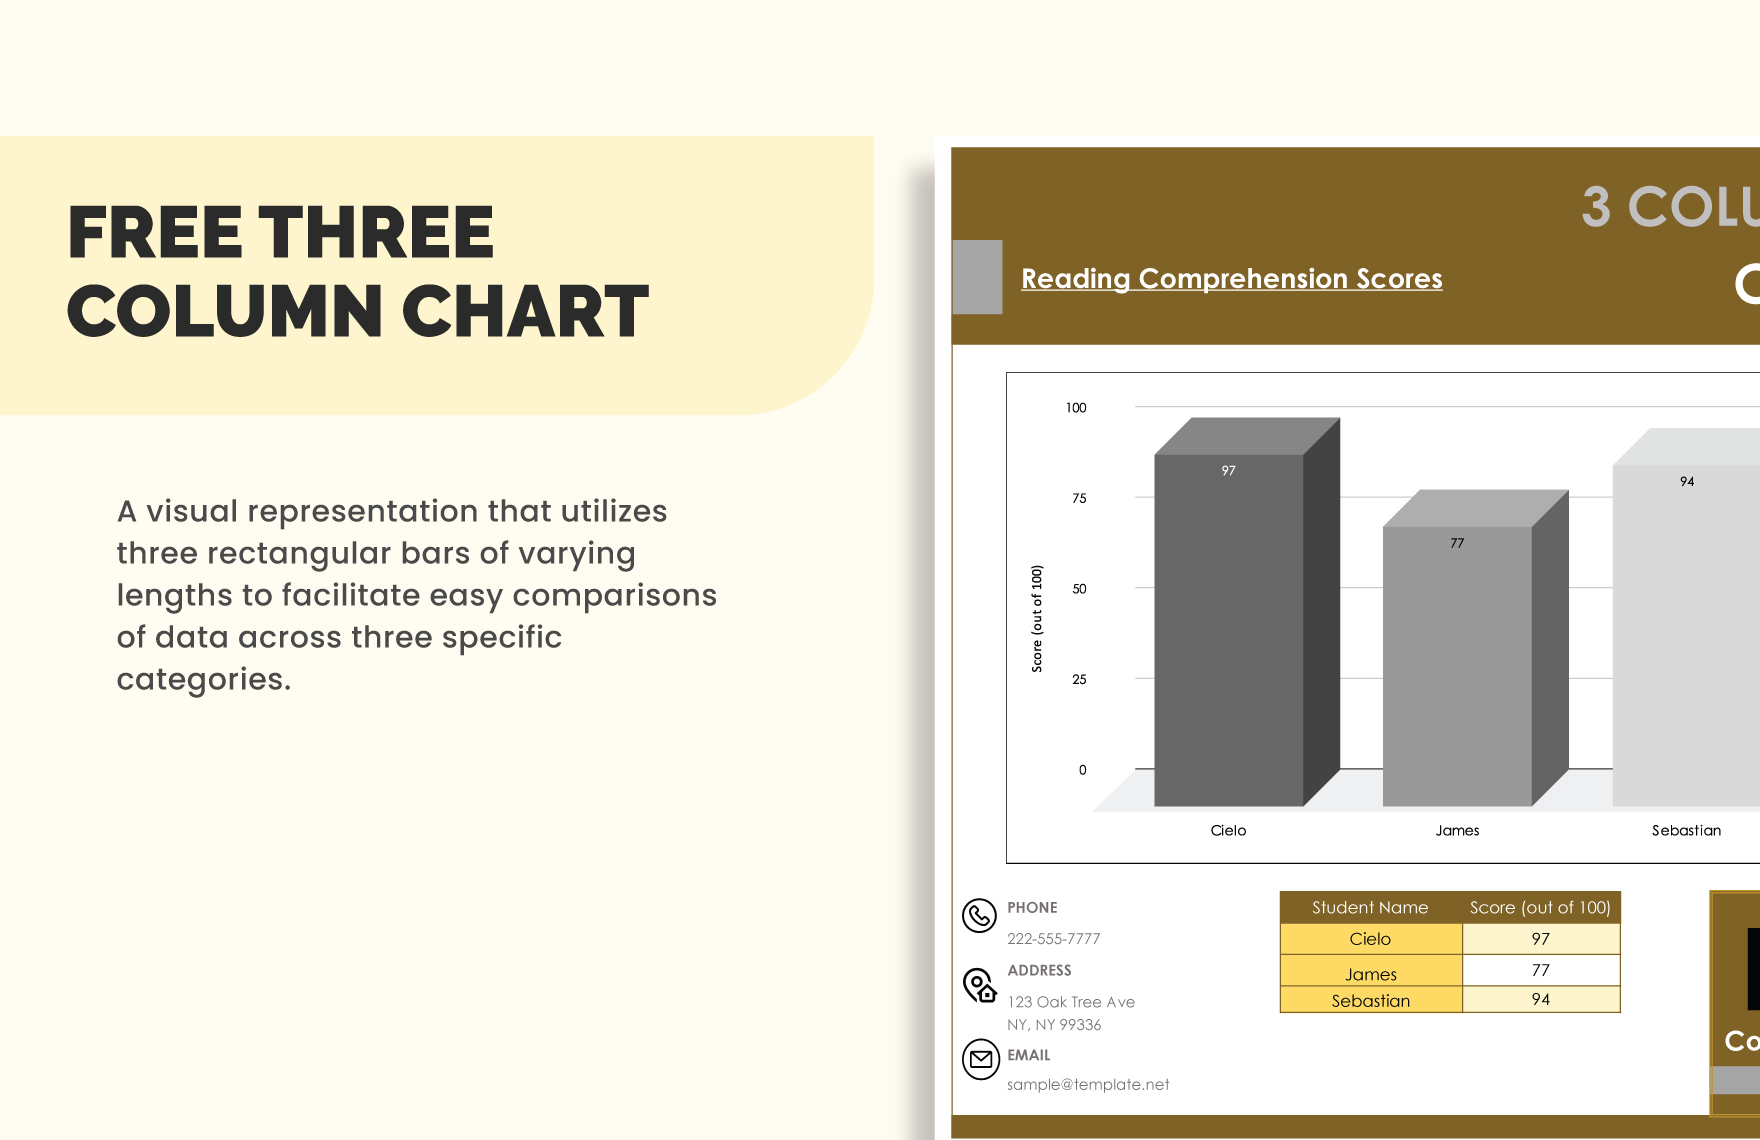
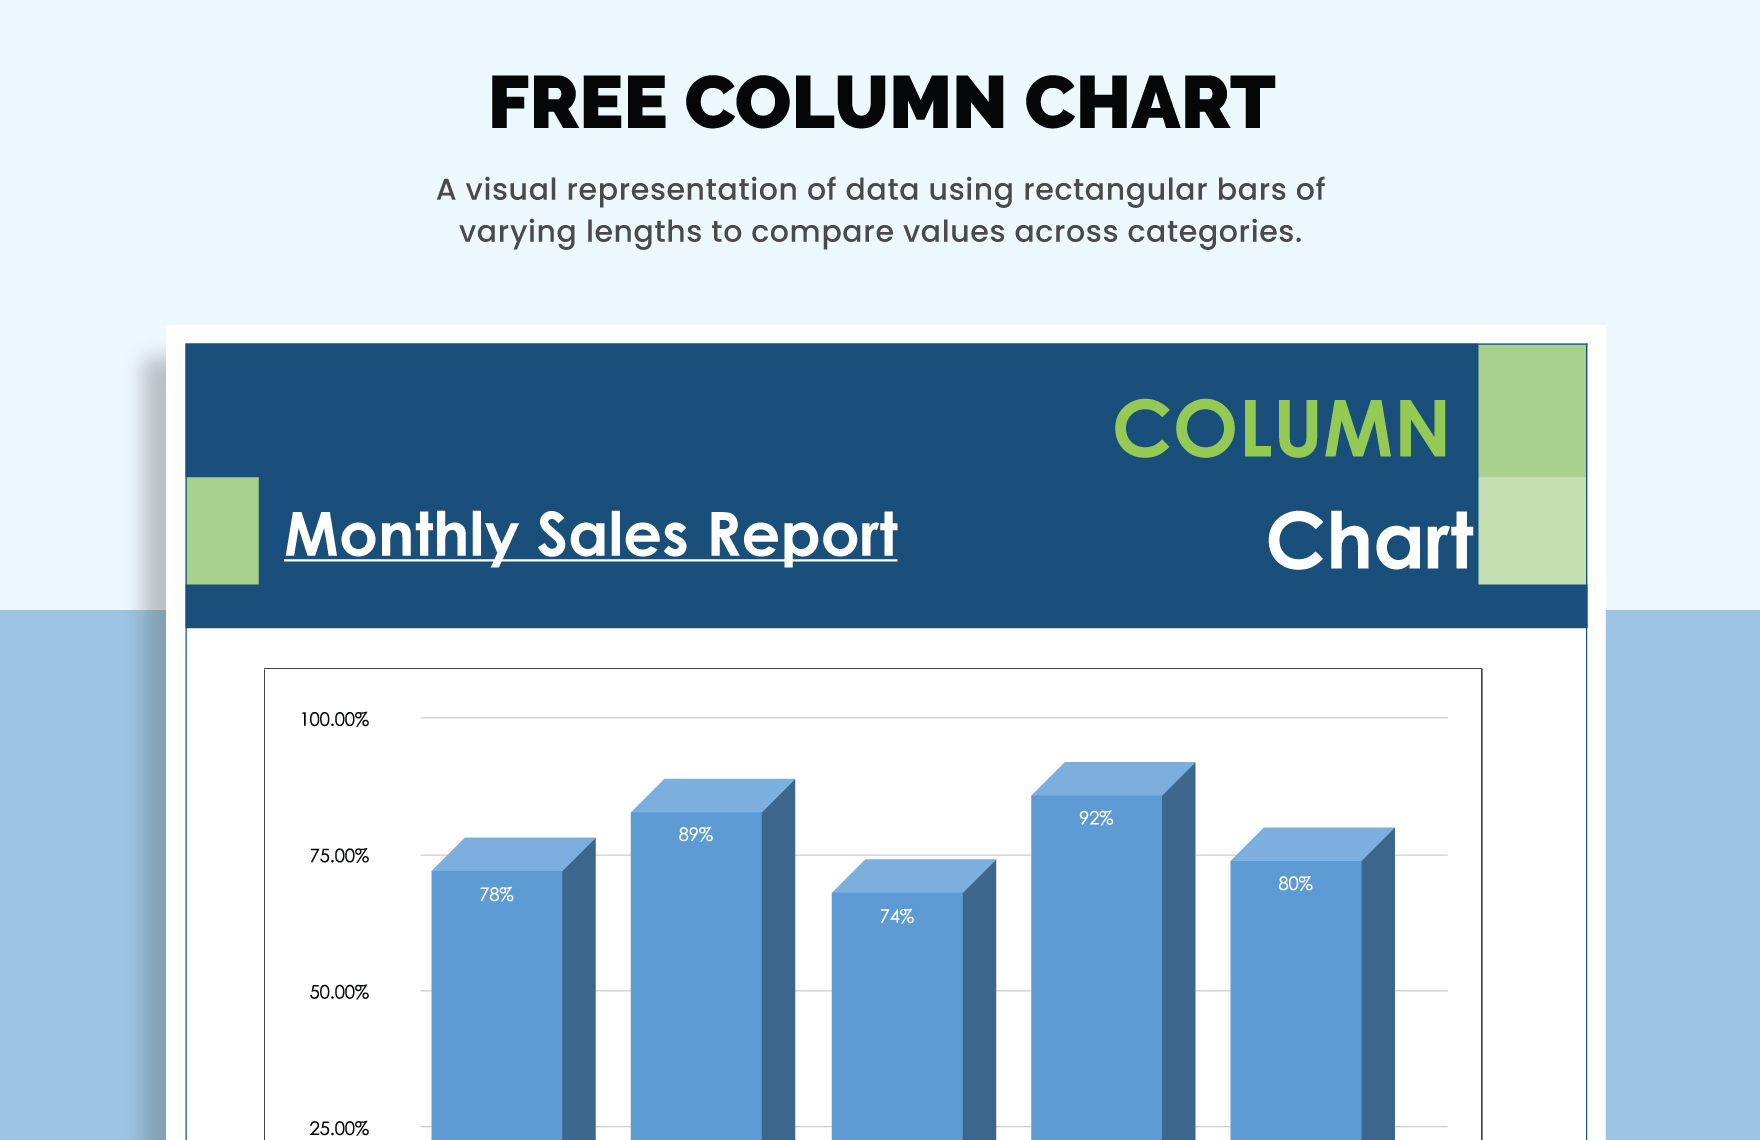
Keep your presentations engaging, your data clear, and your messages impactful with Column Chart Templates from Template.net. Whether you're an educator presenting statistics or a business professional explaining market trends, these templates are designed to help you communicate effectively. Use them to promote a new product's performance statistics or visualize financial data during a quarterly review. Each template includes sections for time, date, and contact information, ensuring you can communicate every detail effectively. There's no advanced design skill required either; they come with professional-grade design, saving you time and effort. Customizable layouts make it easy to adapt content for print or digital distribution across a variety of platforms.
Discover the many Column Chart Templates we have on hand, making it simple to create visuals tailored to your specific needs. Choose a template, swap in your data, and tweak colors and fonts to match your brand’s identity. Elevate your charts by dragging and dropping icons, graphics, and even adding animated effects or using AI-powered text tools to enhance clarity. The possibilities are endless, and even those without graphic design expertise can achieve stunning results effortlessly. Our library is regularly updated with new designs, so you always have access to the latest trends in visualization. When you’re finished, download or share your charts via email, link, or export for printing.
