Visualize Marketing Success with Advertising Chart Templates from Template.net
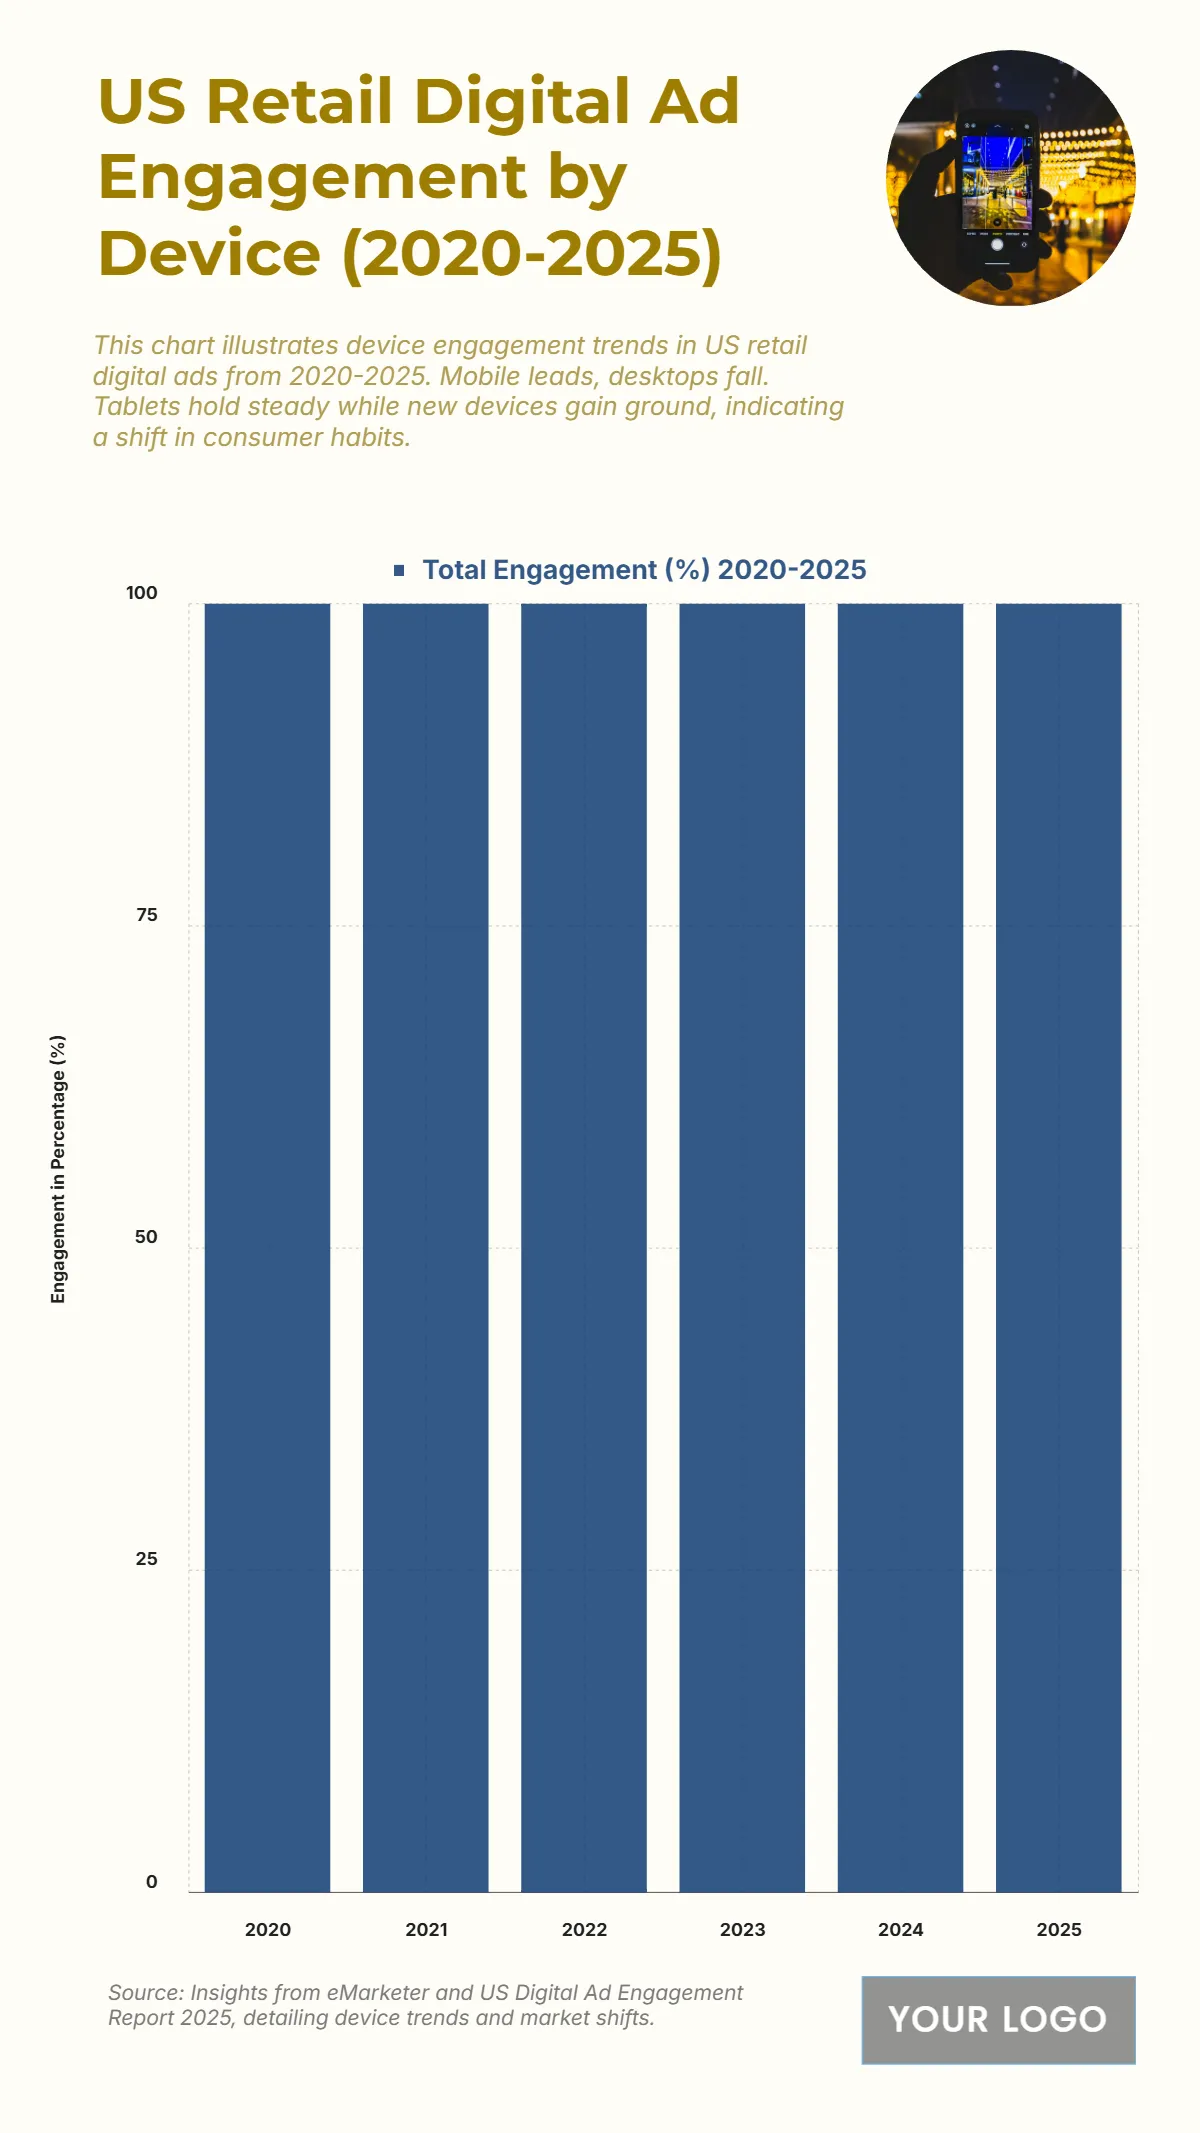
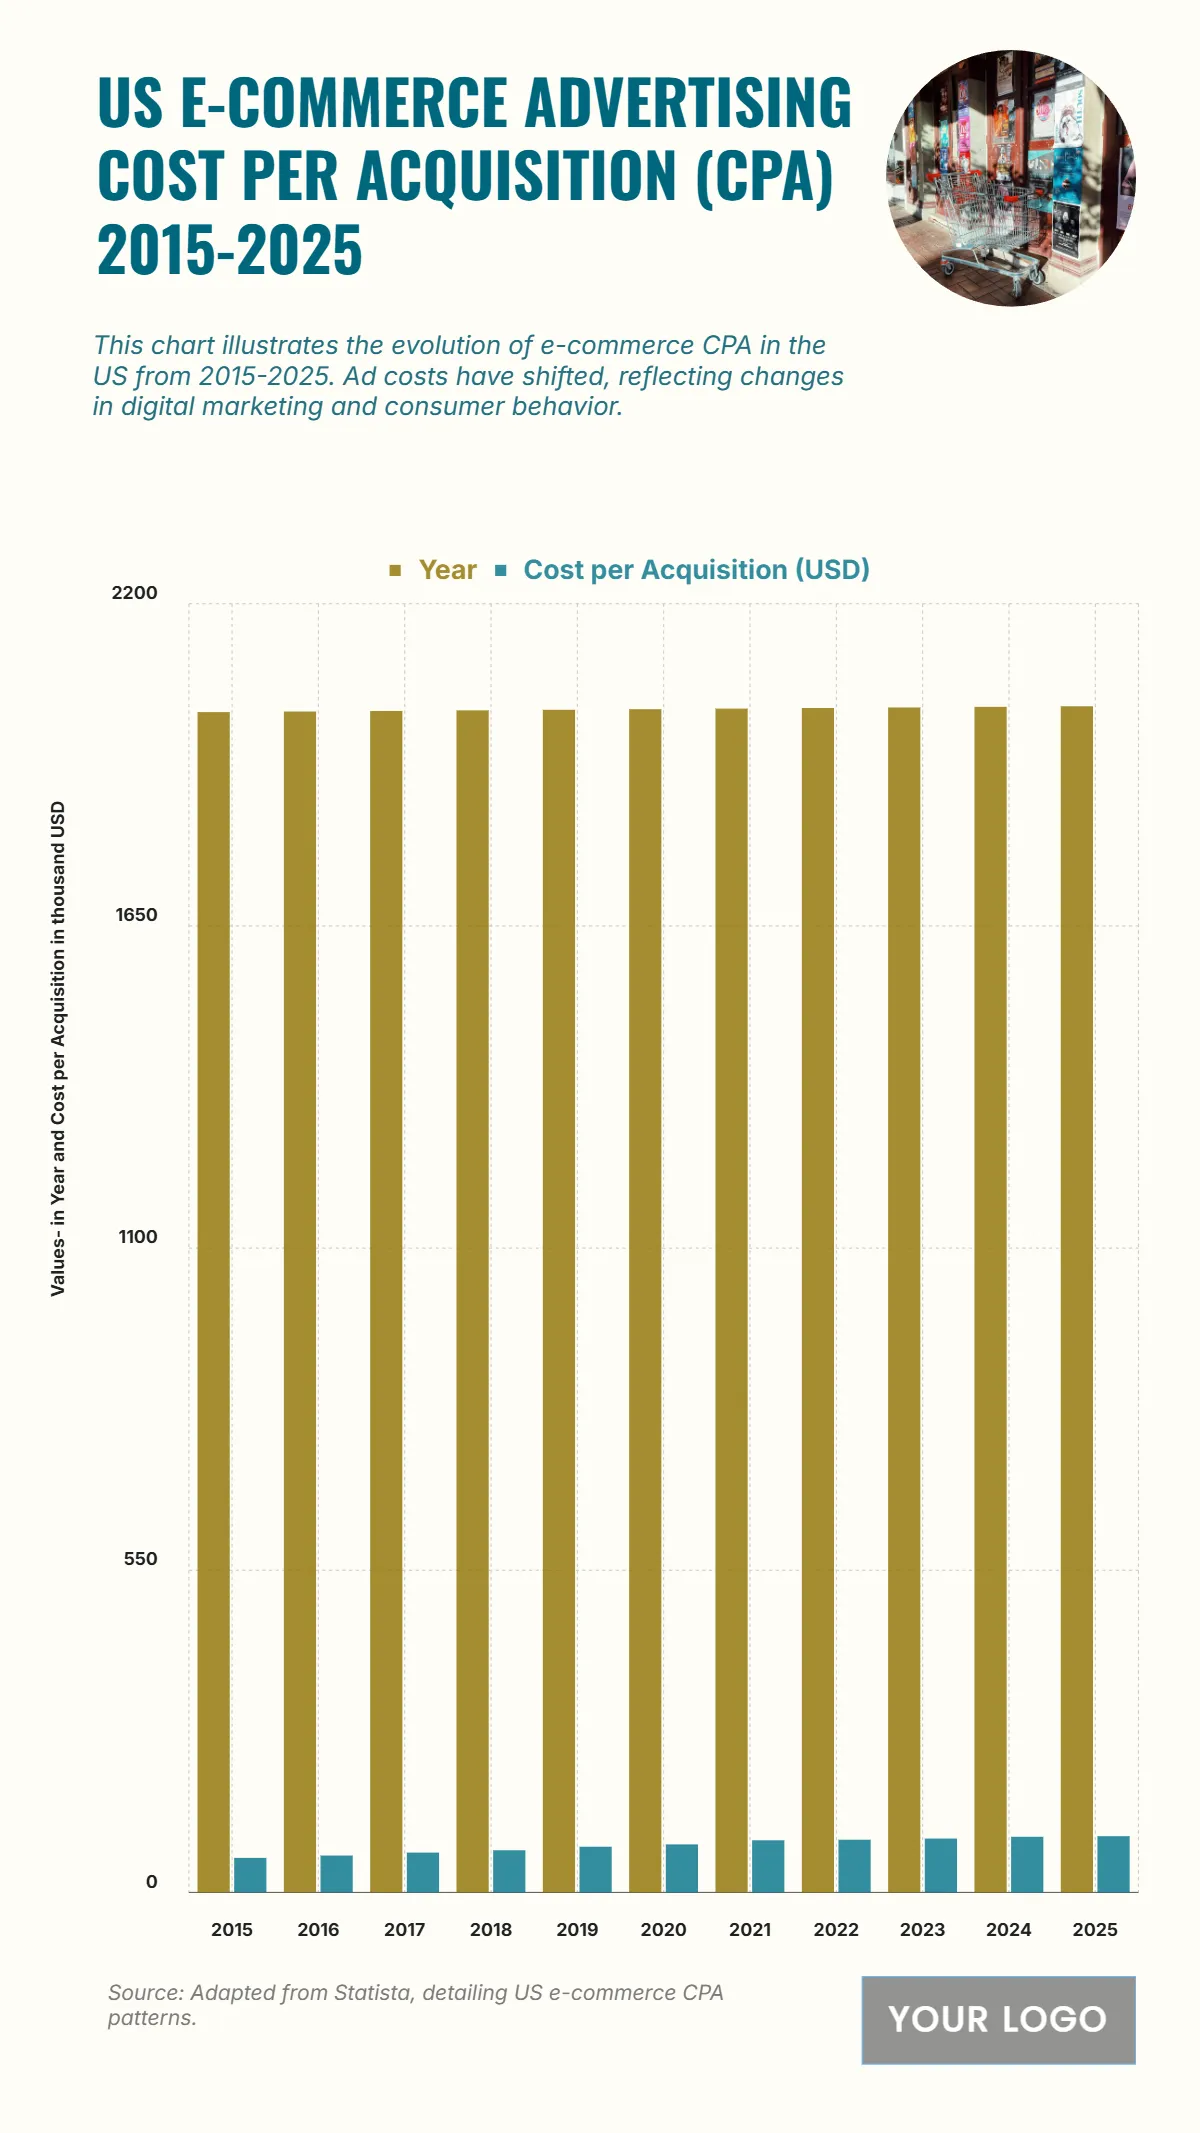
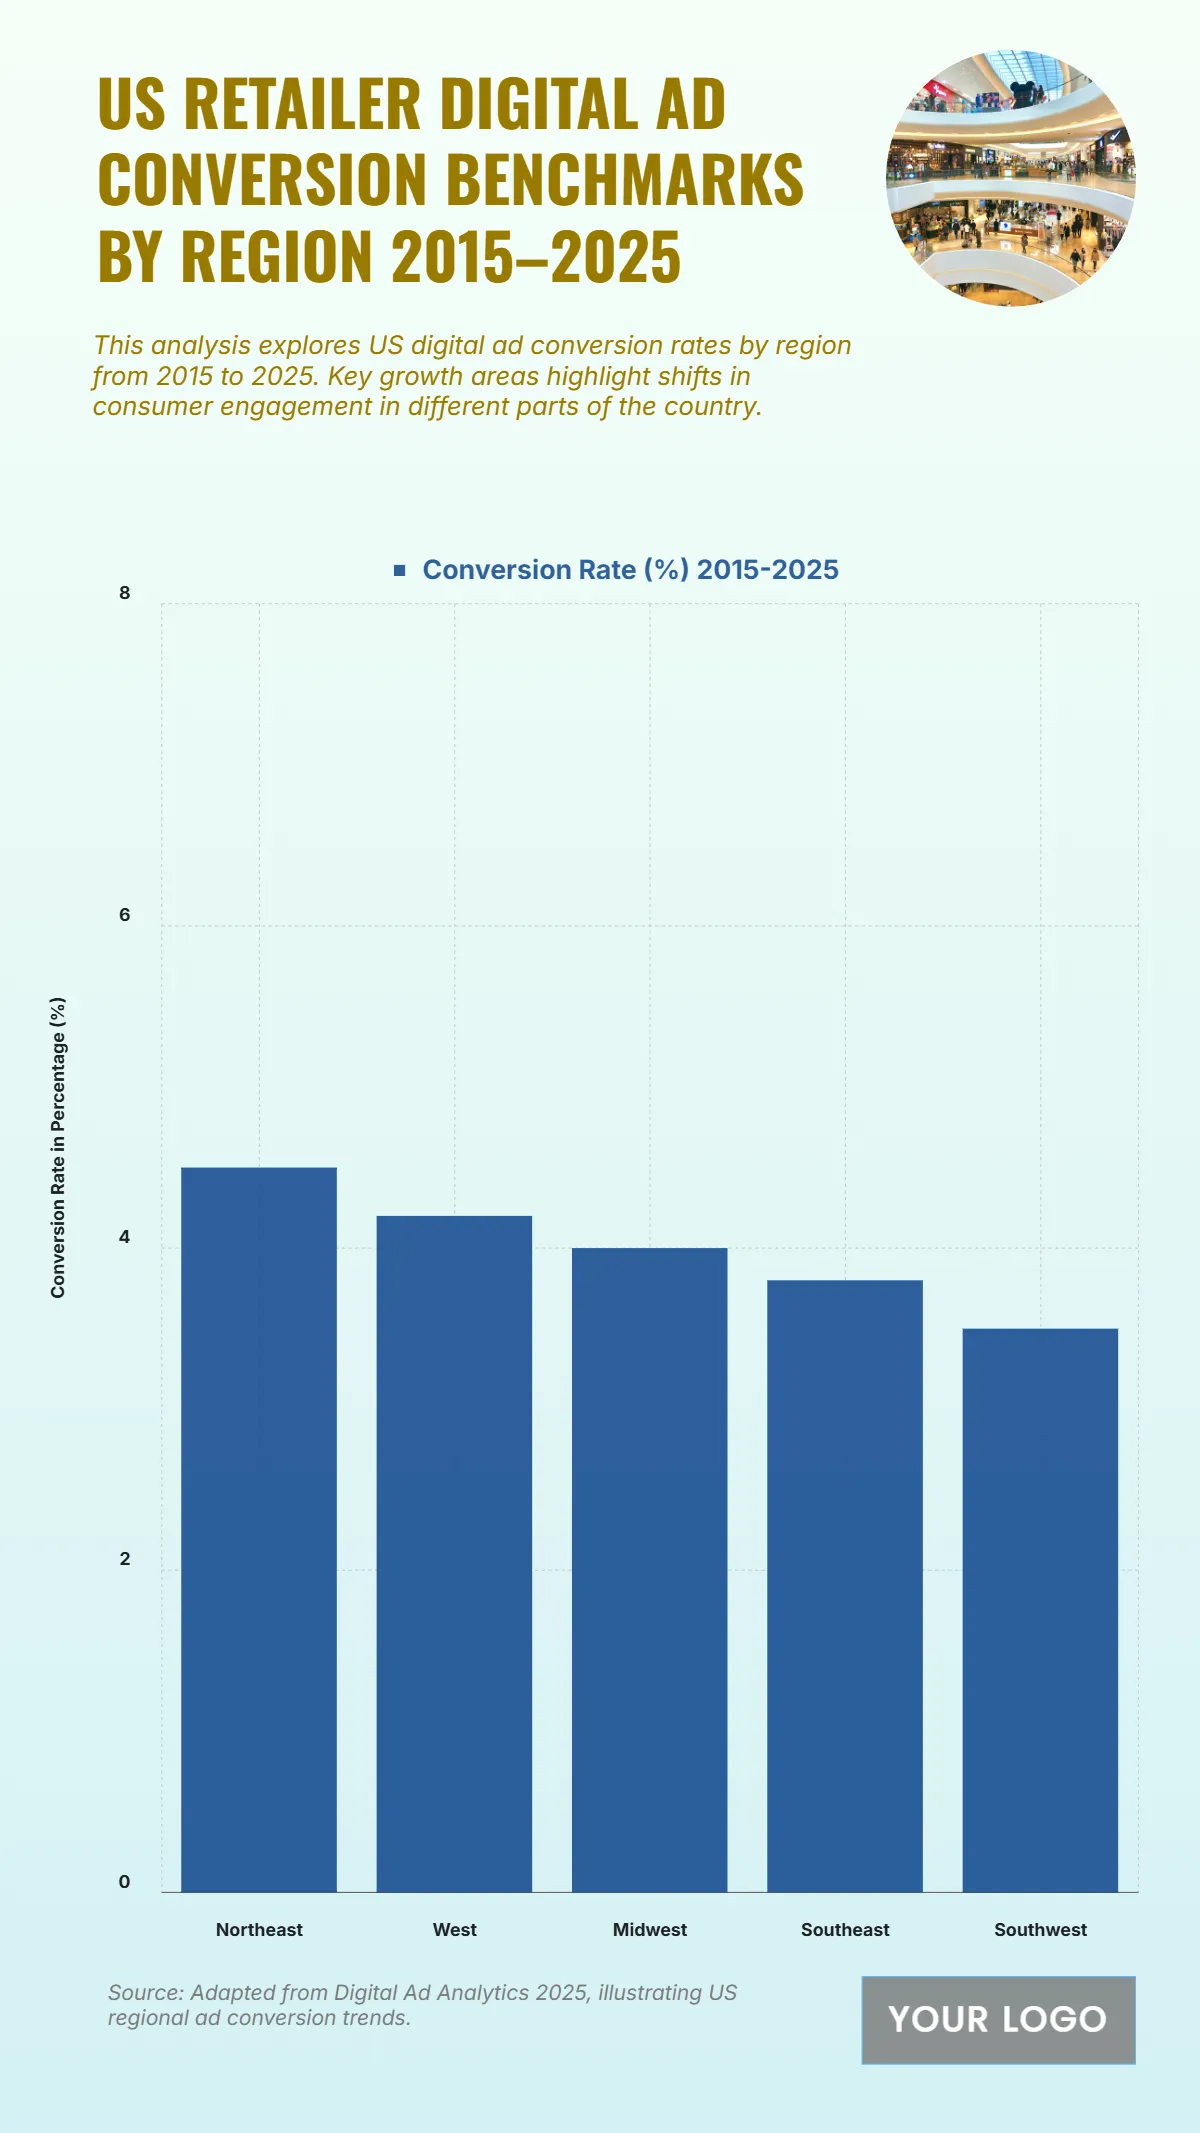
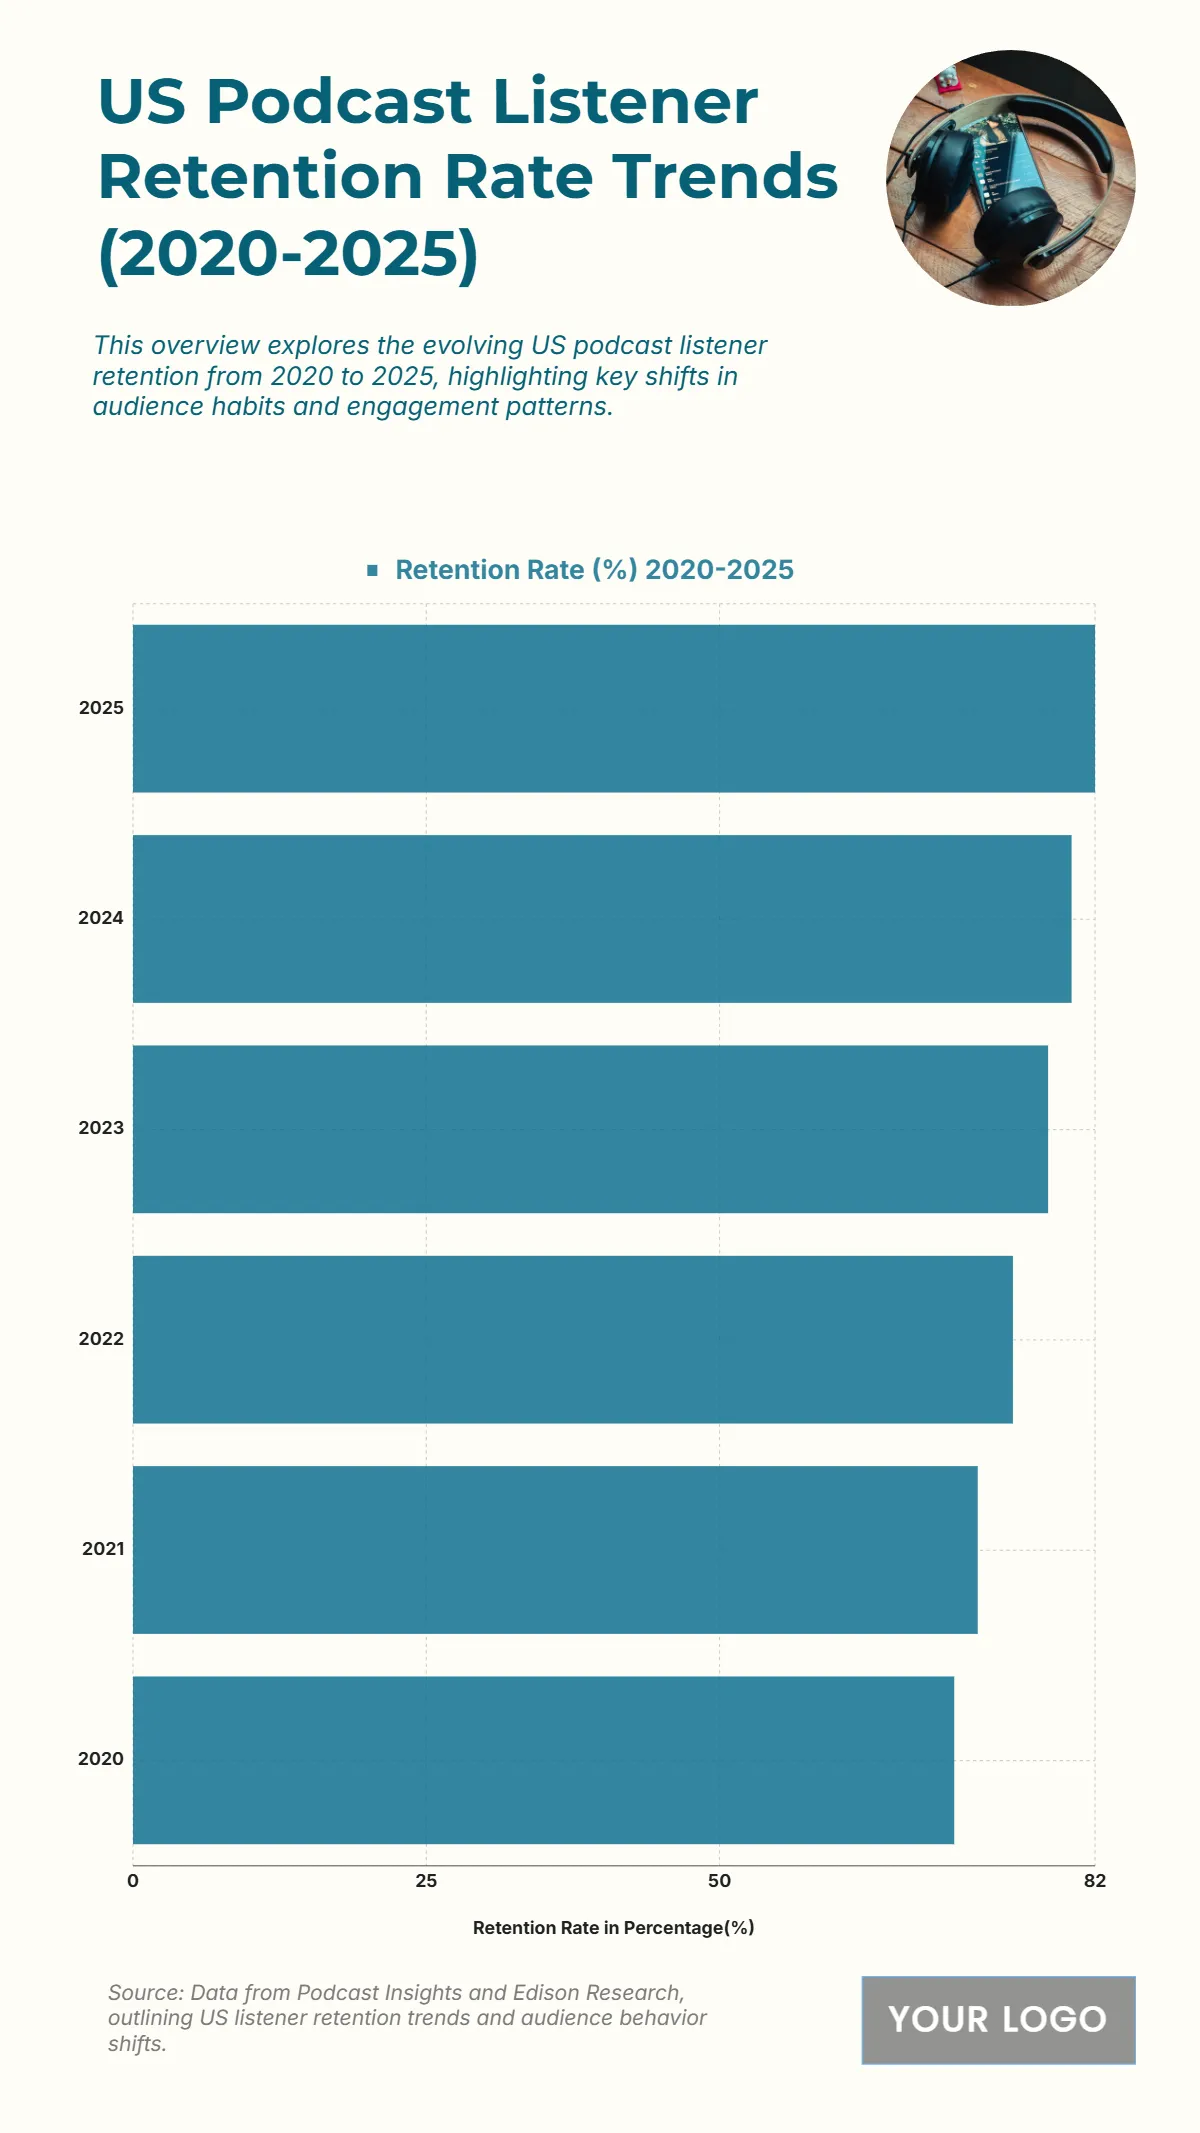
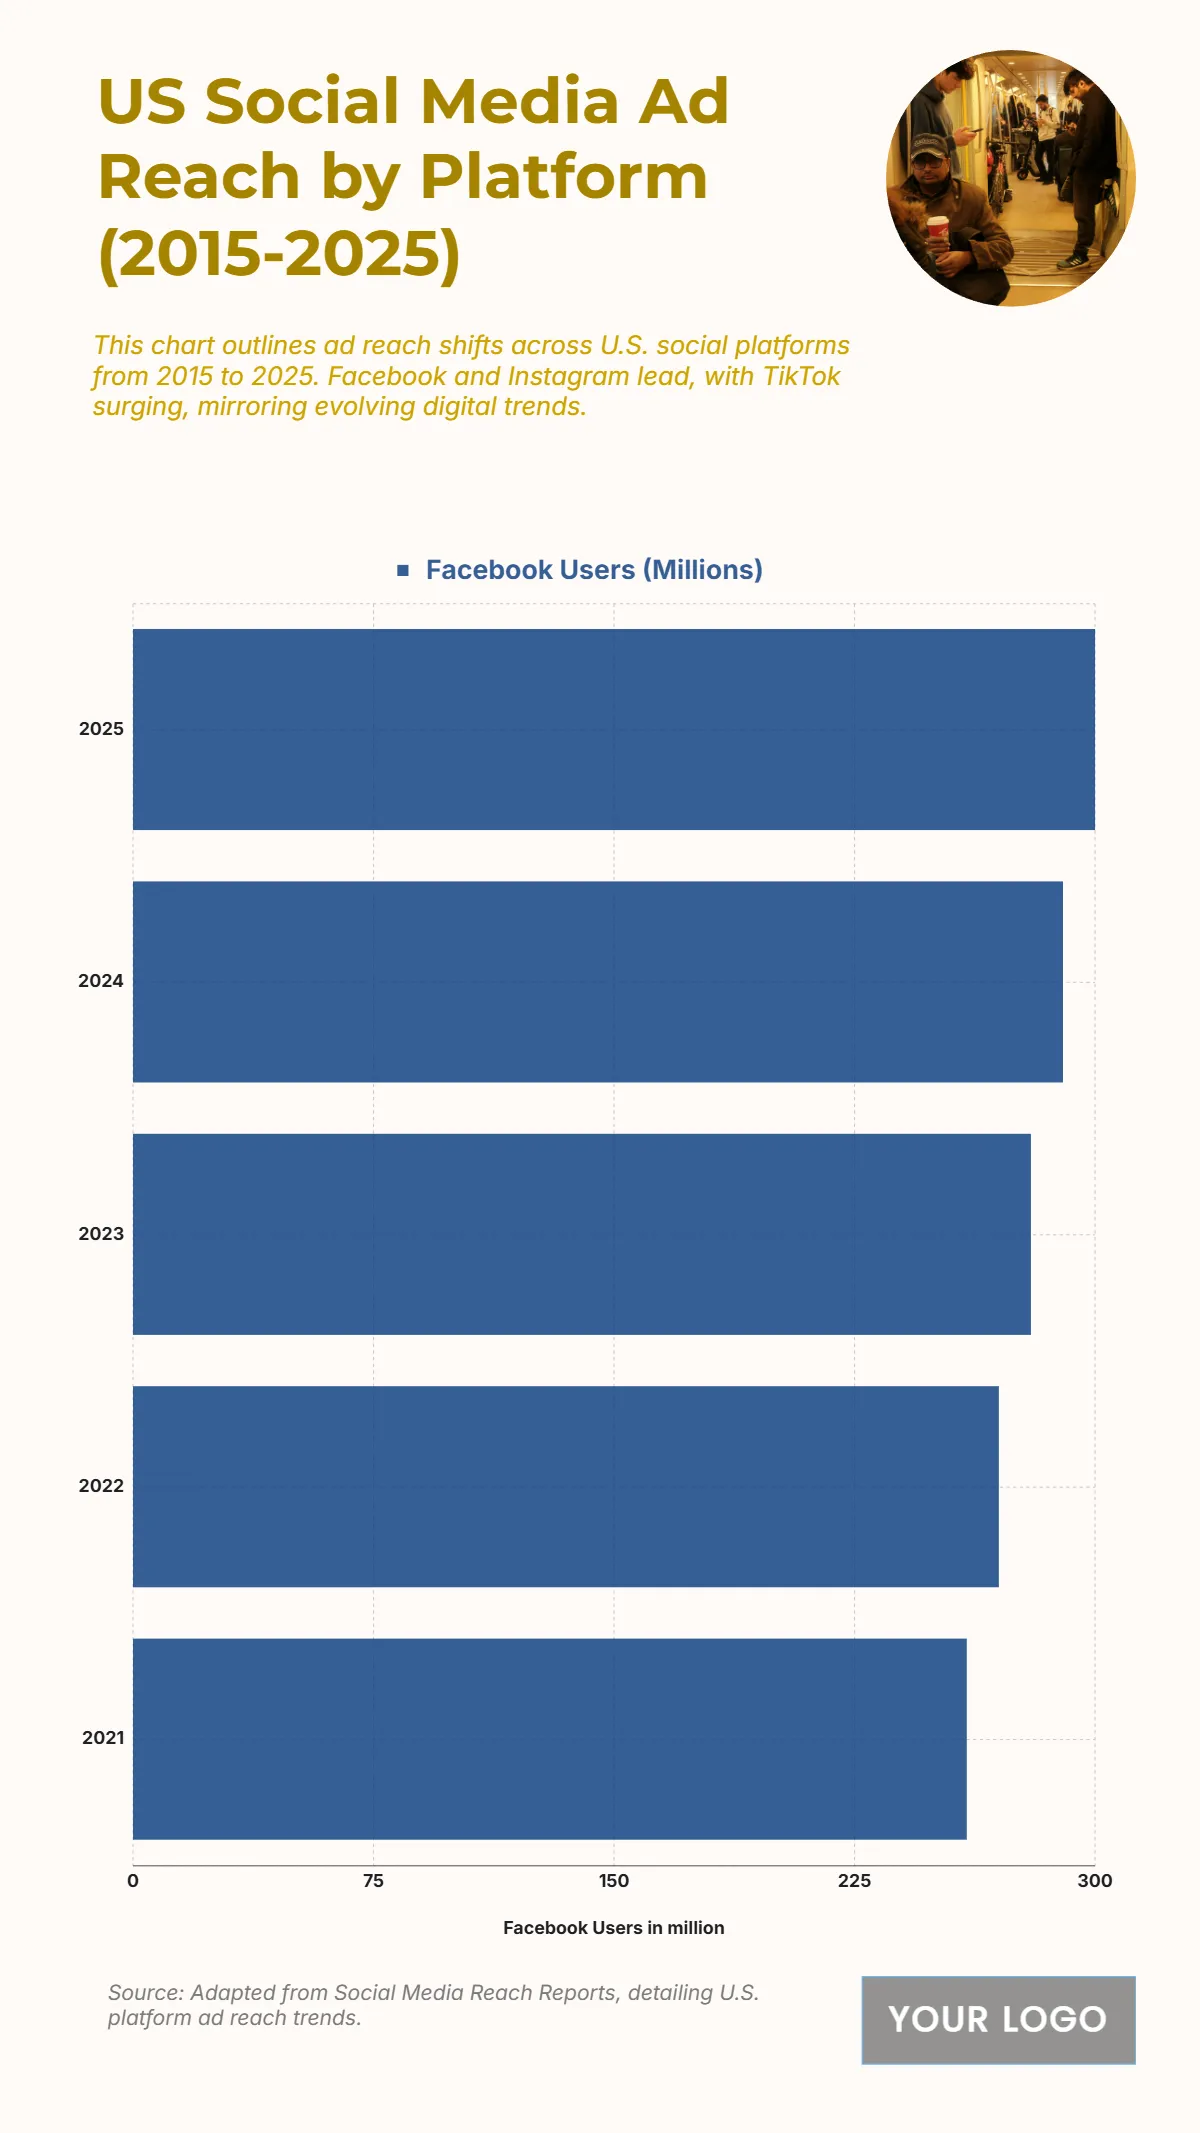
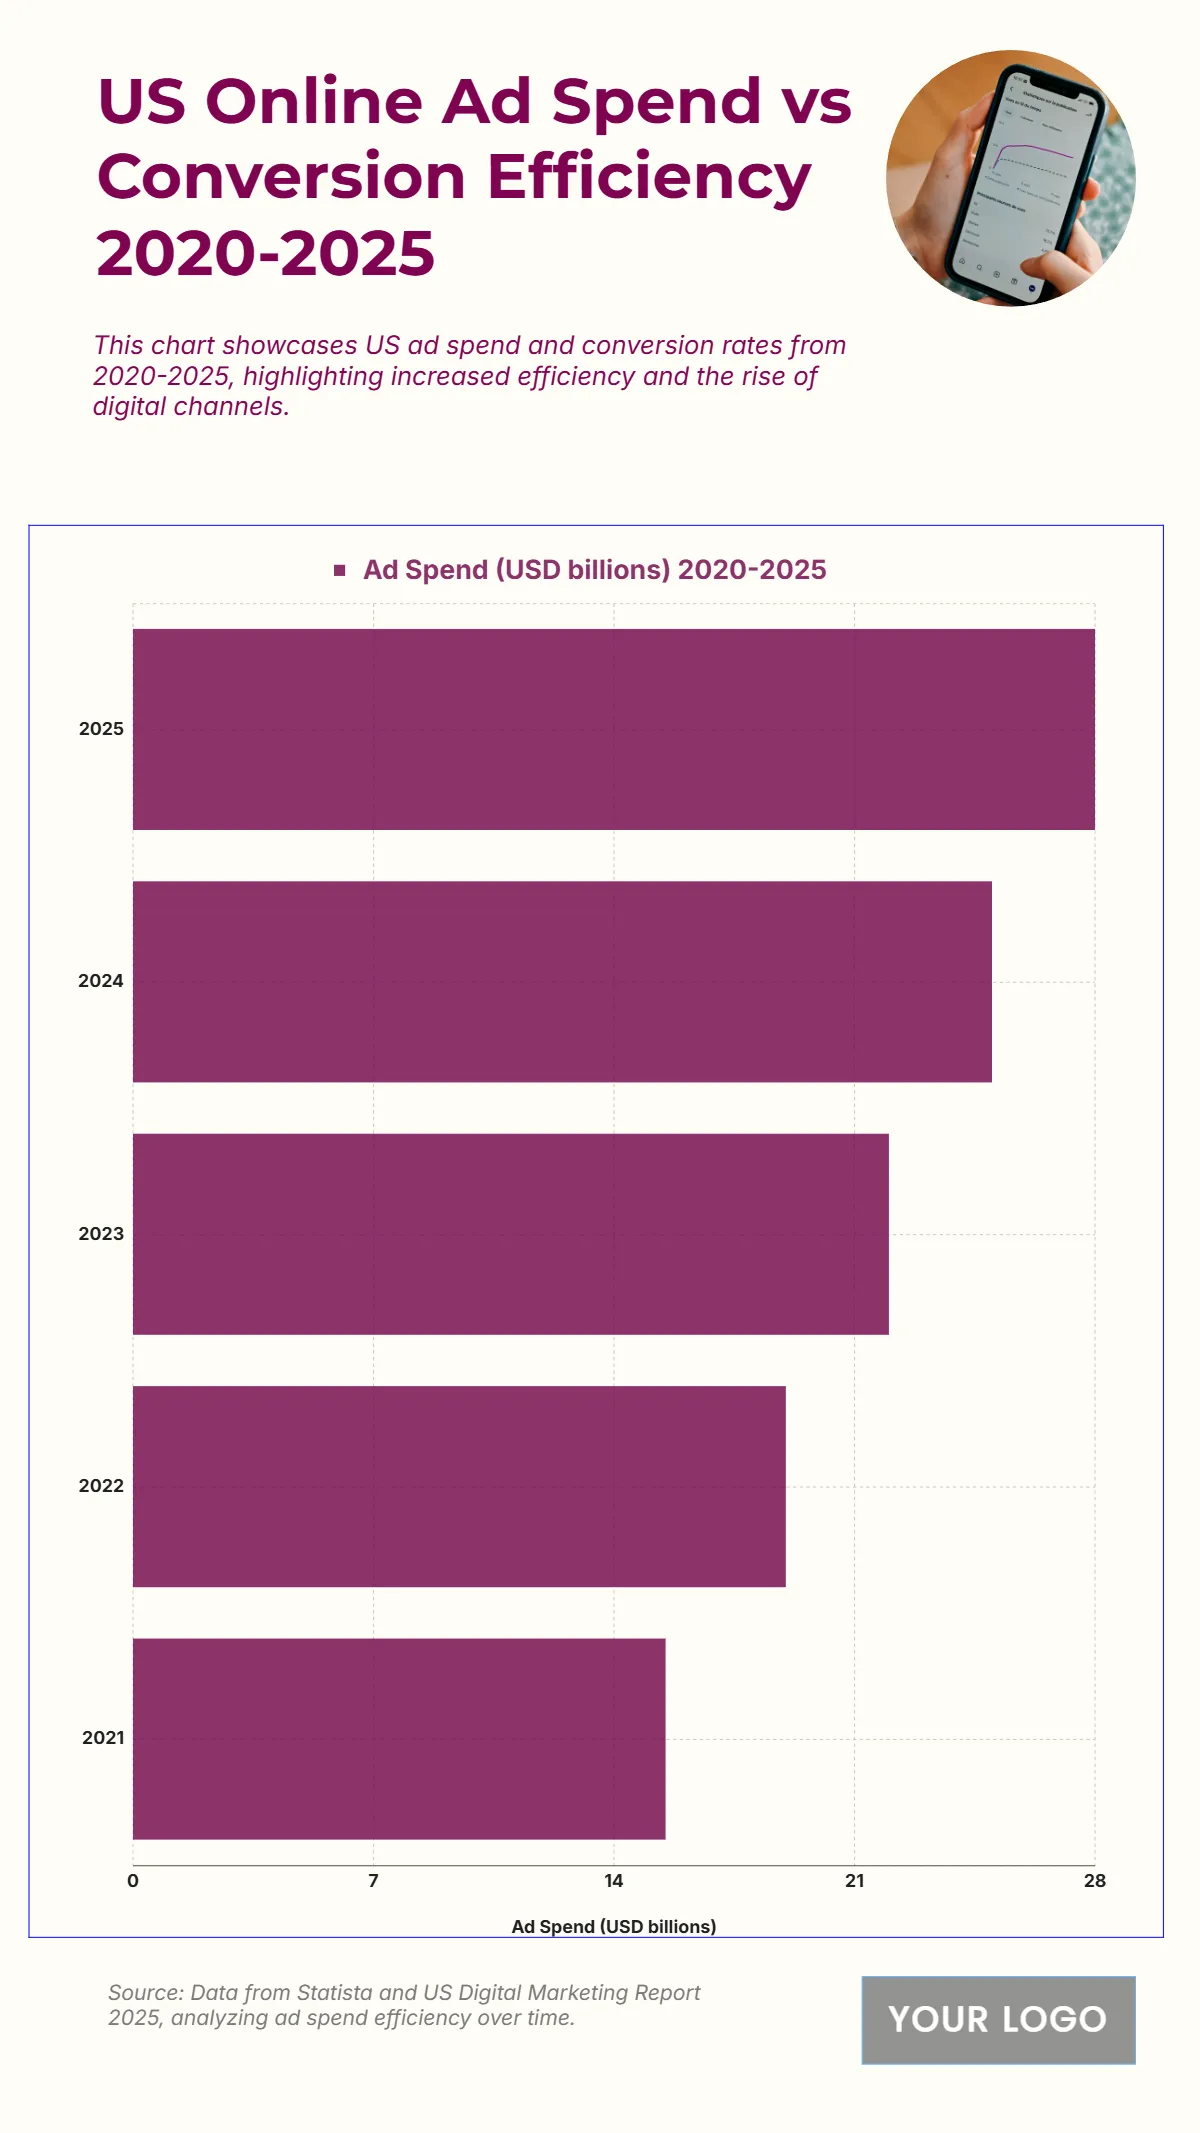
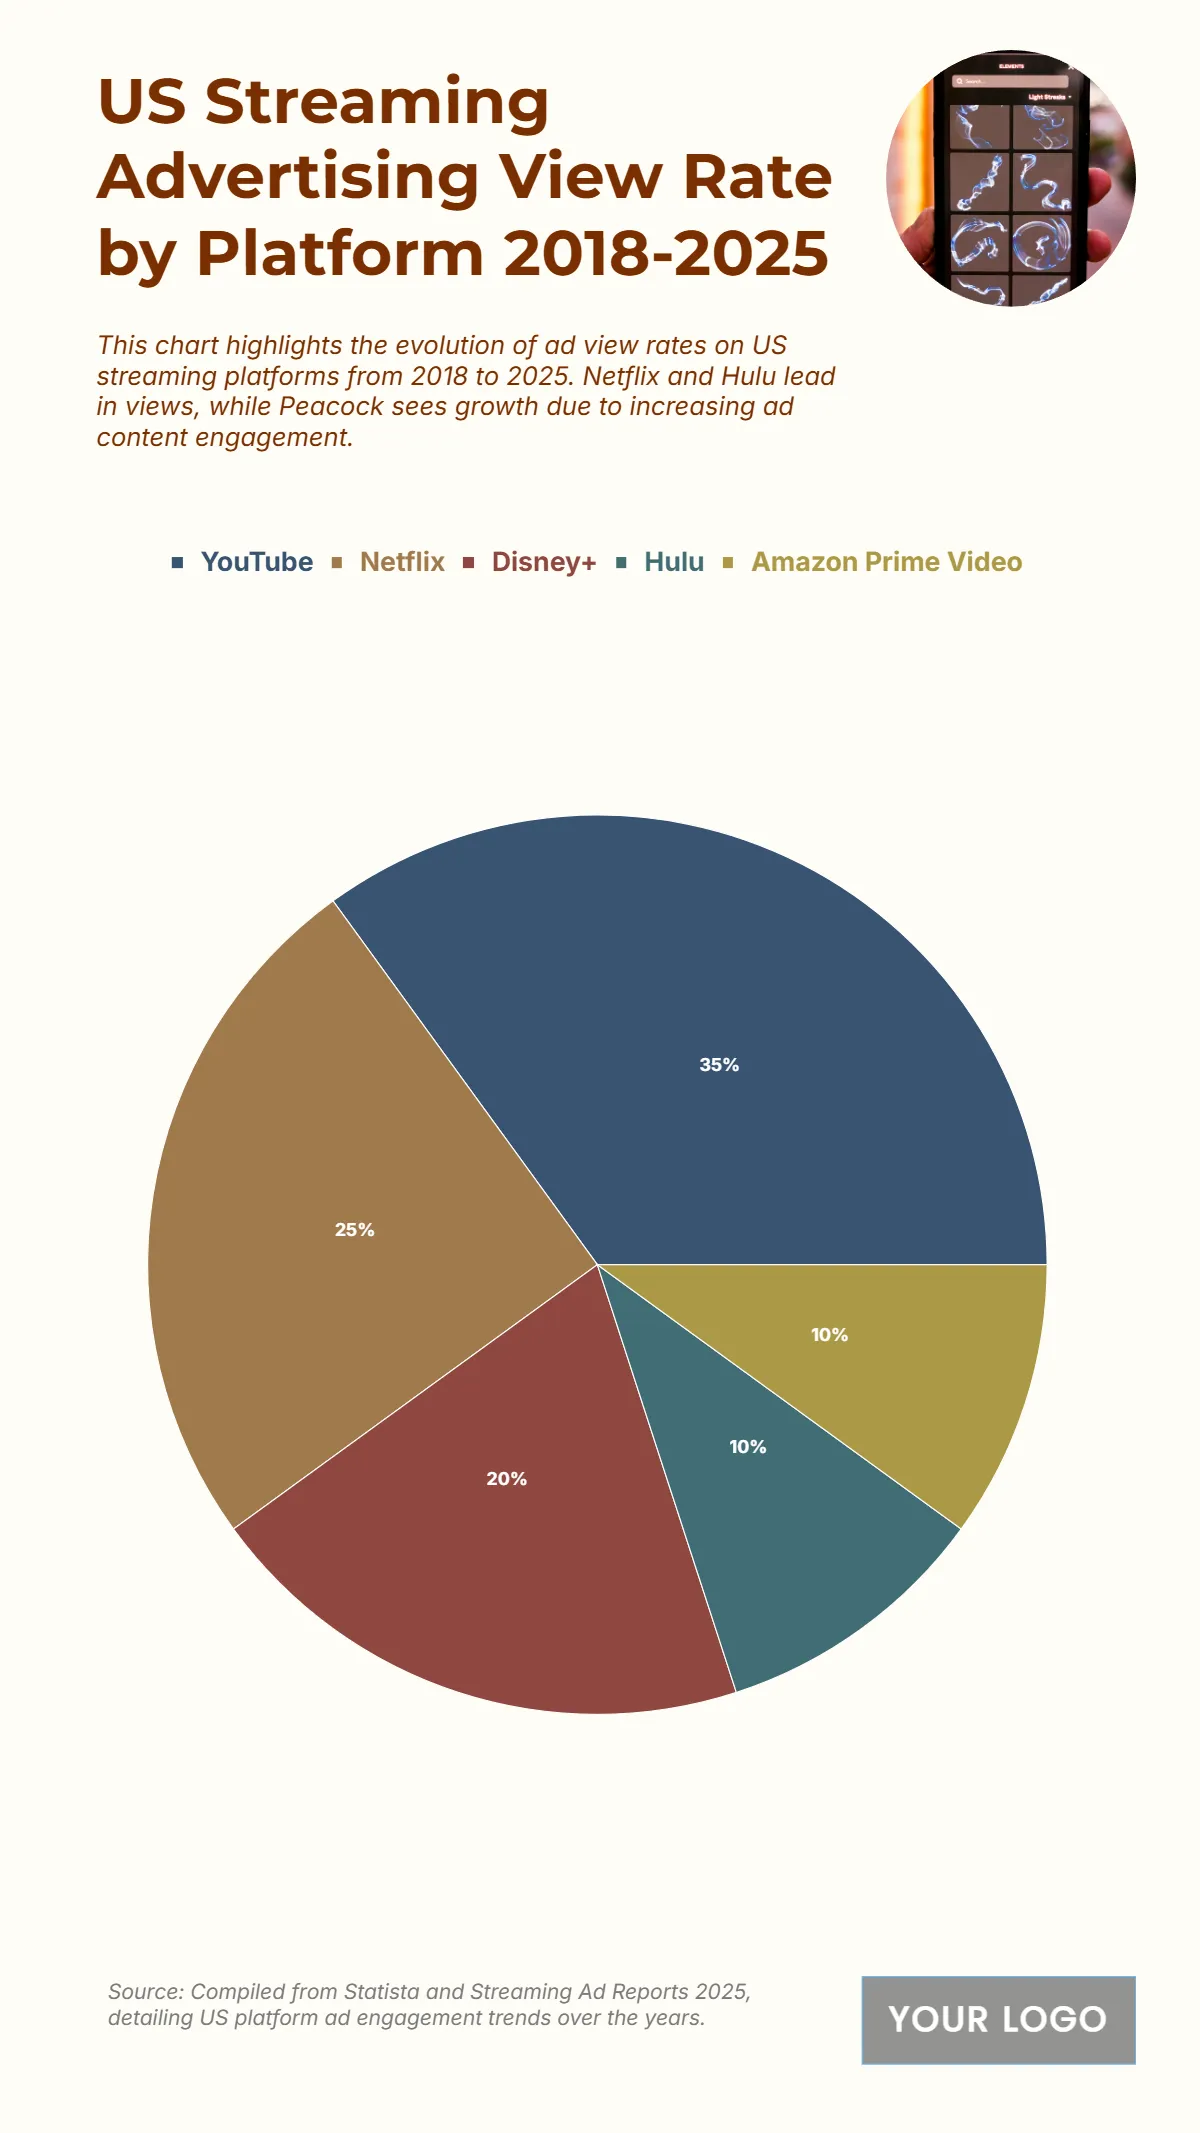
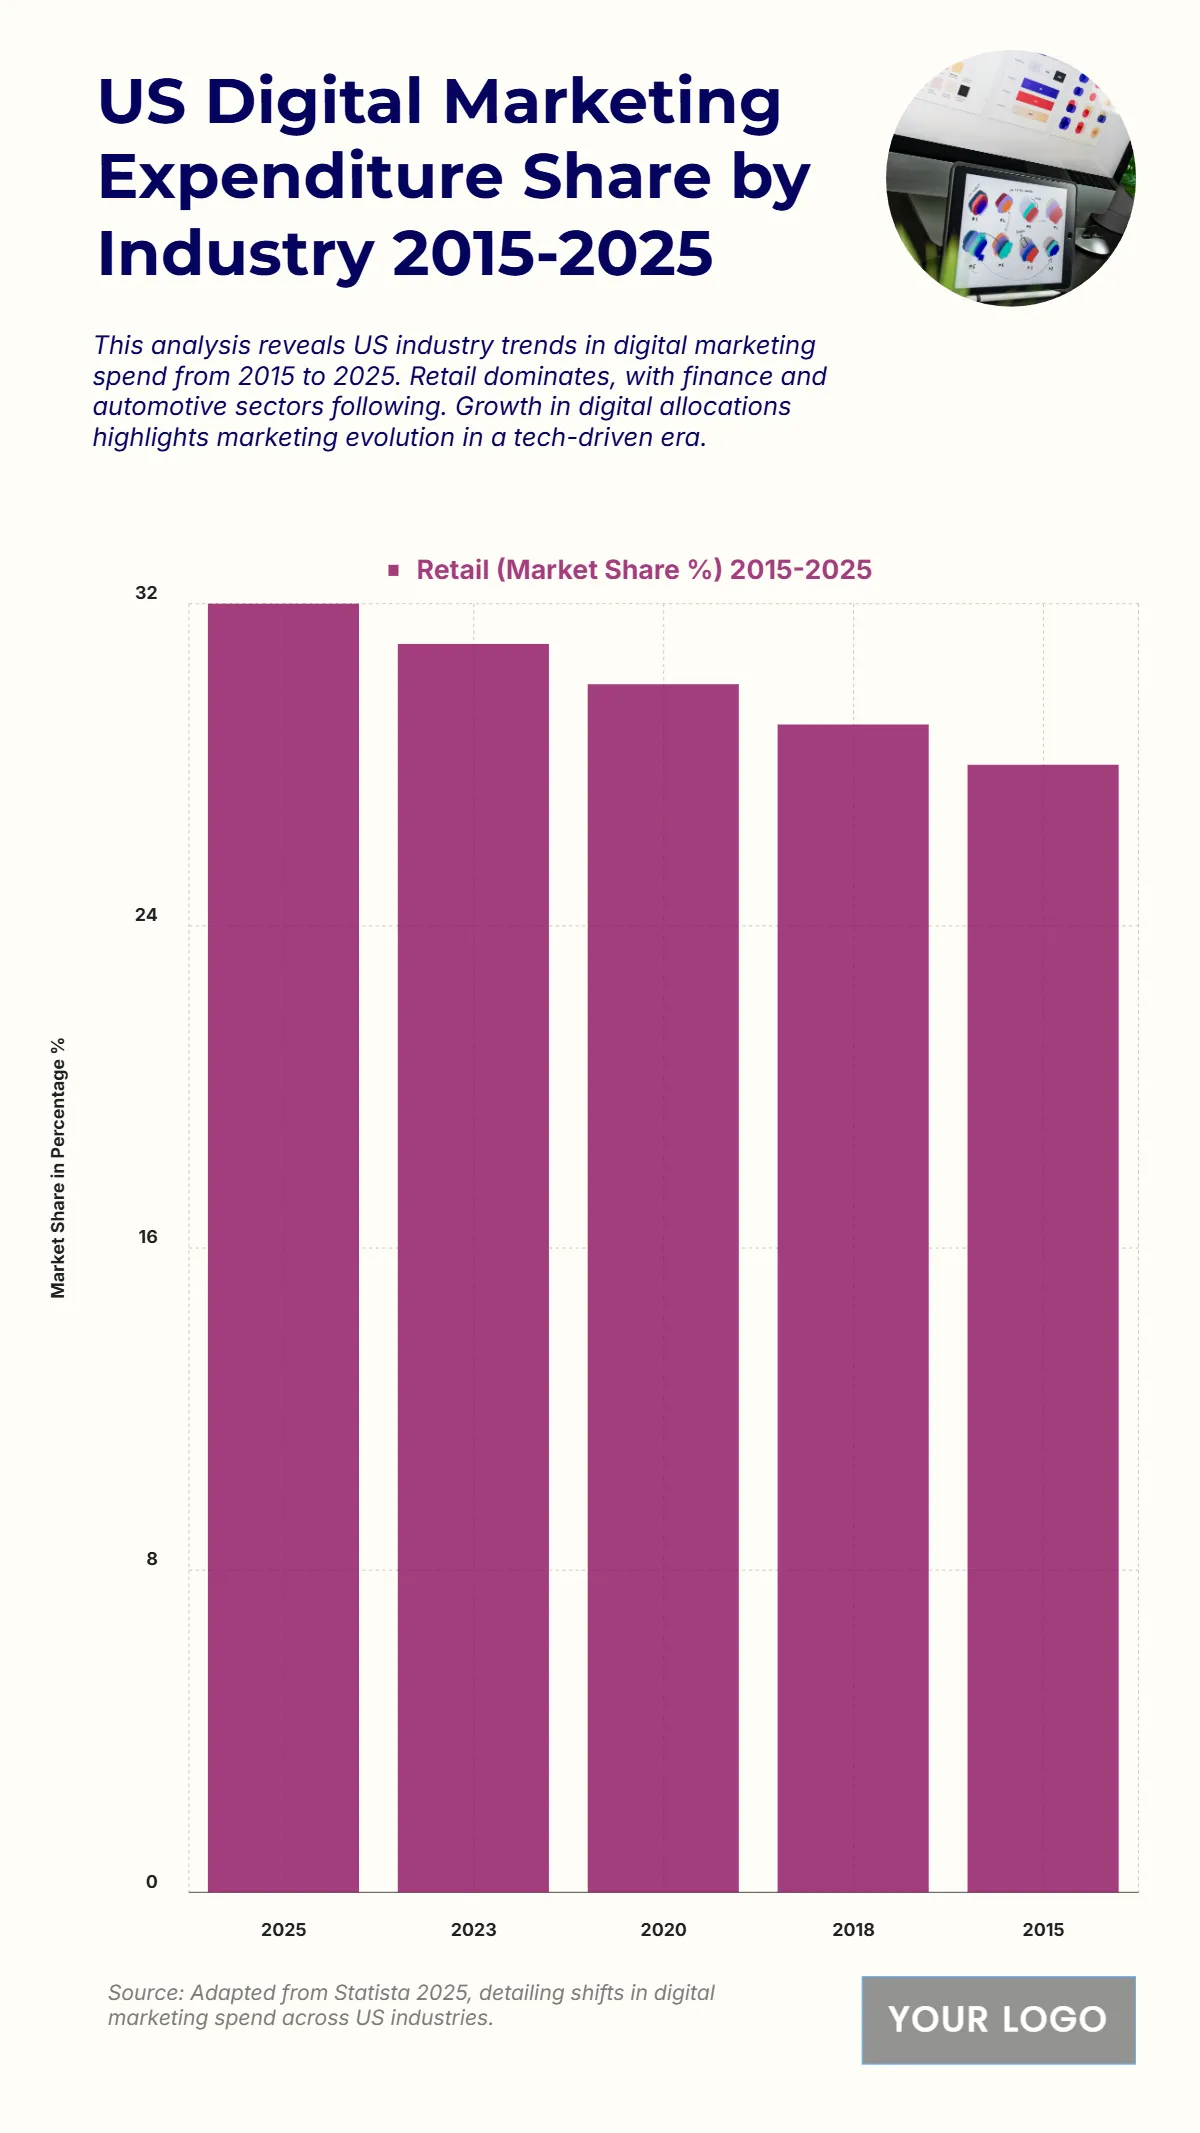
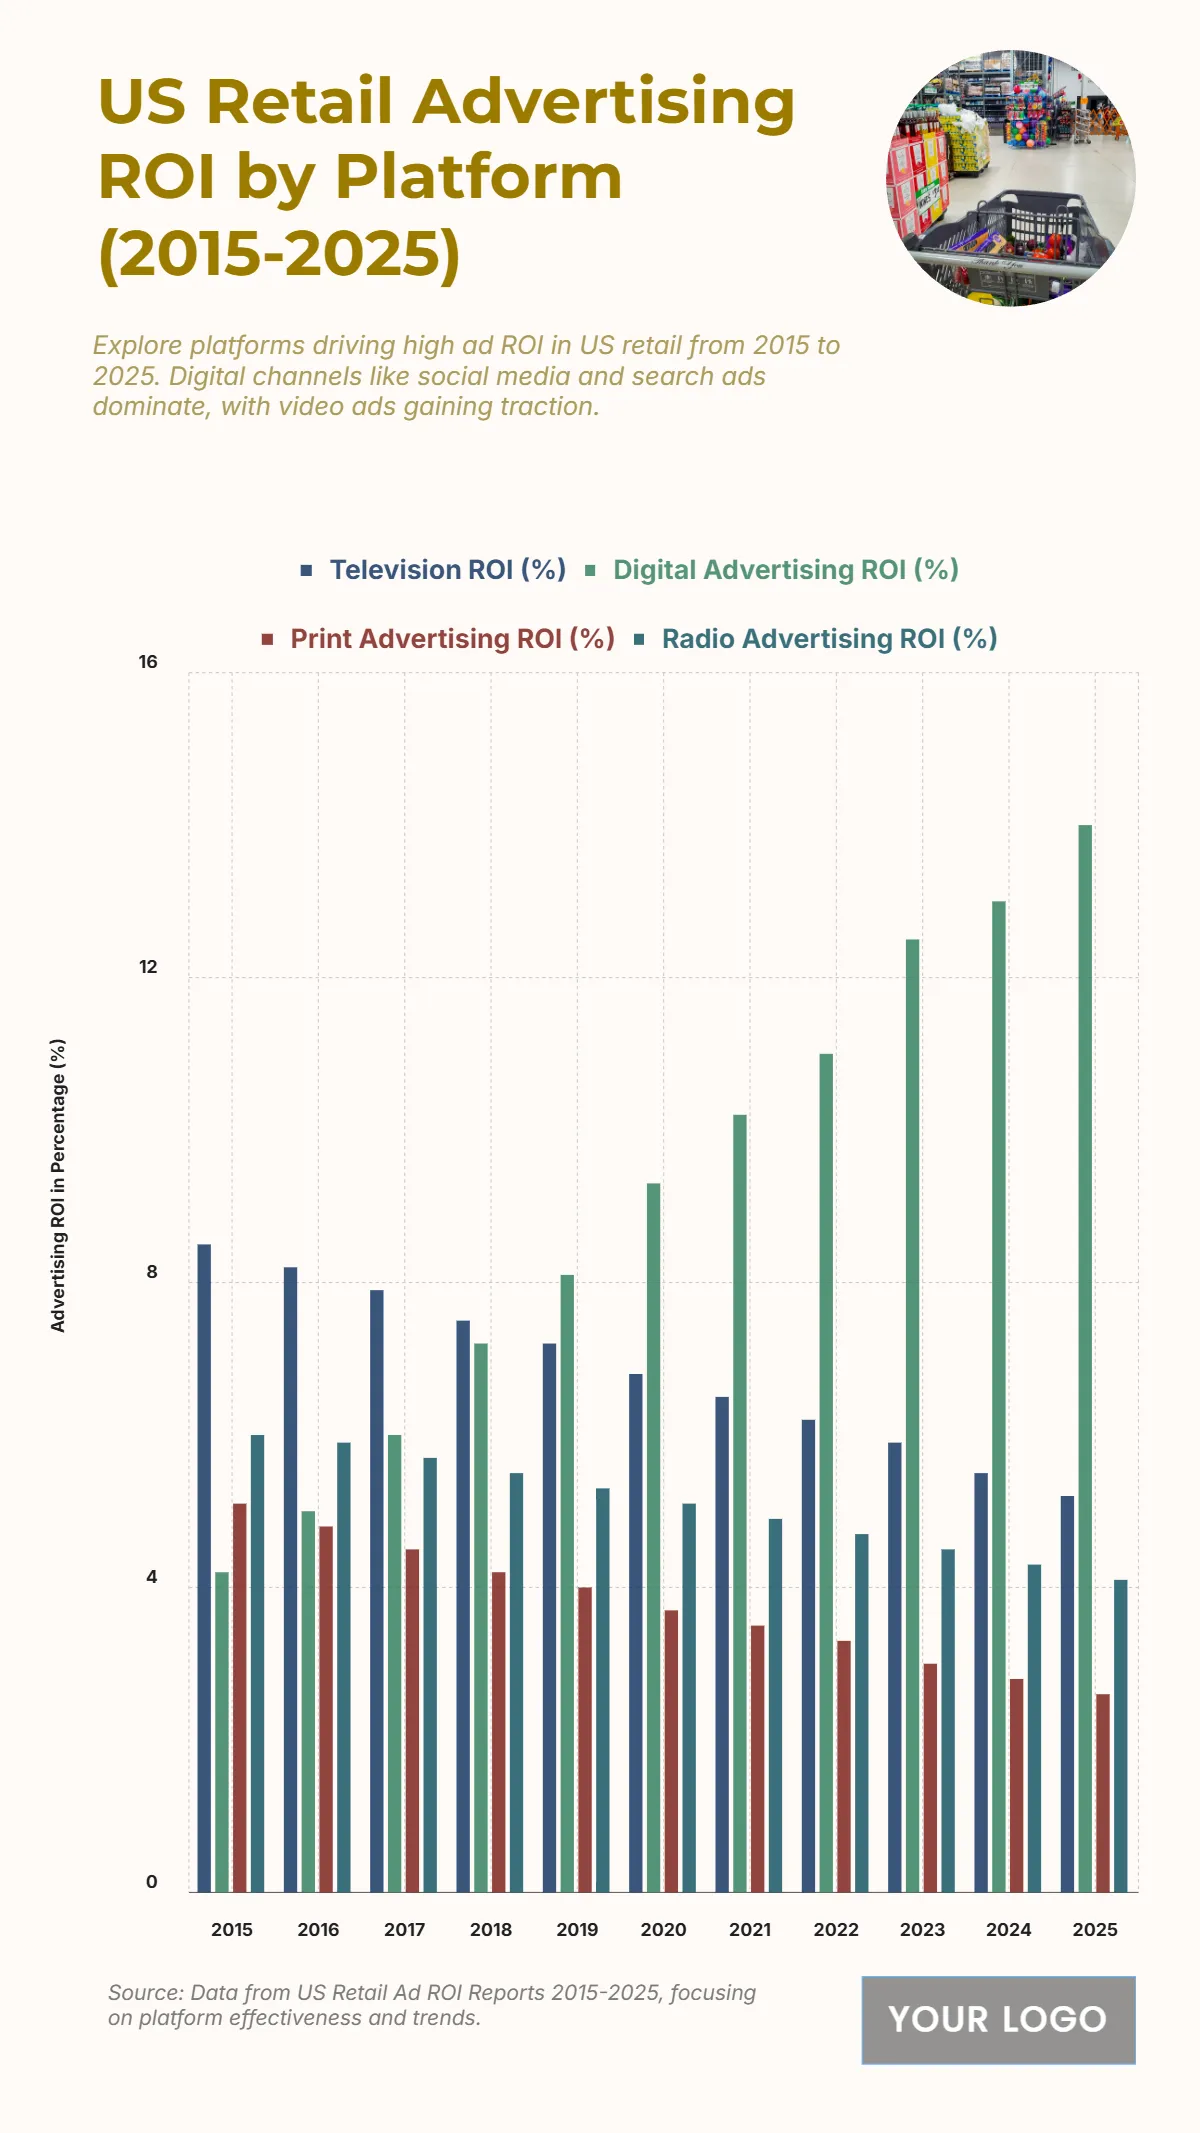
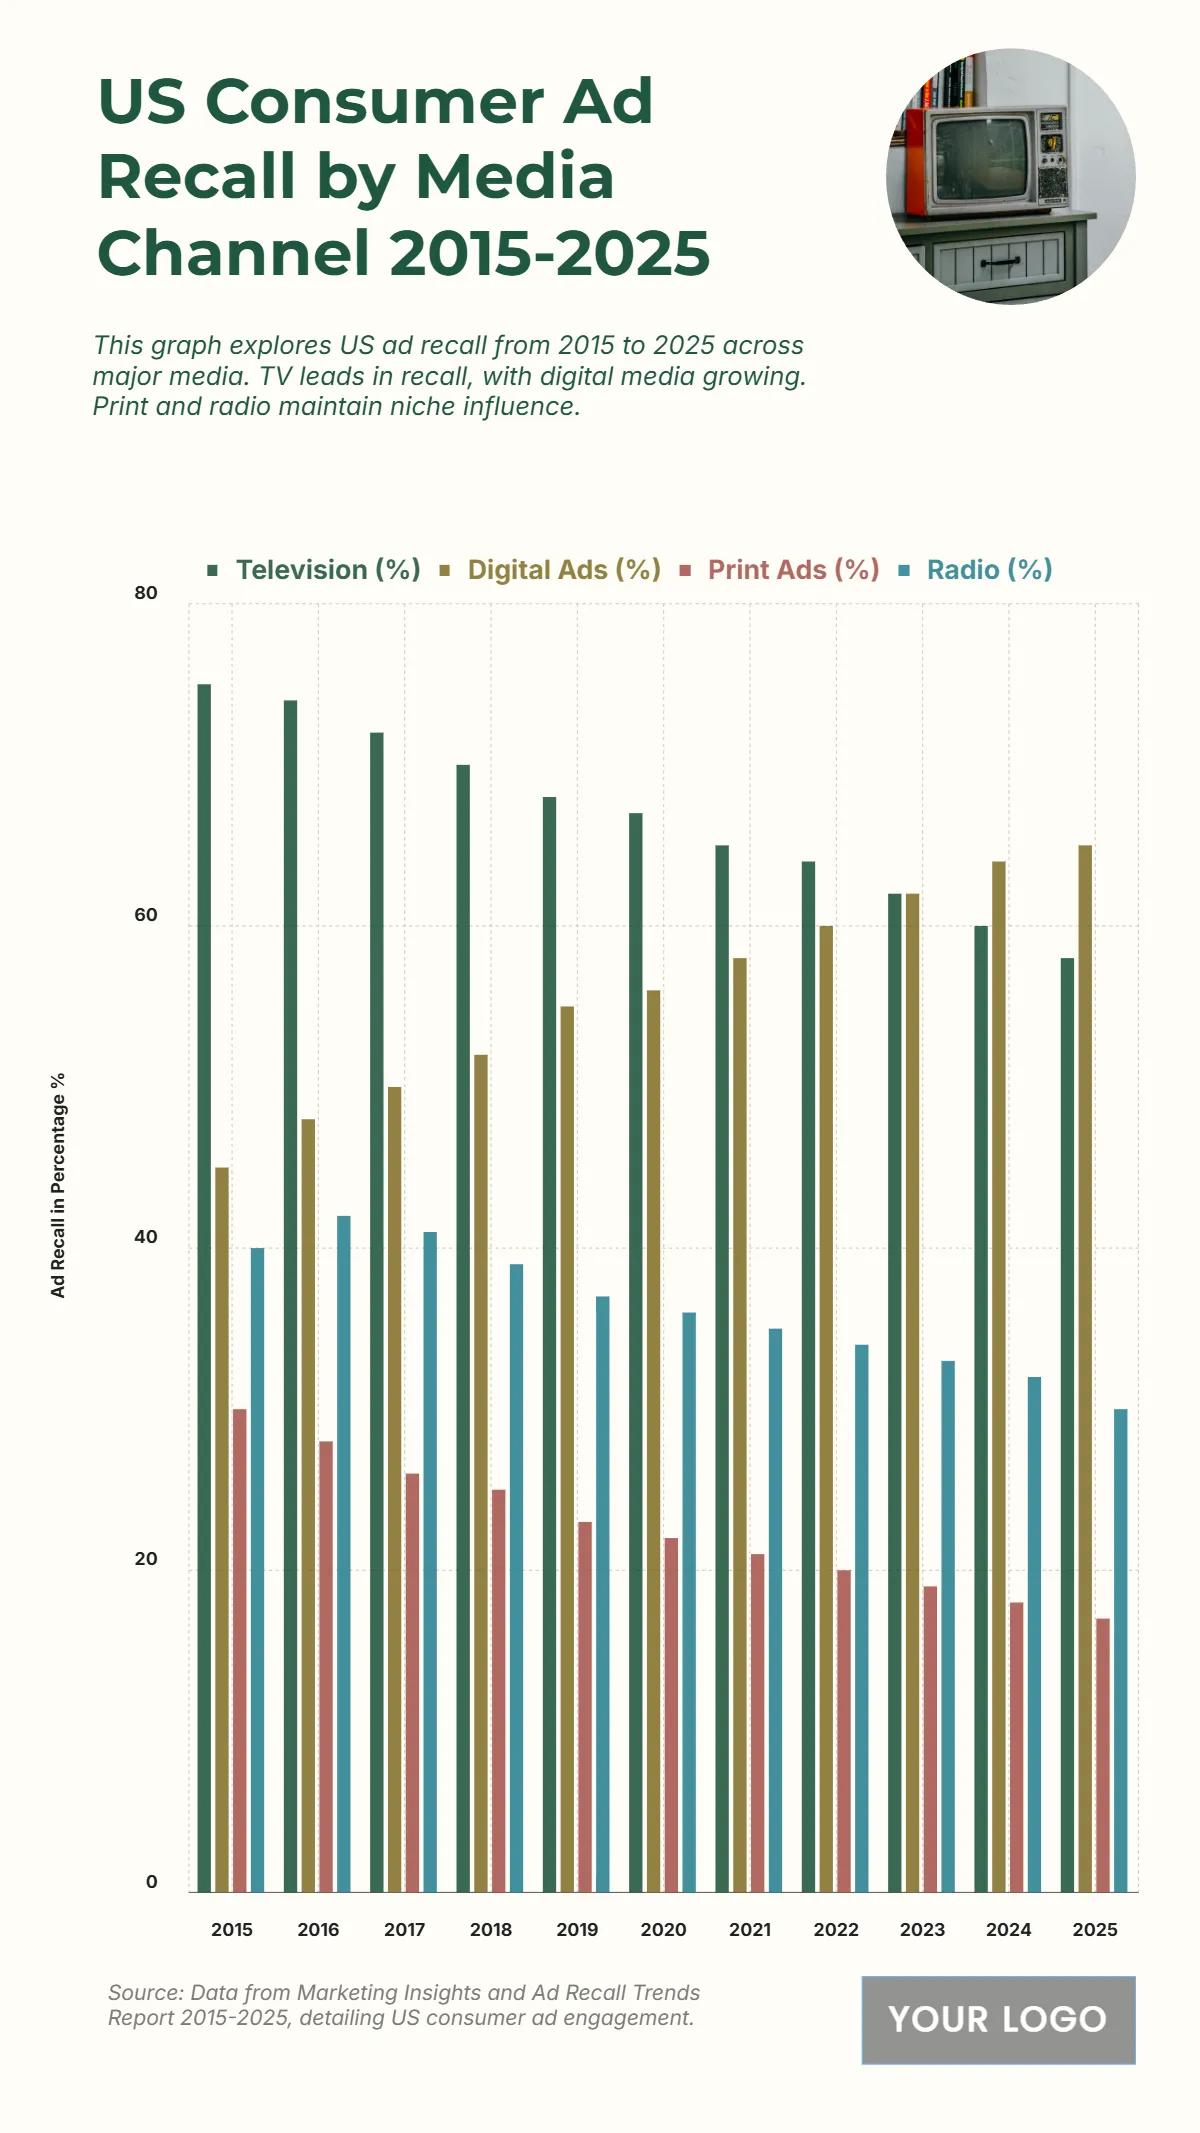
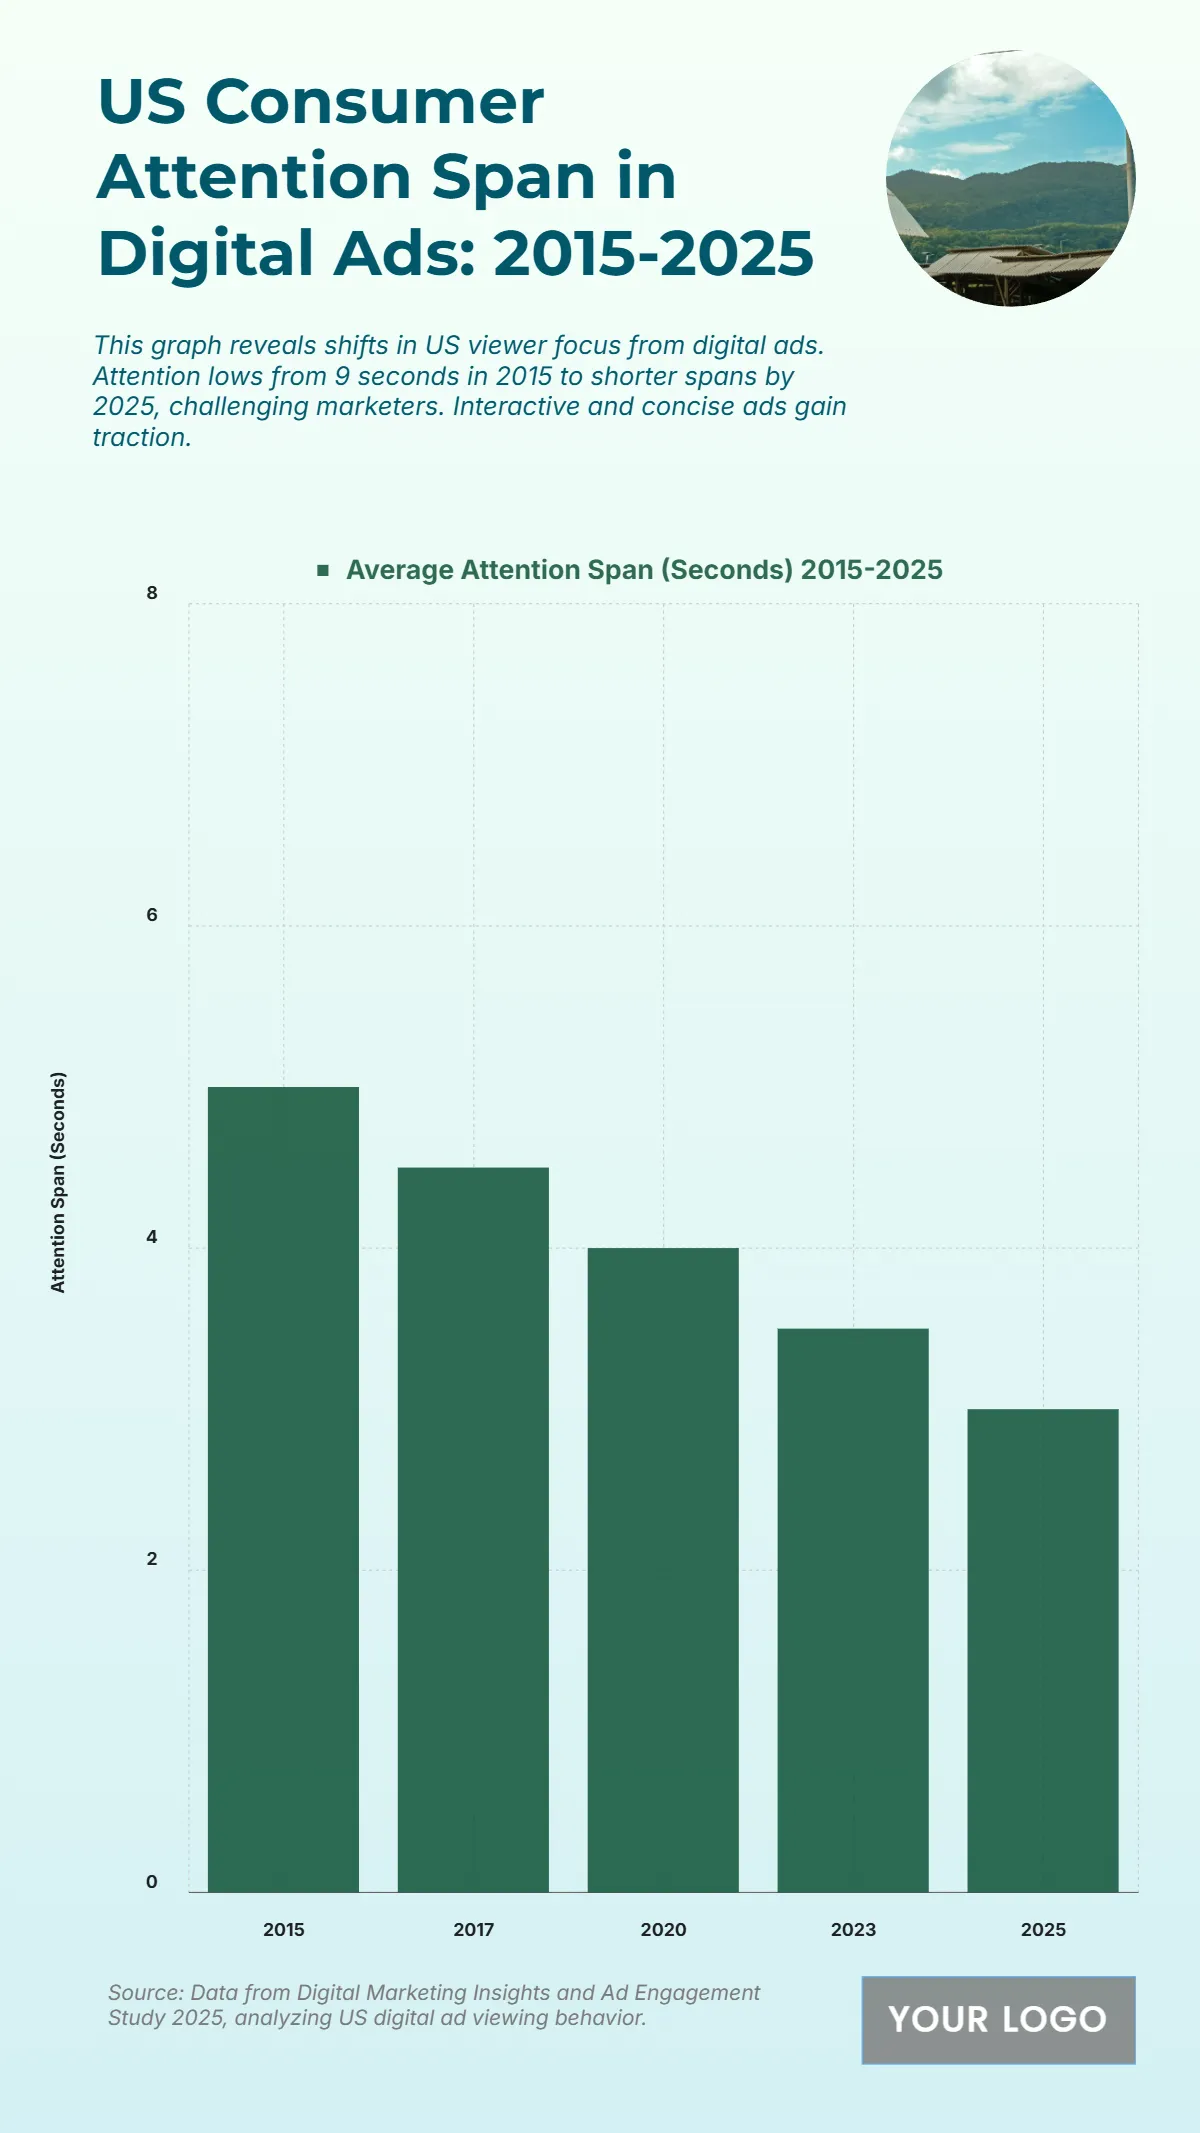
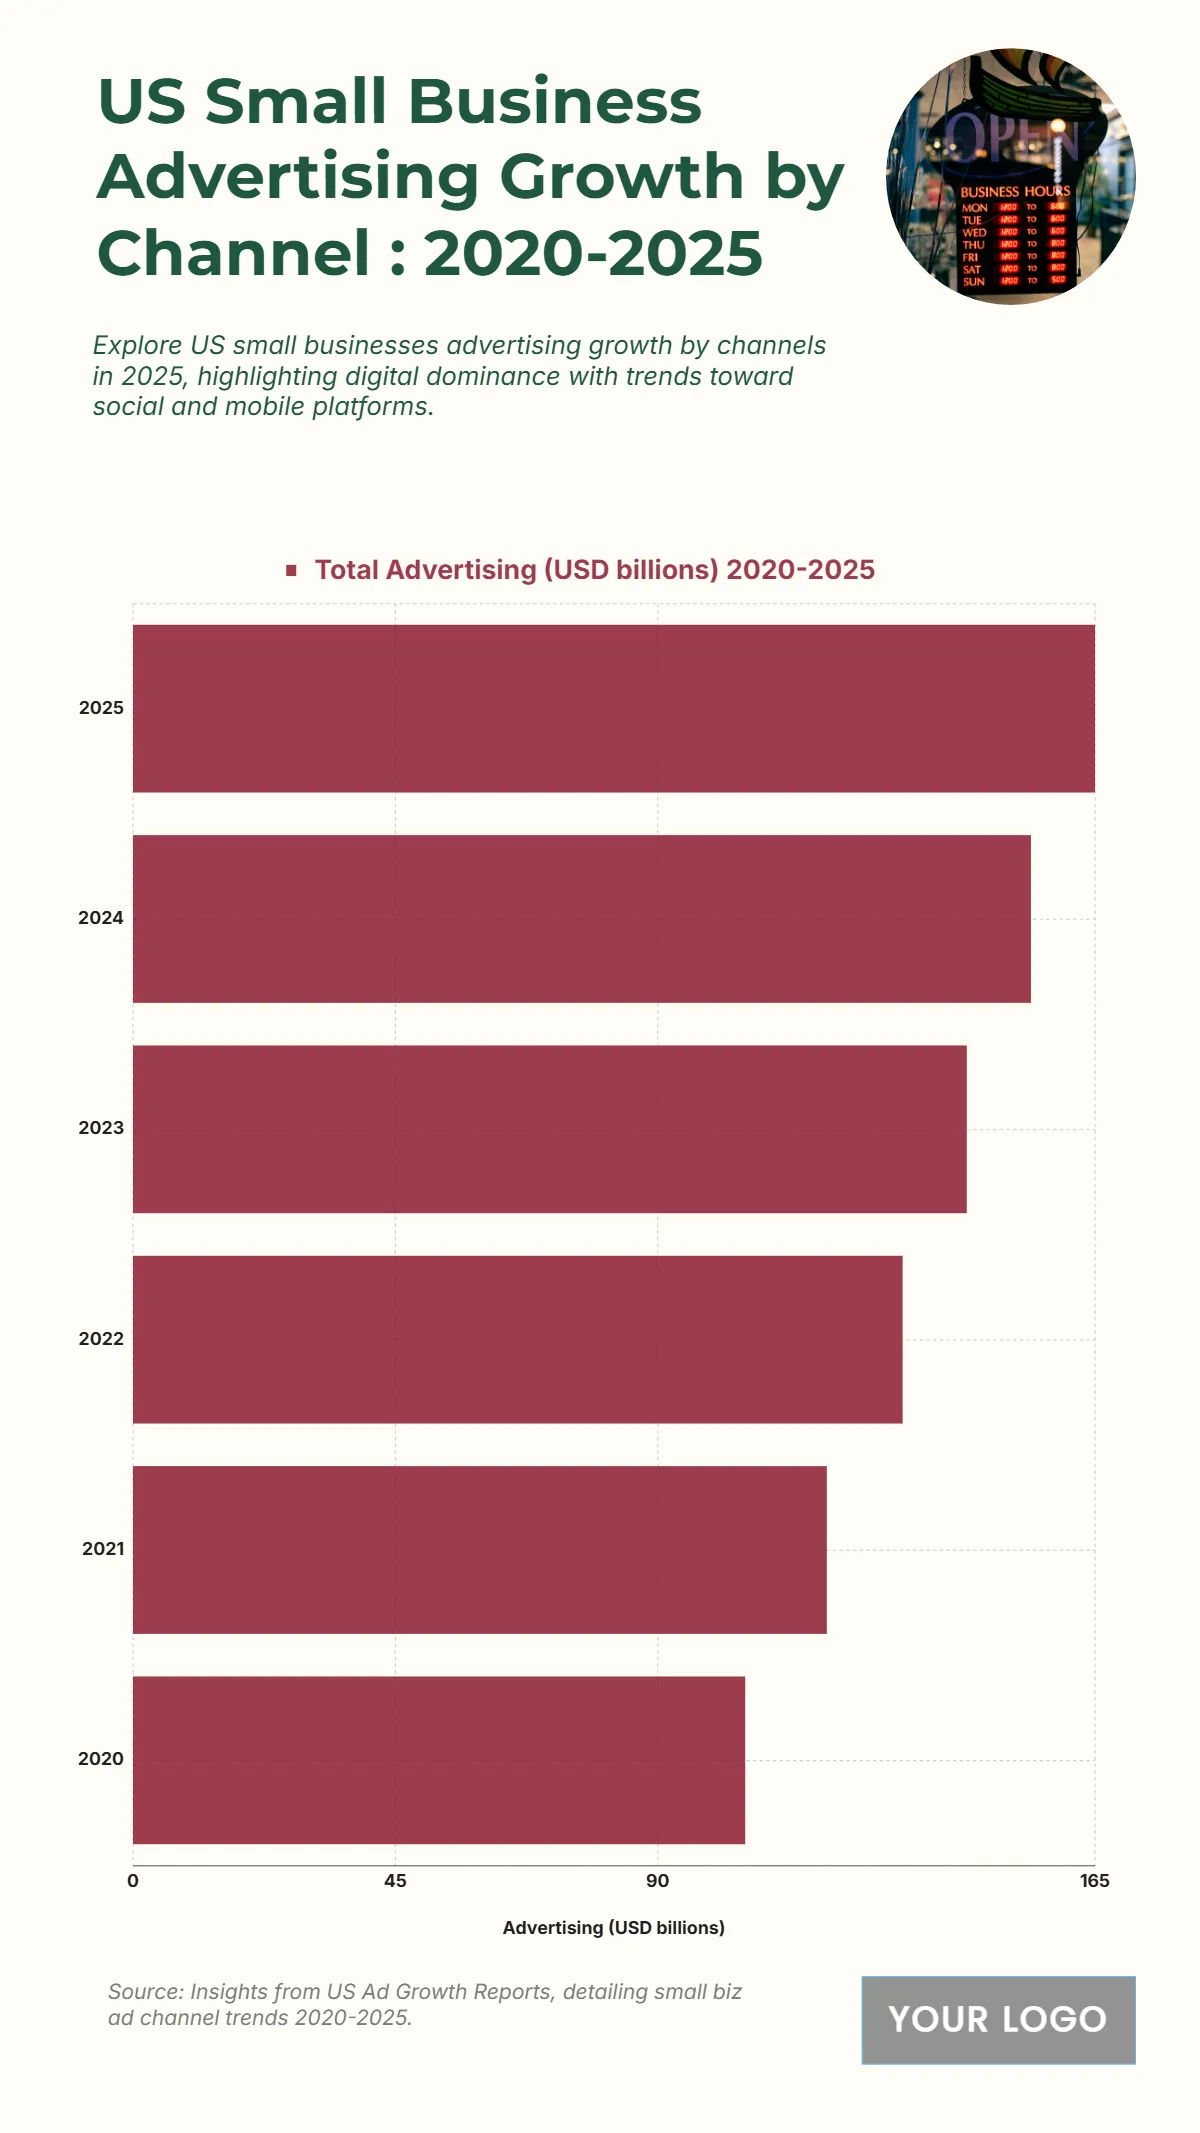
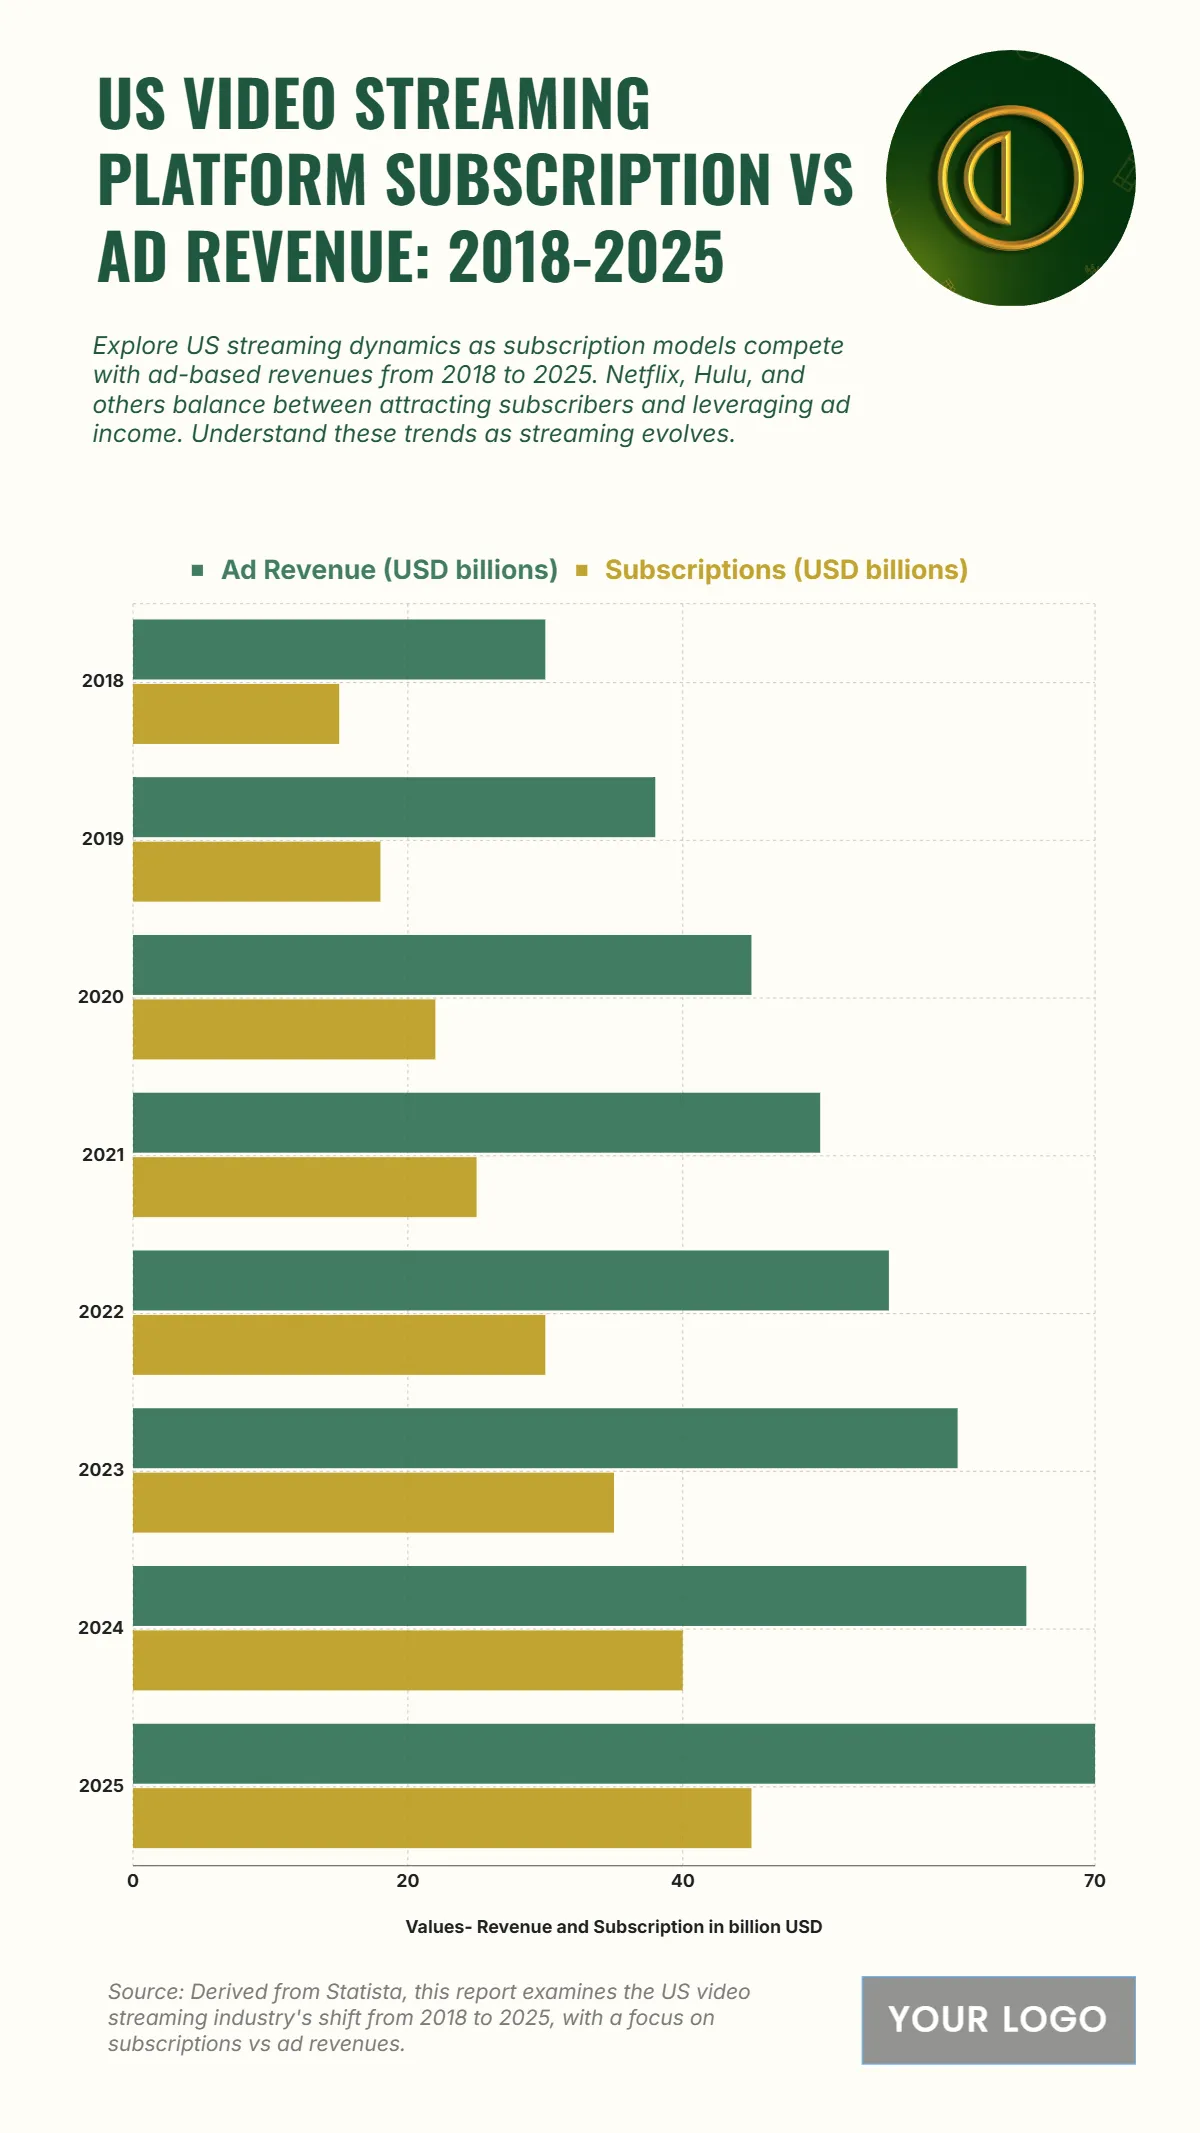
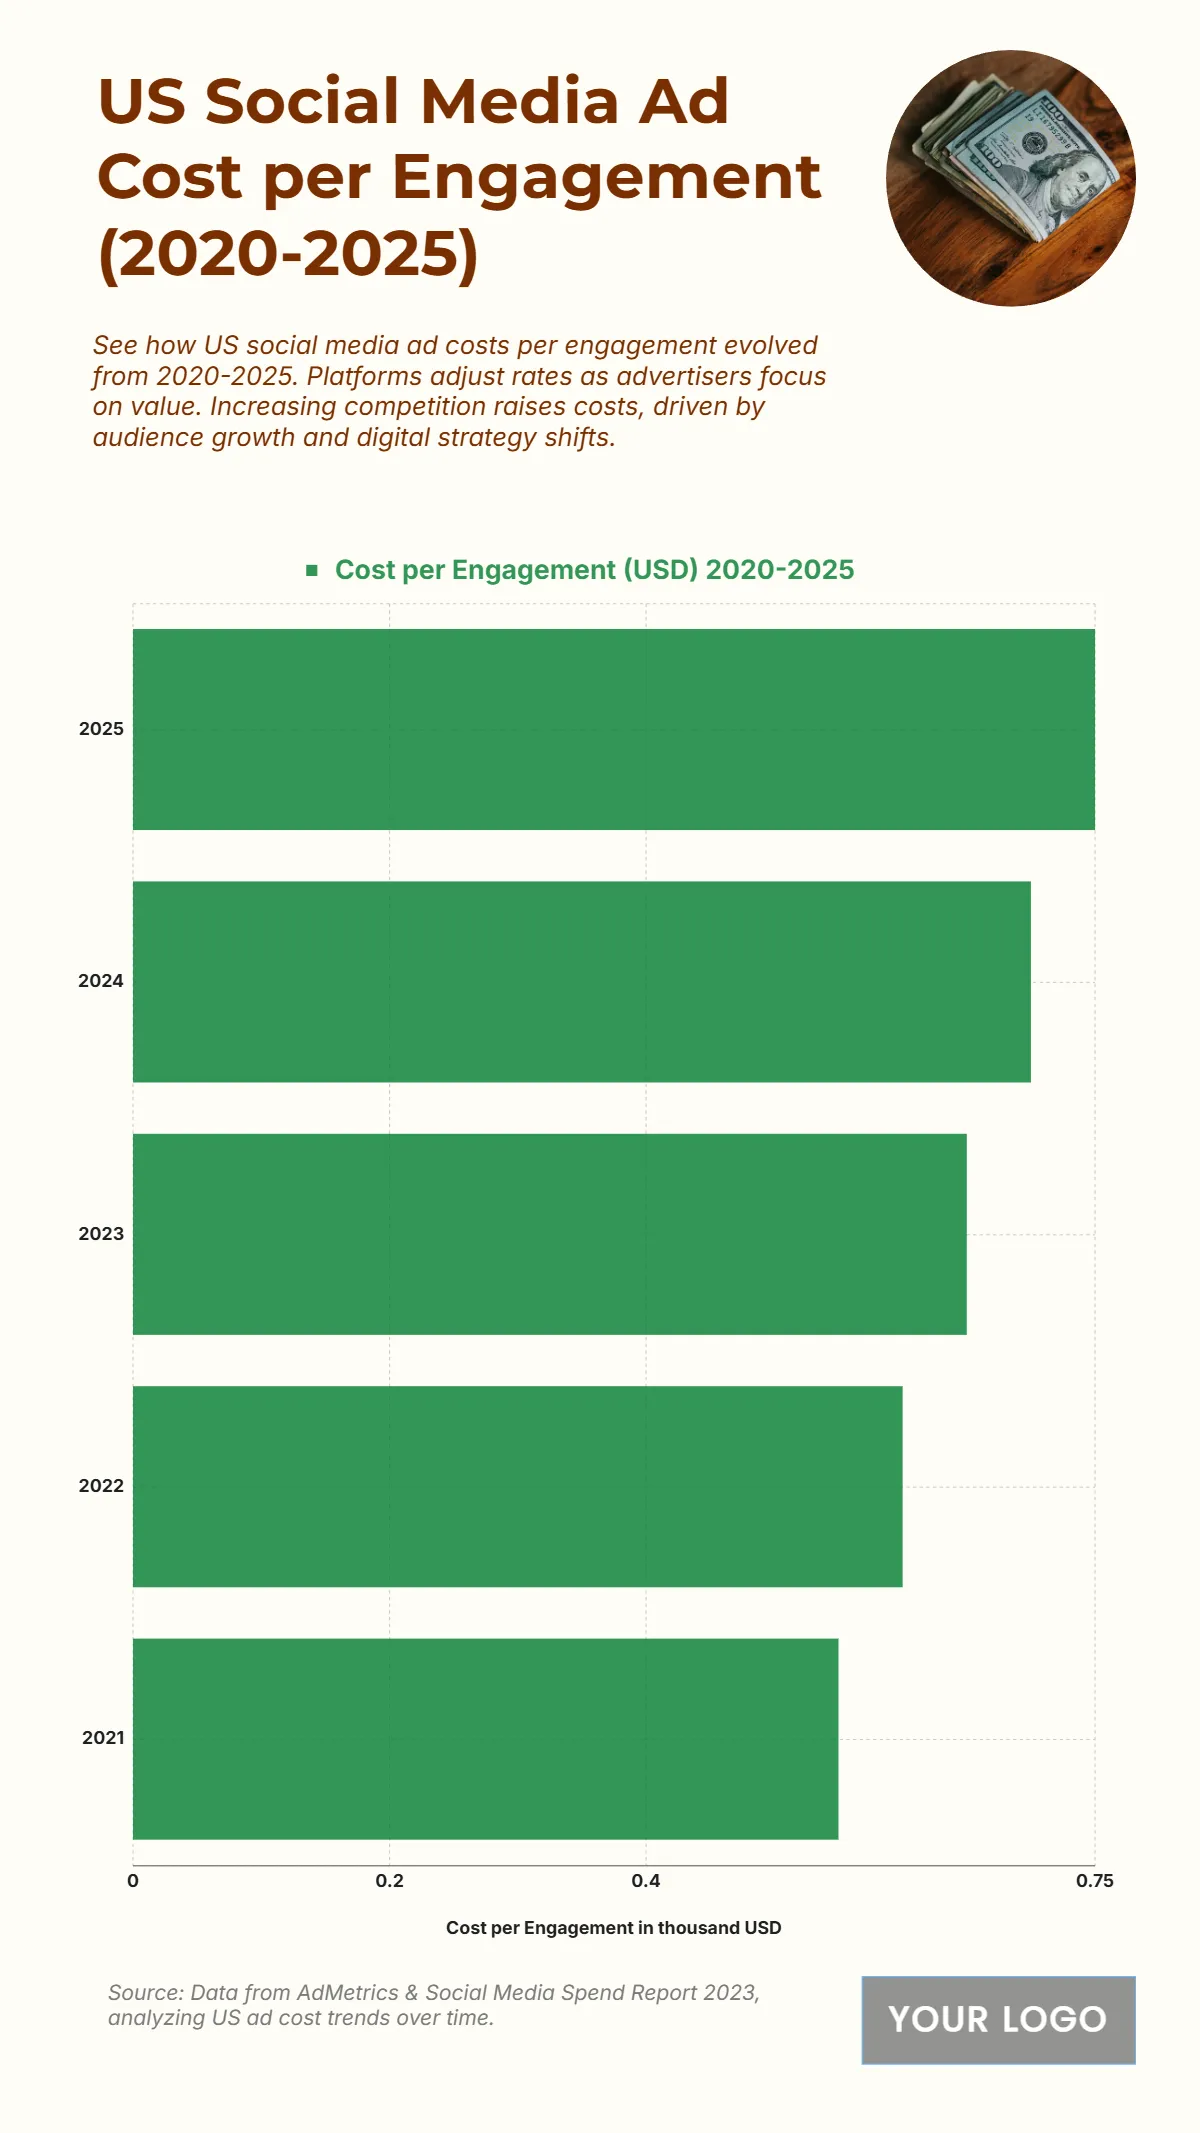
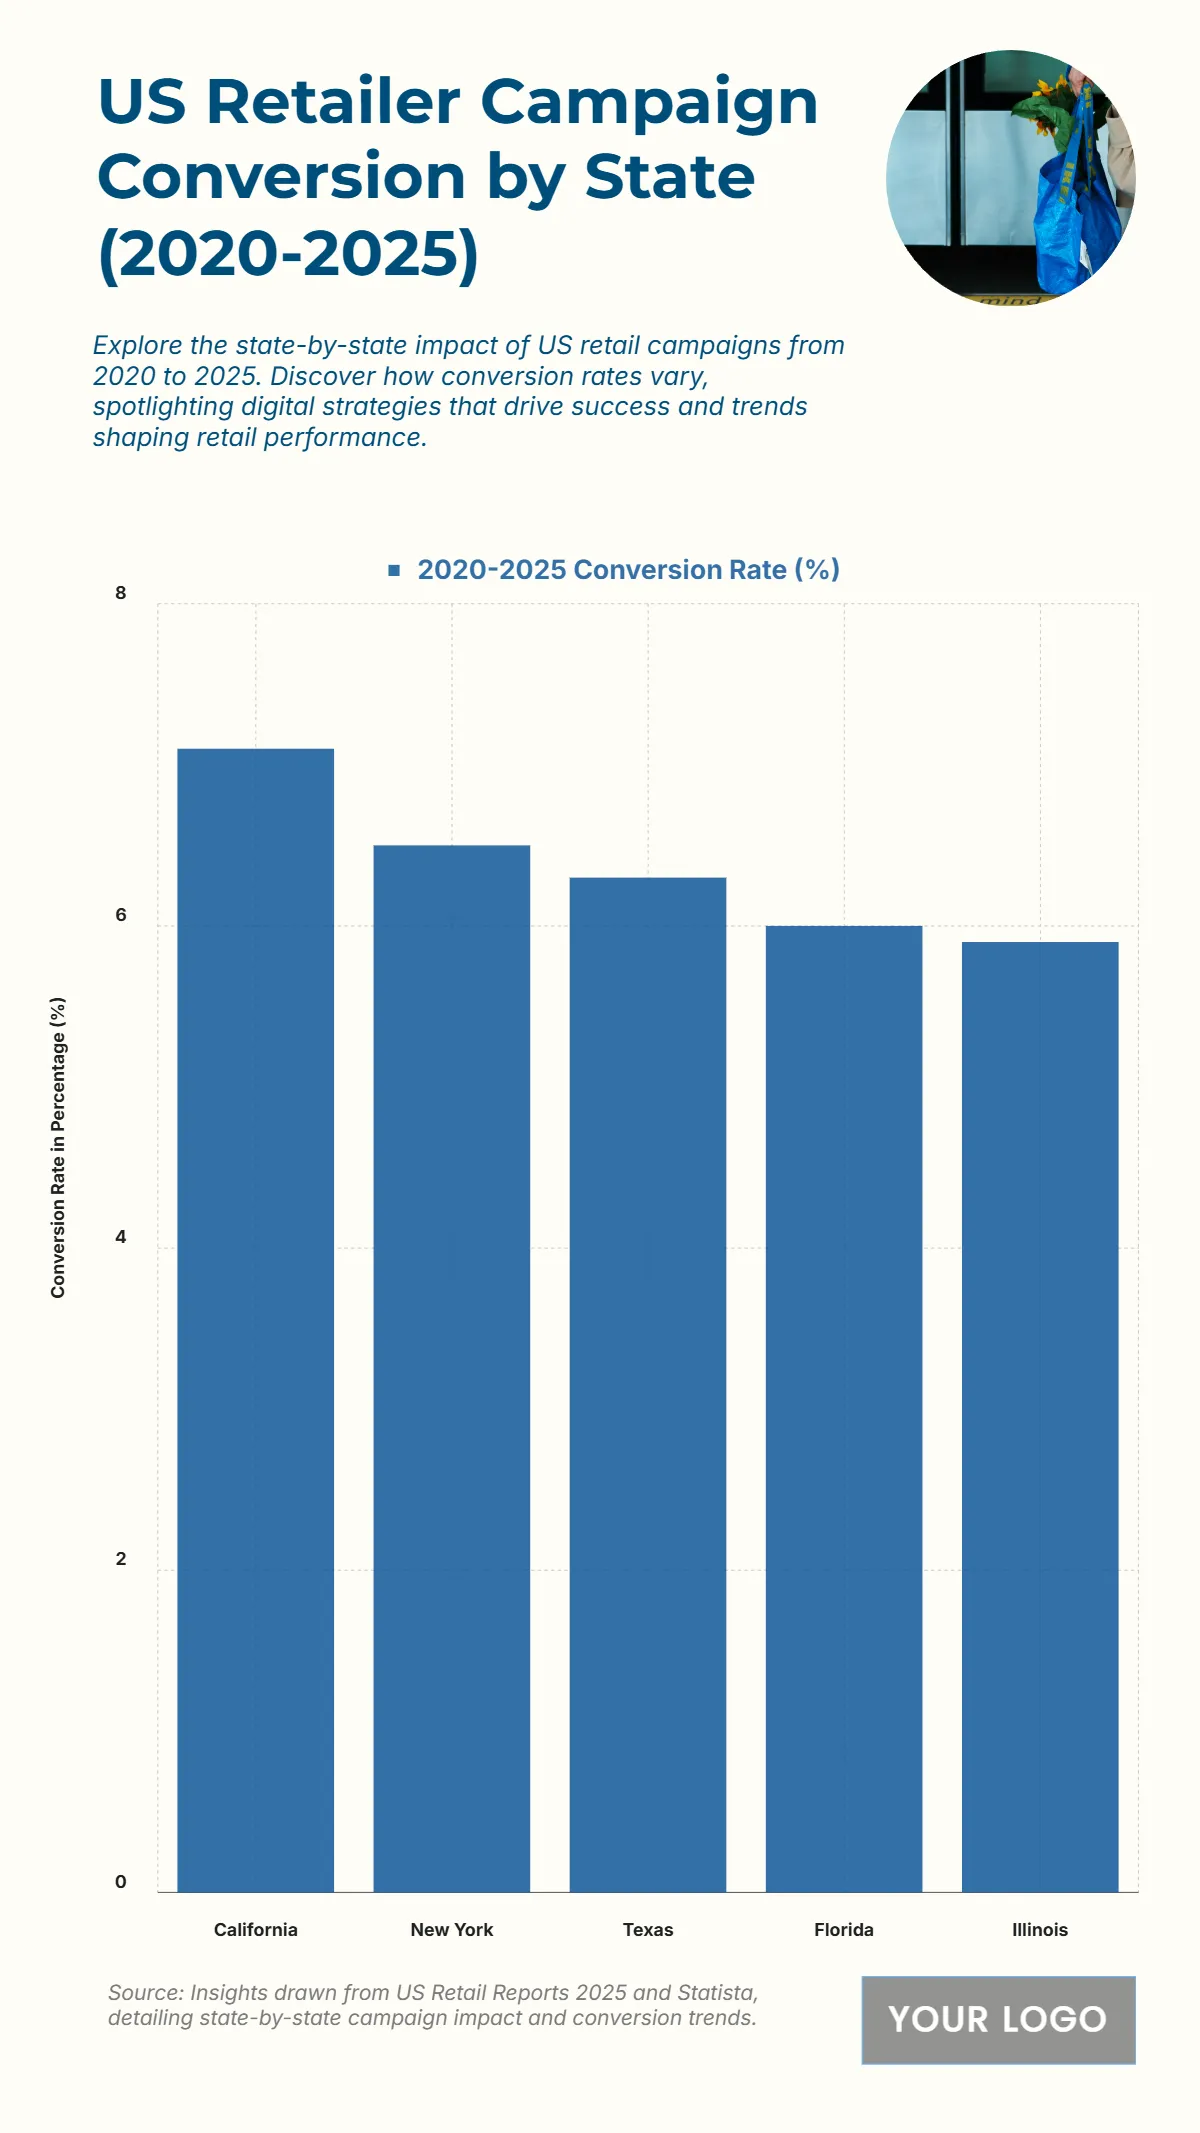
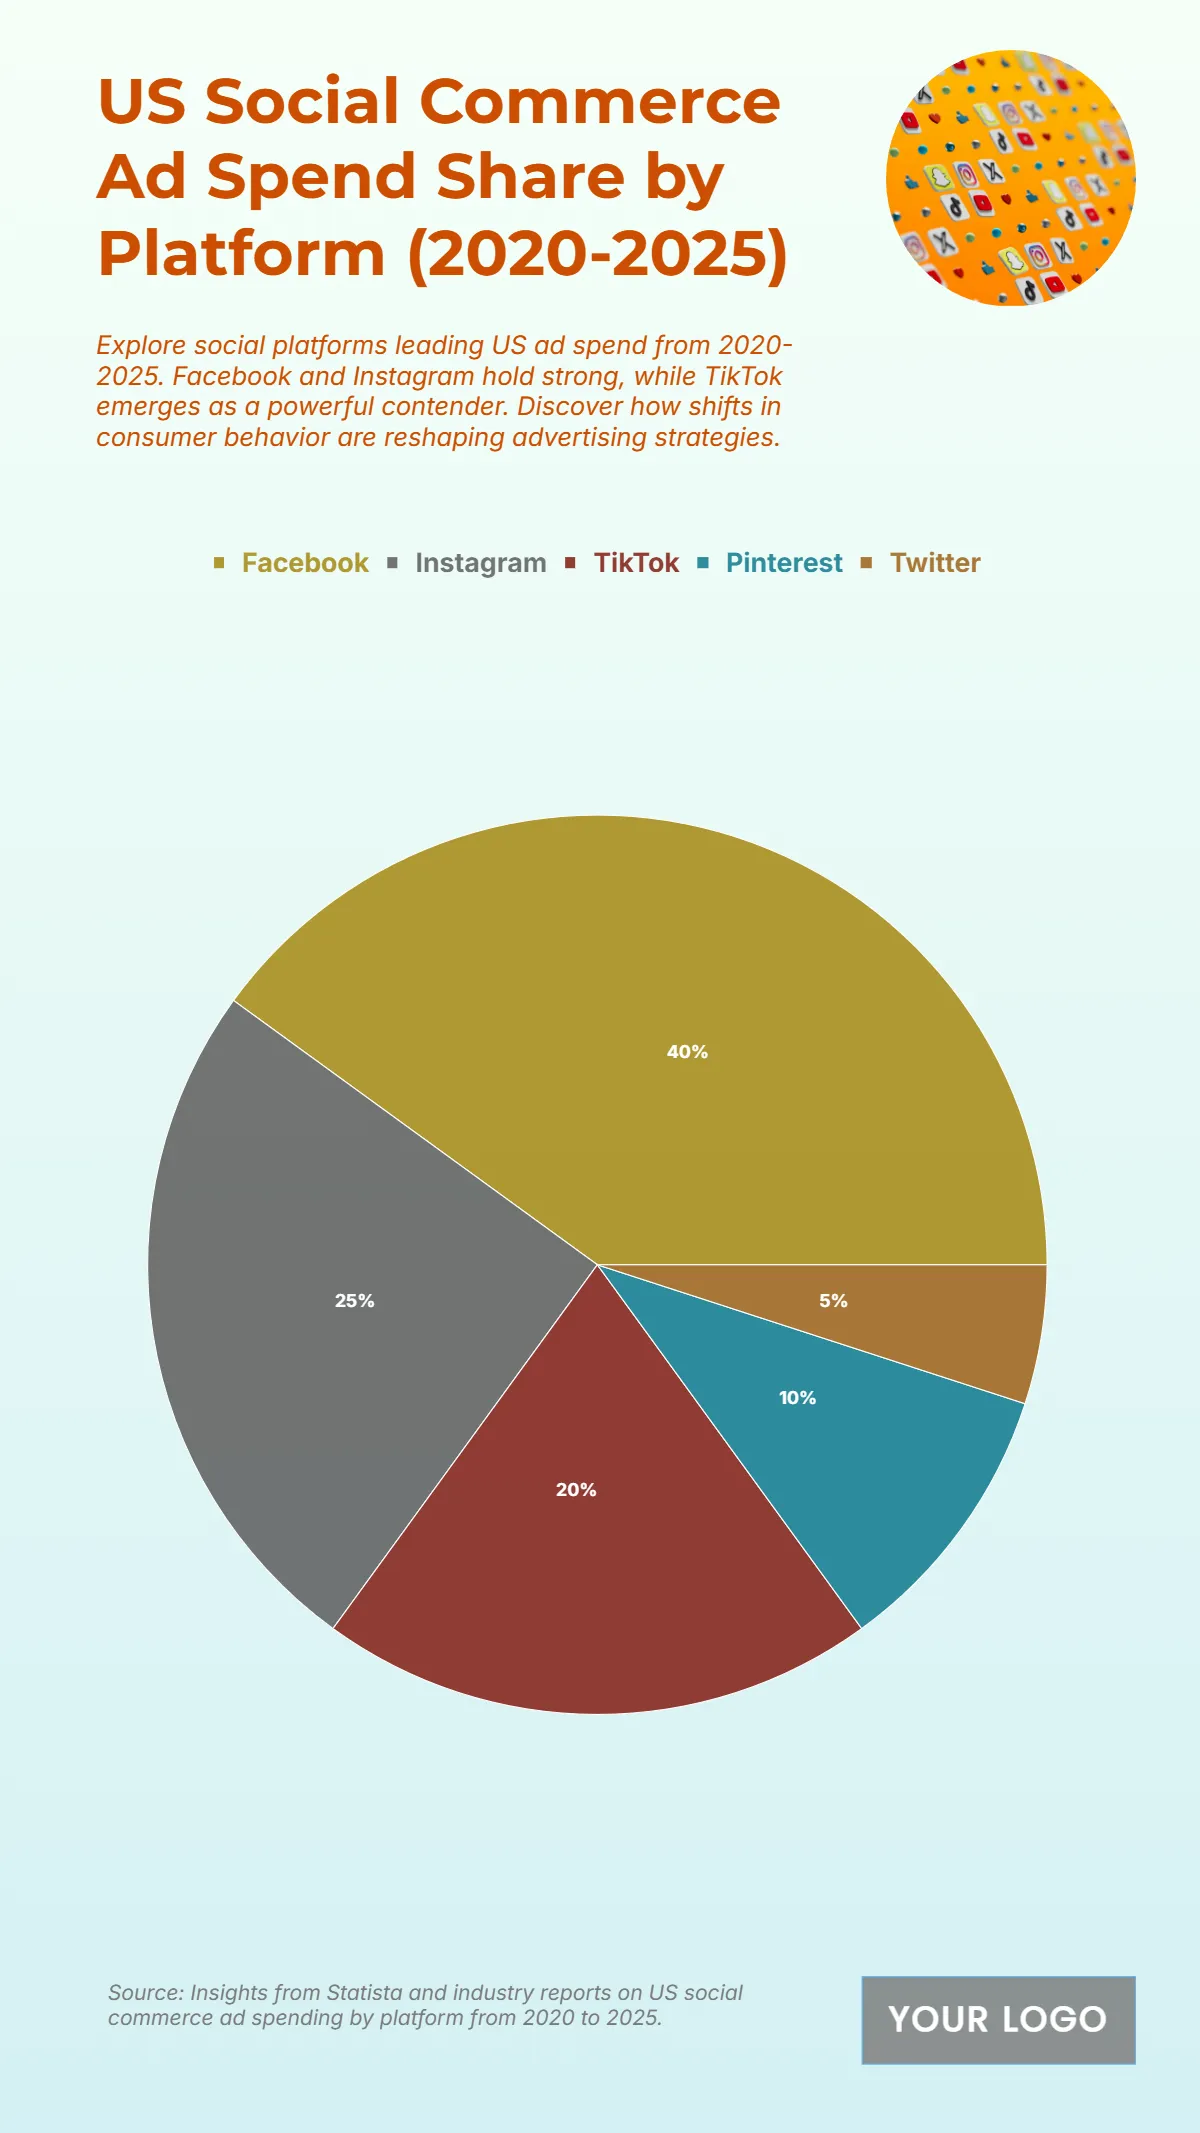
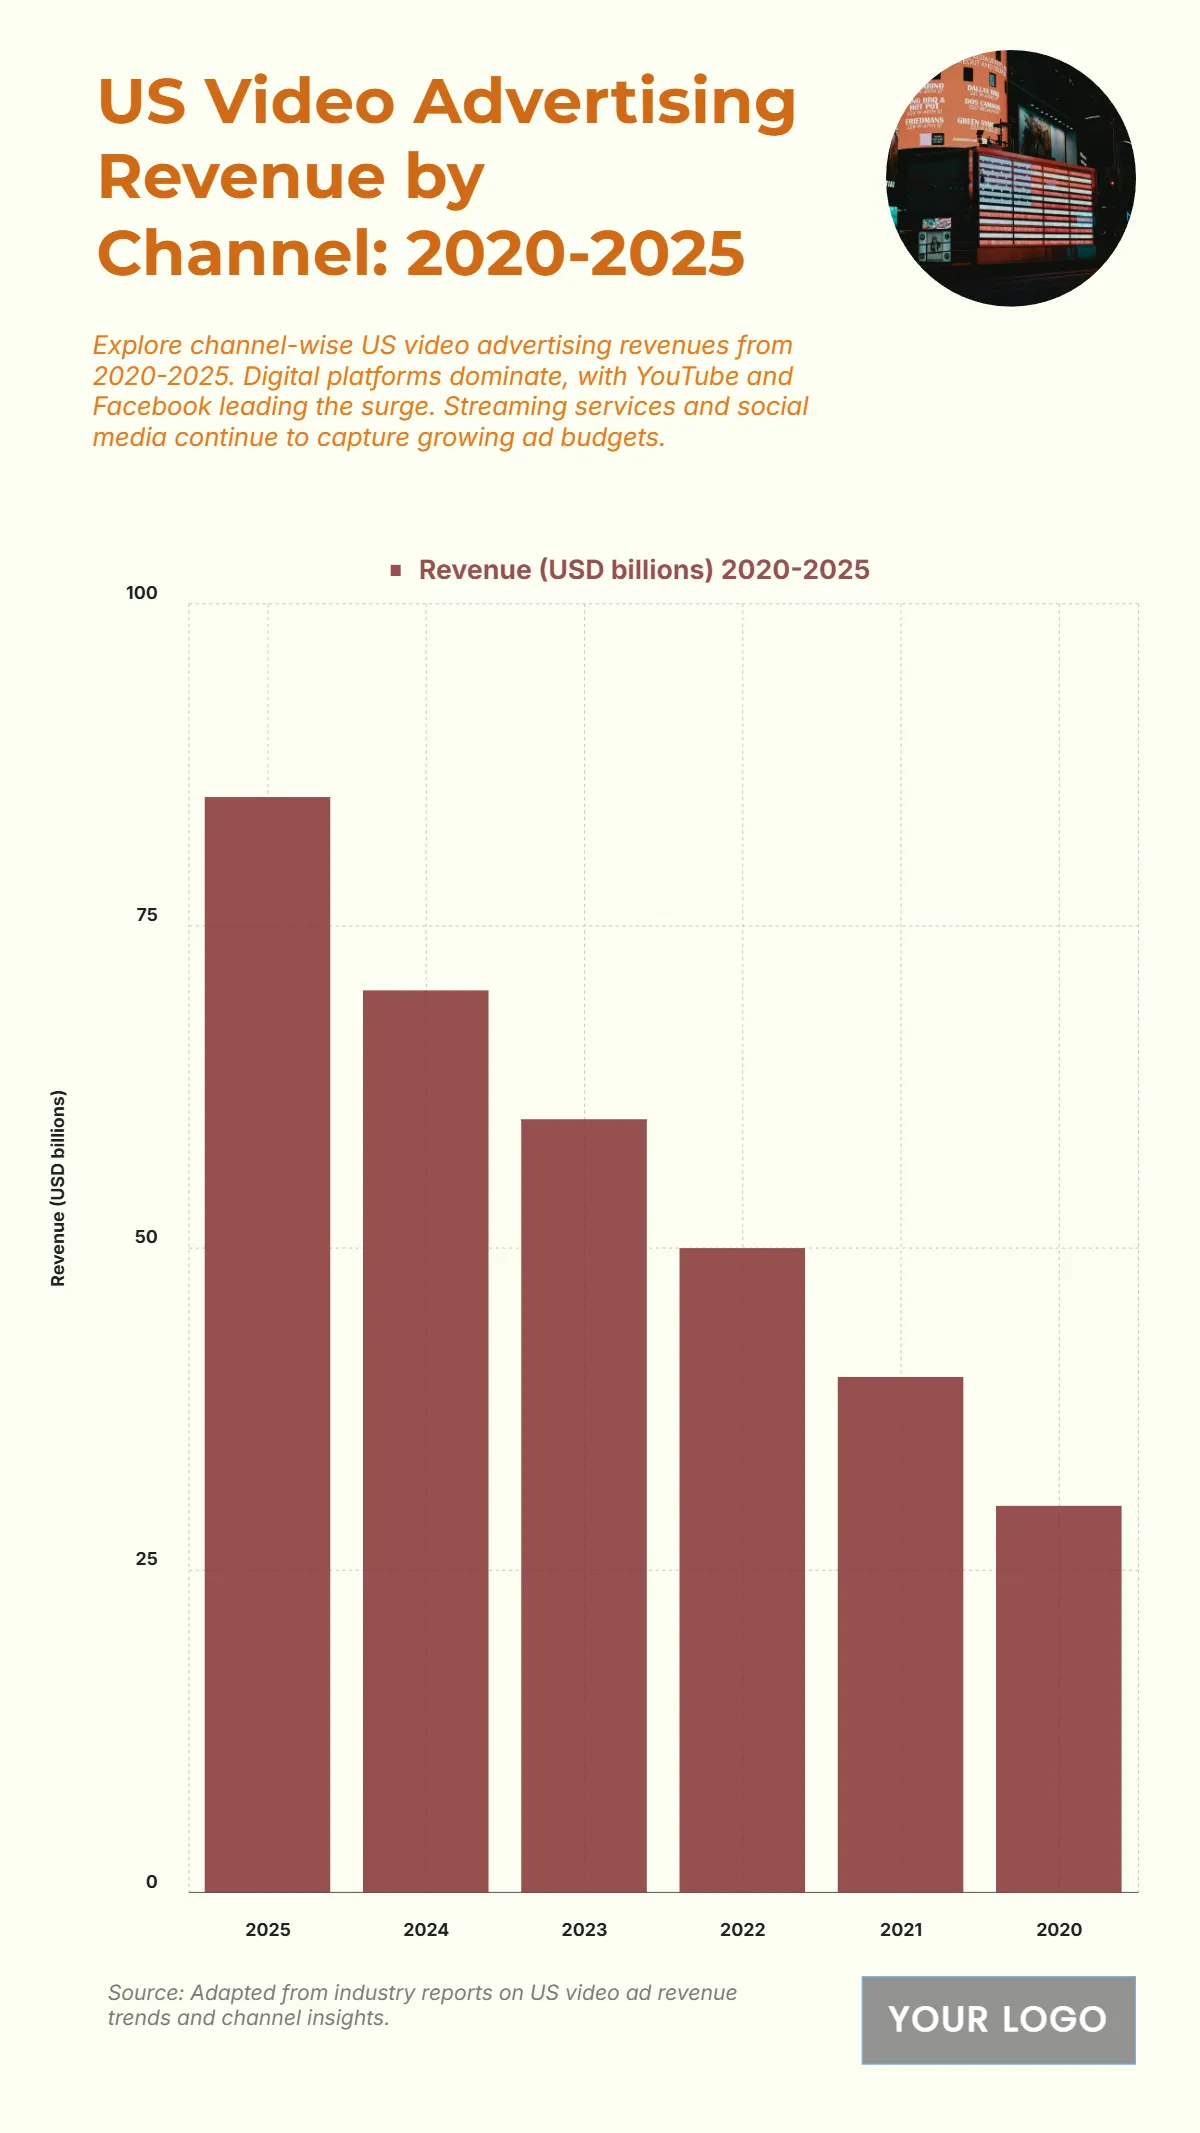
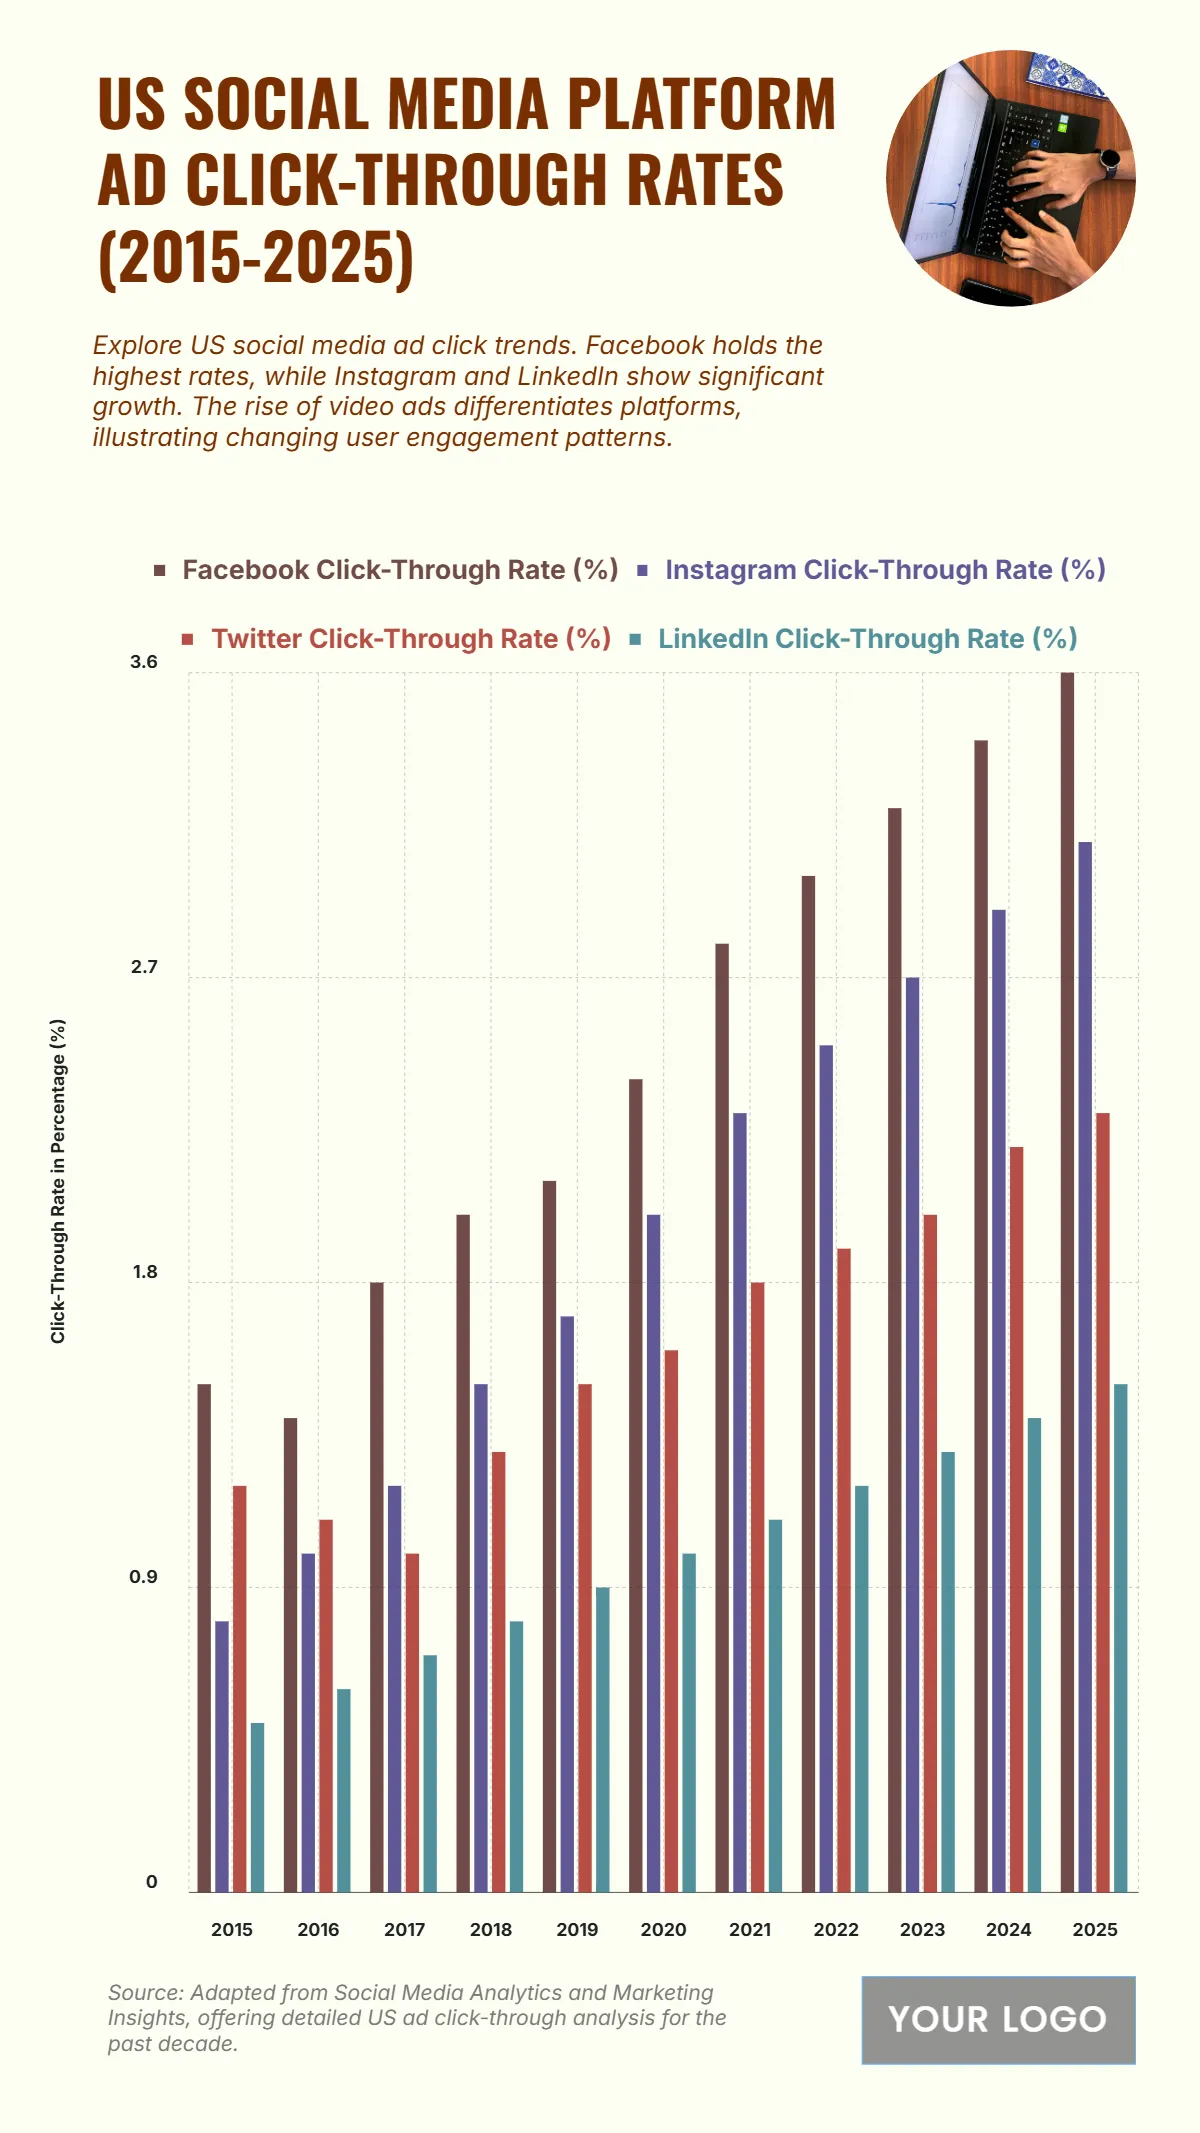
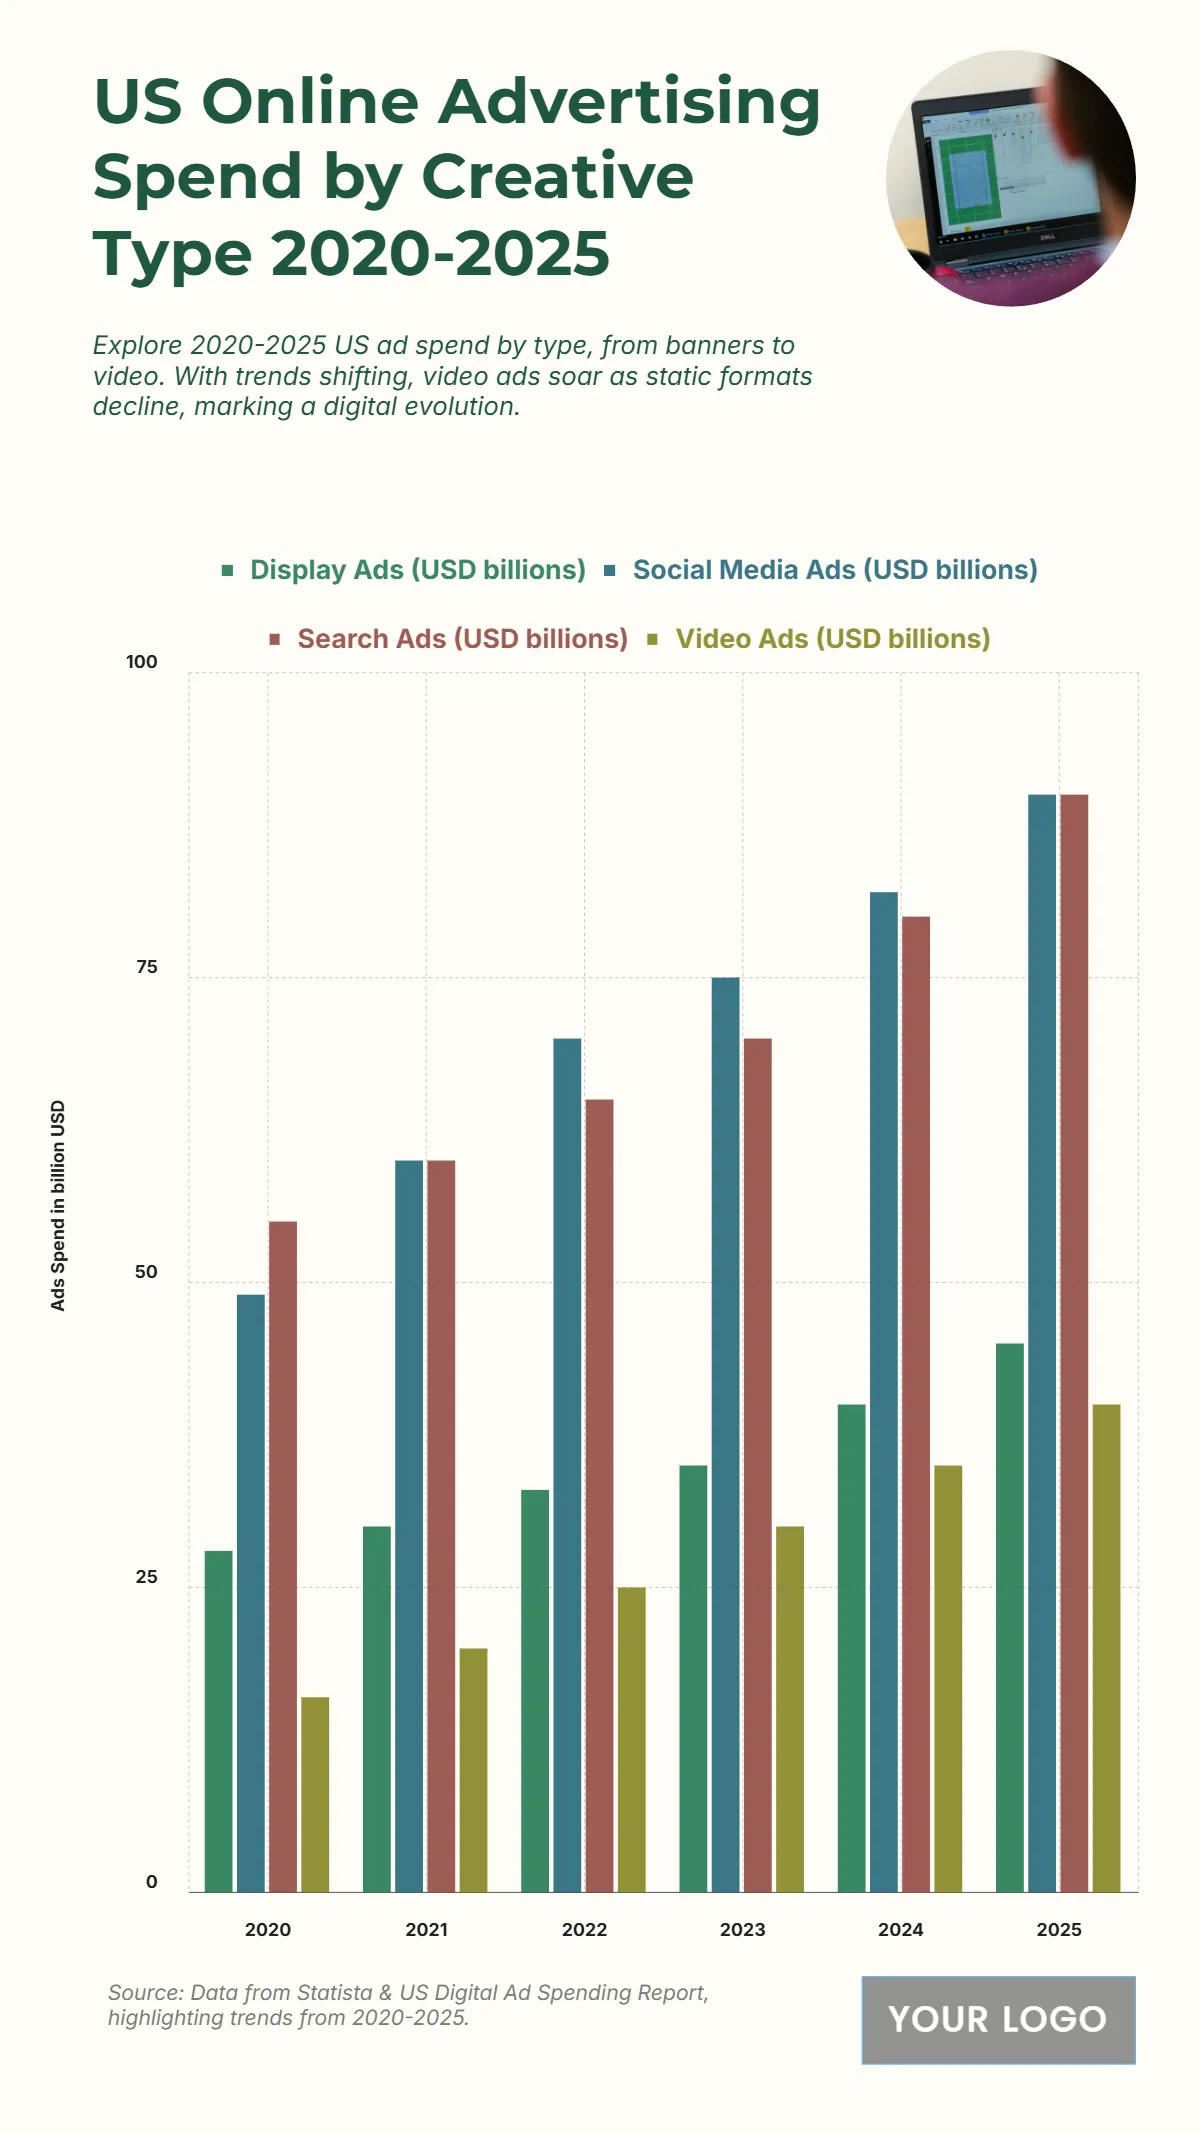
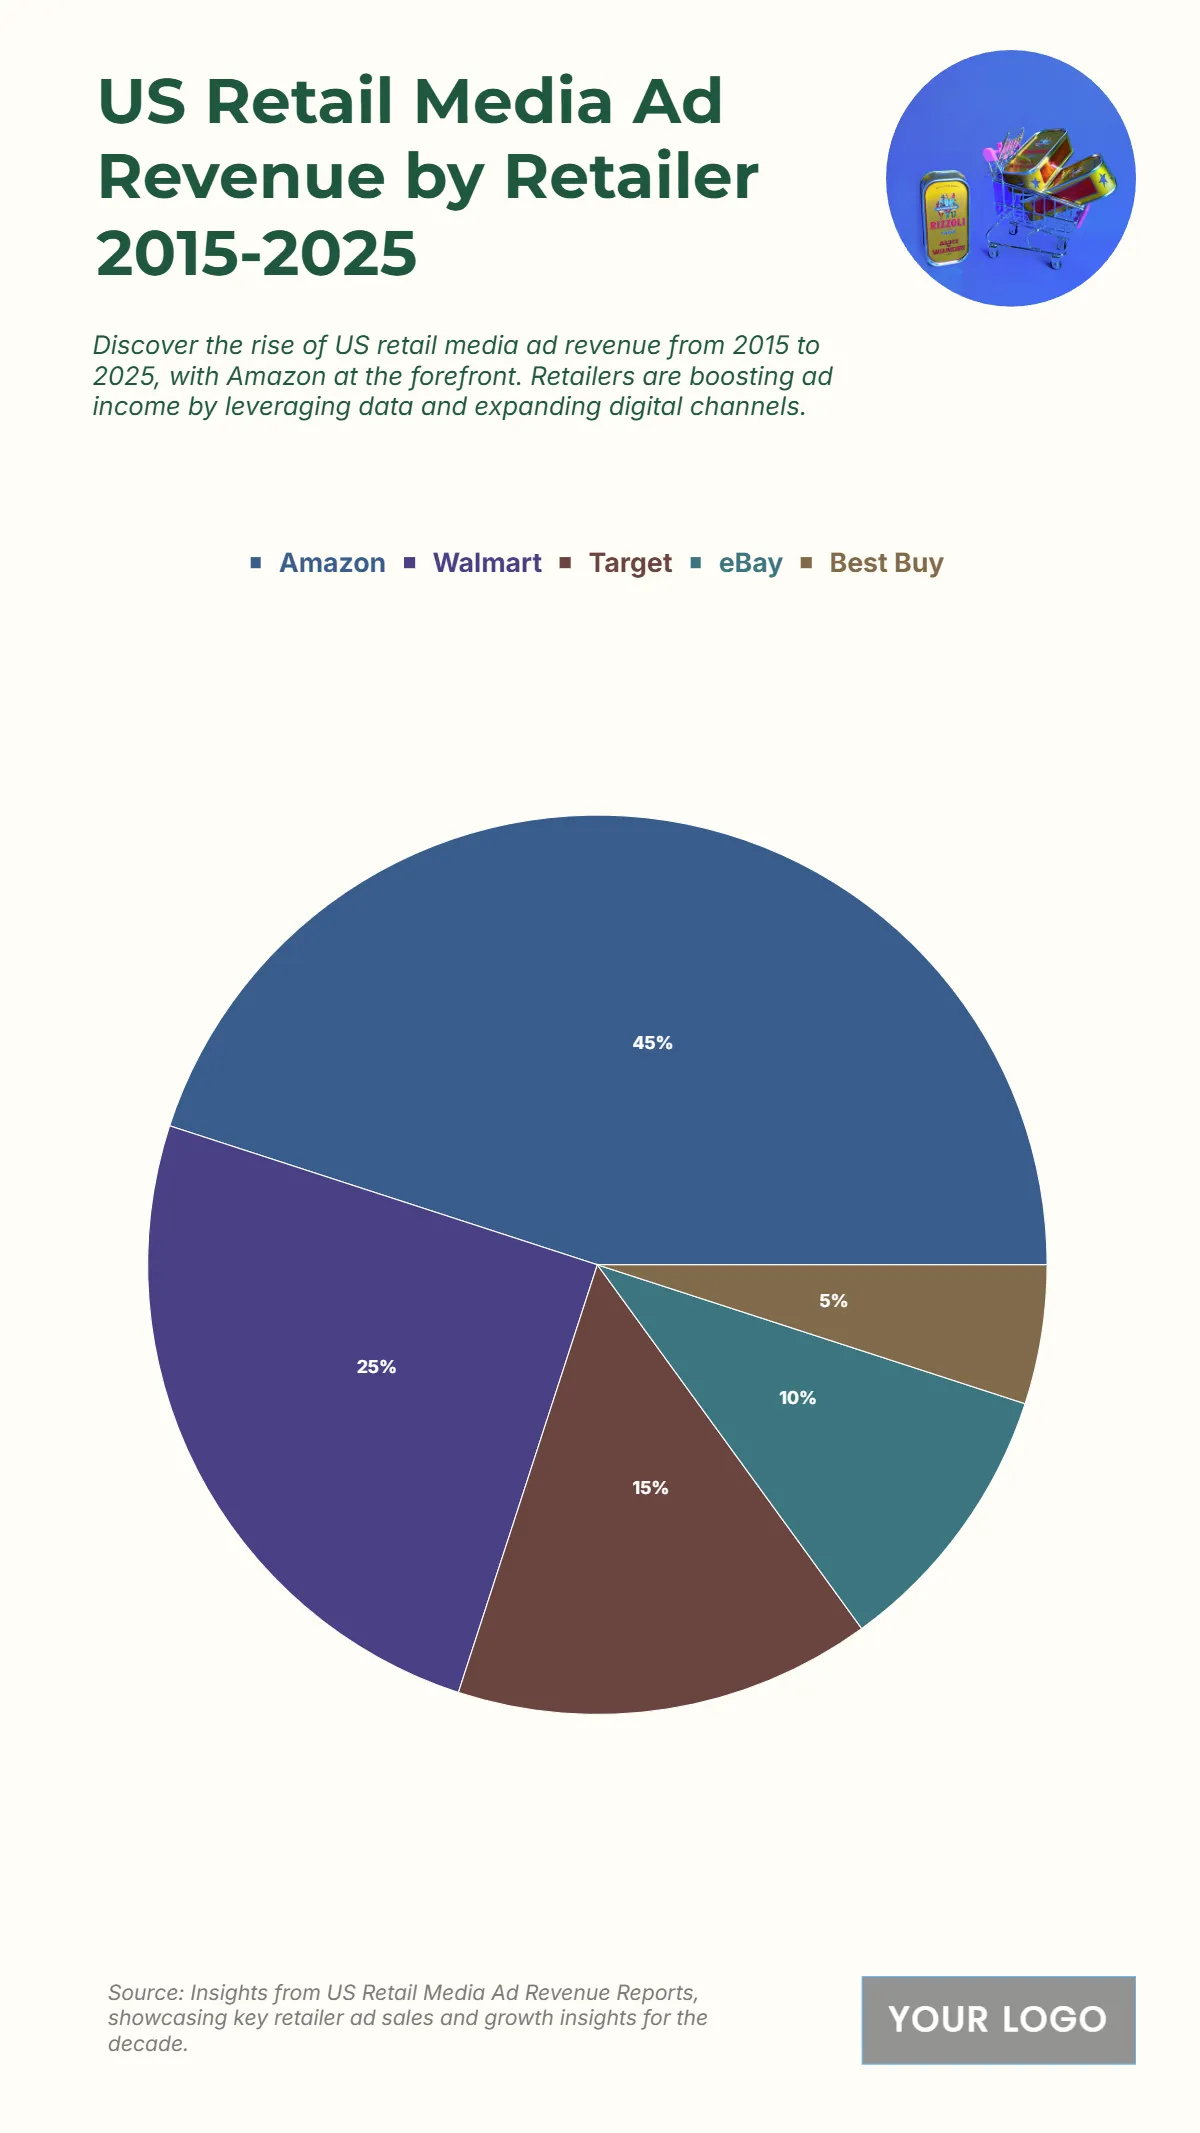
Drive smarter marketing decisions and elevate your presentations with Advertising Chart Templates from Template.net! Perfect for marketers, advertisers, analysts, and business strategists, these templates turn complex advertising data into clear, compelling visuals. Whether you’re tracking ad spend across platforms, comparing campaign performance, analyzing audience reach, or showcasing ROI trends, our charts help you communicate insights that inspire action. Each template is professionally designed with editable data fields, customizable labels, and sleek layouts that make your marketing reports accurate, persuasive, and visually stunning.
Explore our wide selection of advertising chart templates built to fit every strategy and goal. Choose from bar charts, pie graphs, grouped column visuals, and performance comparison tables—all fully customizable to match your brand and presentation style. Easily adjust colors, typography, and chart formats, or add icons, notes, and trend indicators for extra visual impact. With intuitive drag-and-drop editing and no design experience needed, you can create high-quality charts in minutes. Plus, our growing library of up-to-date templates ensures you always have the latest styles and formats for digital marketing, media planning, and campaign analysis. When your chart is ready, download it for reports, share it with clients, or embed it into your decks for a polished finish that showcases results and boosts credibility.


