Table of Contents
- Infographic Definition & Meaning
- What Is an Infographic?
- 10 Types of
- Infographic Uses, Purpose, Importance
- What’s in an Infographic? Parts?
- How to Design an Infographic?
- Infographic vs. Graphic Organizer
- What’s the Difference Between an Infographic, Data Visualization, & Dashboard?
- Infographic Sizes
- Infographic Ideas
- FAQ
- More in Infographic
Infographics
Infographics are extensively used and applied in diverse and expansive ways in many businesses and organizations for marketing, reporting, and gaining business insight. Creating an engaging infographic will help businesses and organizations to display valuable data, facts, information, and trends effectively.
Download the Free Infographics Article in PDF
File Format:
Infographic Definition & Meaning
An infographic is a clear visual representation of data, facts, figures, information, and statistics through organized charts, graphs, and other graphic tools.
Infographics are essential to many businesses, organizations, and professionals to clearly and quickly present complex information and to guide them in better recognizing and visualizing various patterns and trends in a specific area.
What Is an Infographic?
An infographic is an abbreviation of an information graphic that uses visual elements to communicate information for business and organizational purposes such as content marketing and brand promotion. It is commonly used in traditional prints, online publications, blogs, and/or social media pages to visualize data, the latest trends, patterns, and statistics. Plus, this tool guides the audience to comprehend the message immediately.
10 Types of Infographics
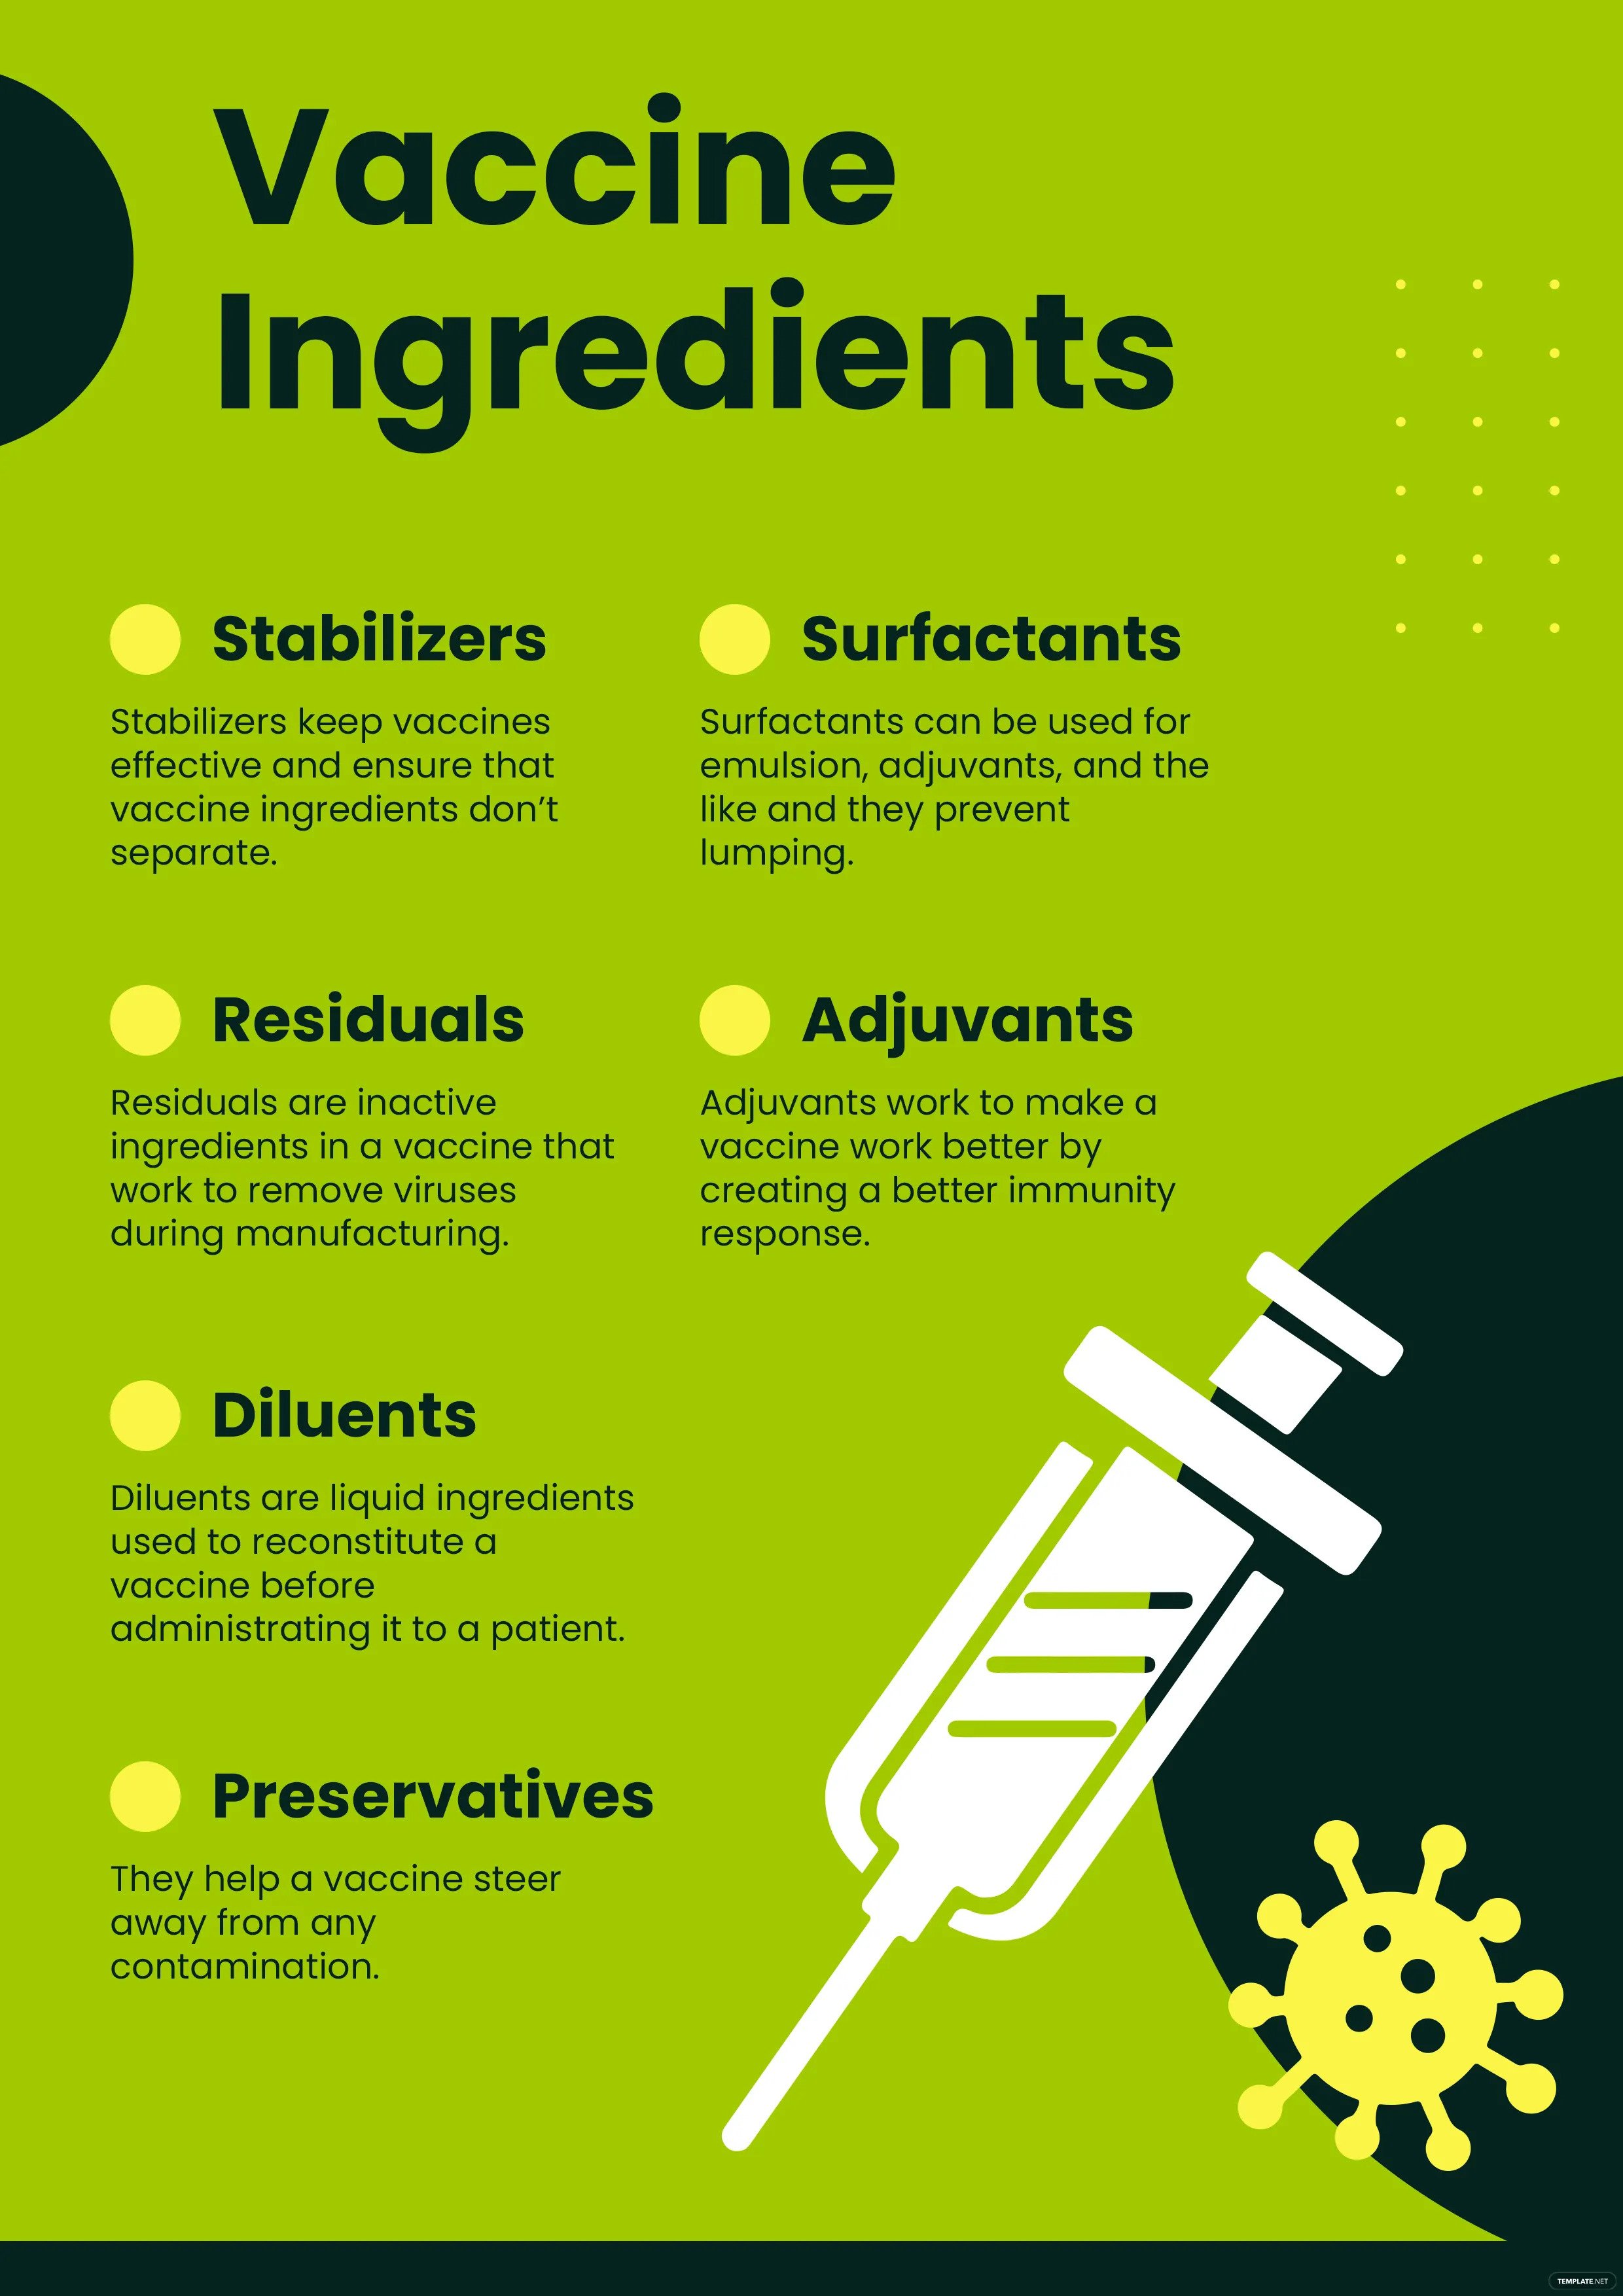
Vaccine Infographic
A vaccine infographic is an infographic used for health care and medical purposes, providing a clear visual representation of key information about a specific vaccine. It highlights the major components of a vaccine and how each component works together to boost the immunity of a person against a particular disease. Use a vaccine infographic to inform the public about the statistics and other details of several vaccine ingredients.
Travel Infographic
Create a clear and well-structured infographic for your traveling and long journey plans. List down the important things you need to do before you travel to a certain place. Make things easy and quick while designing your travel infographic when you use an awesome travel infographic template.
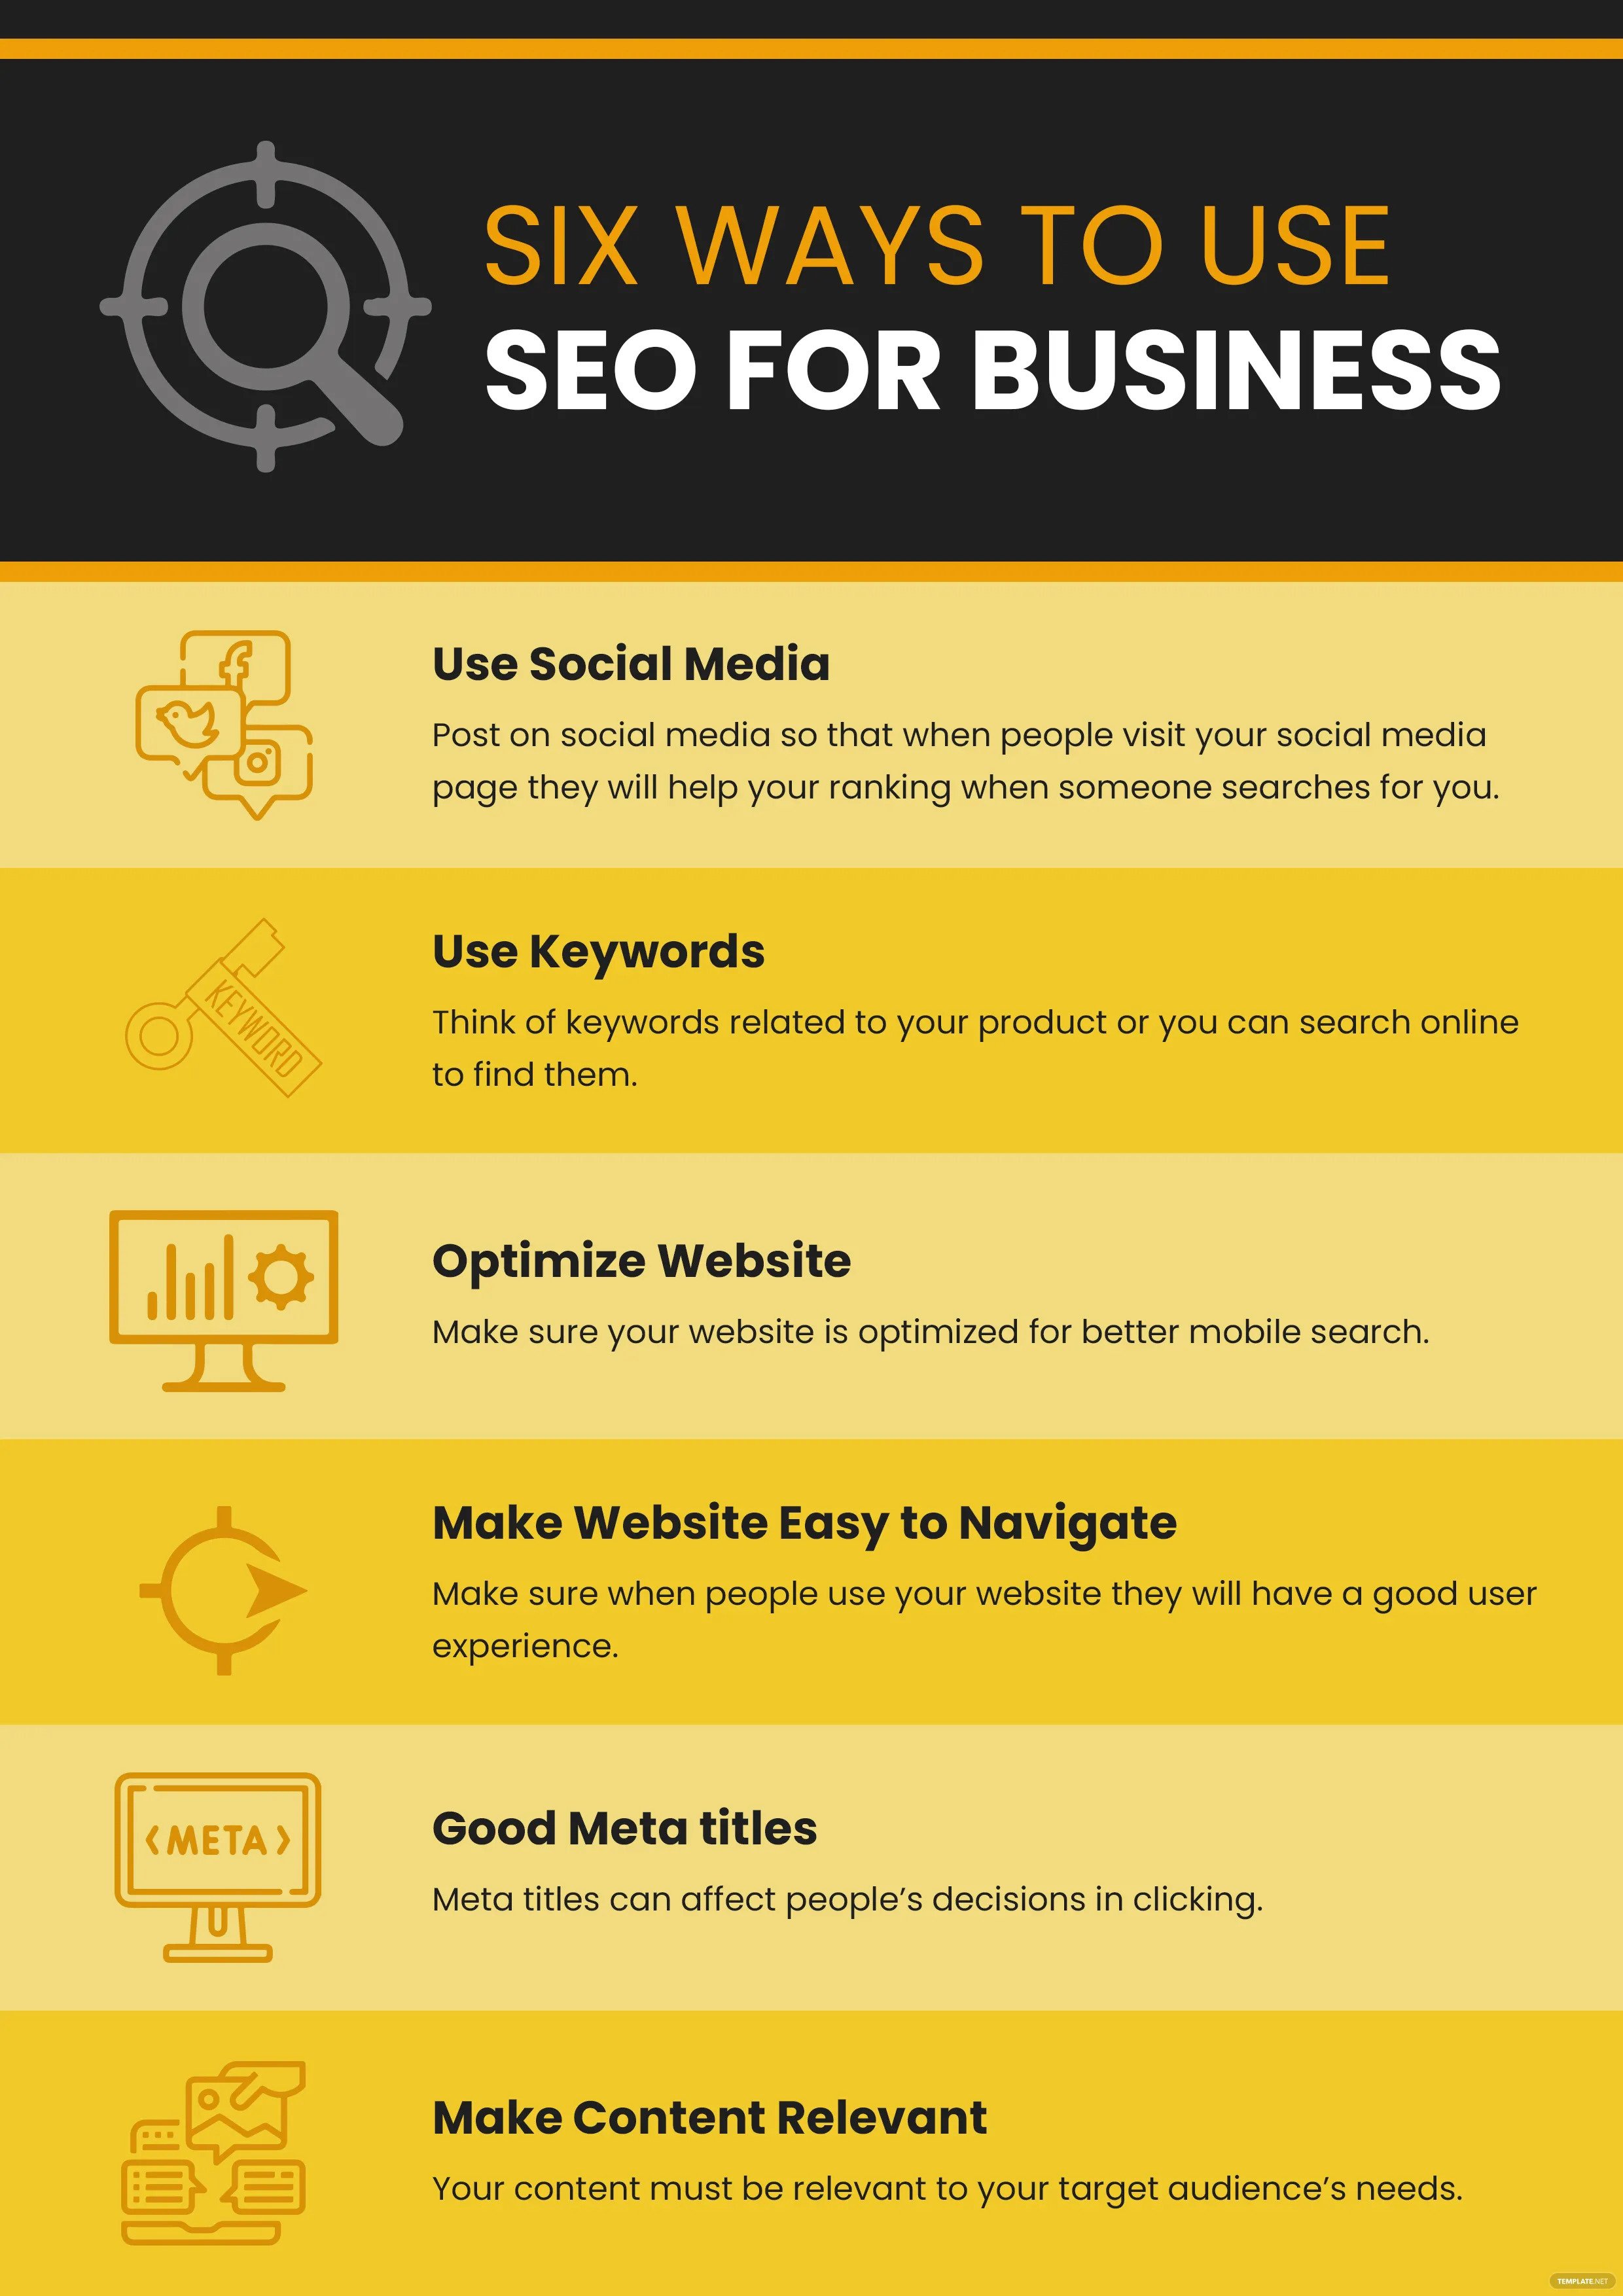
SEO Infographic
Using an appealing SEO infographic template helps you to define several ways to use SEO for your company. SEO is generally used in increasing social media awareness, optimizing websites, and developing relevant content for the target audience. Our website provides a wide selection of SEO infographic templates that you can easily use.
Music Infographic
Explain the history and major benefits of listening to music to your audience. Use an engaging music infographic template so that you can present core points about the worthwhile benefits of music in our body such as improving mood, helping you sleep better, and many others. Customize one of the music infographic templates on our website and use the colors based in psychology.
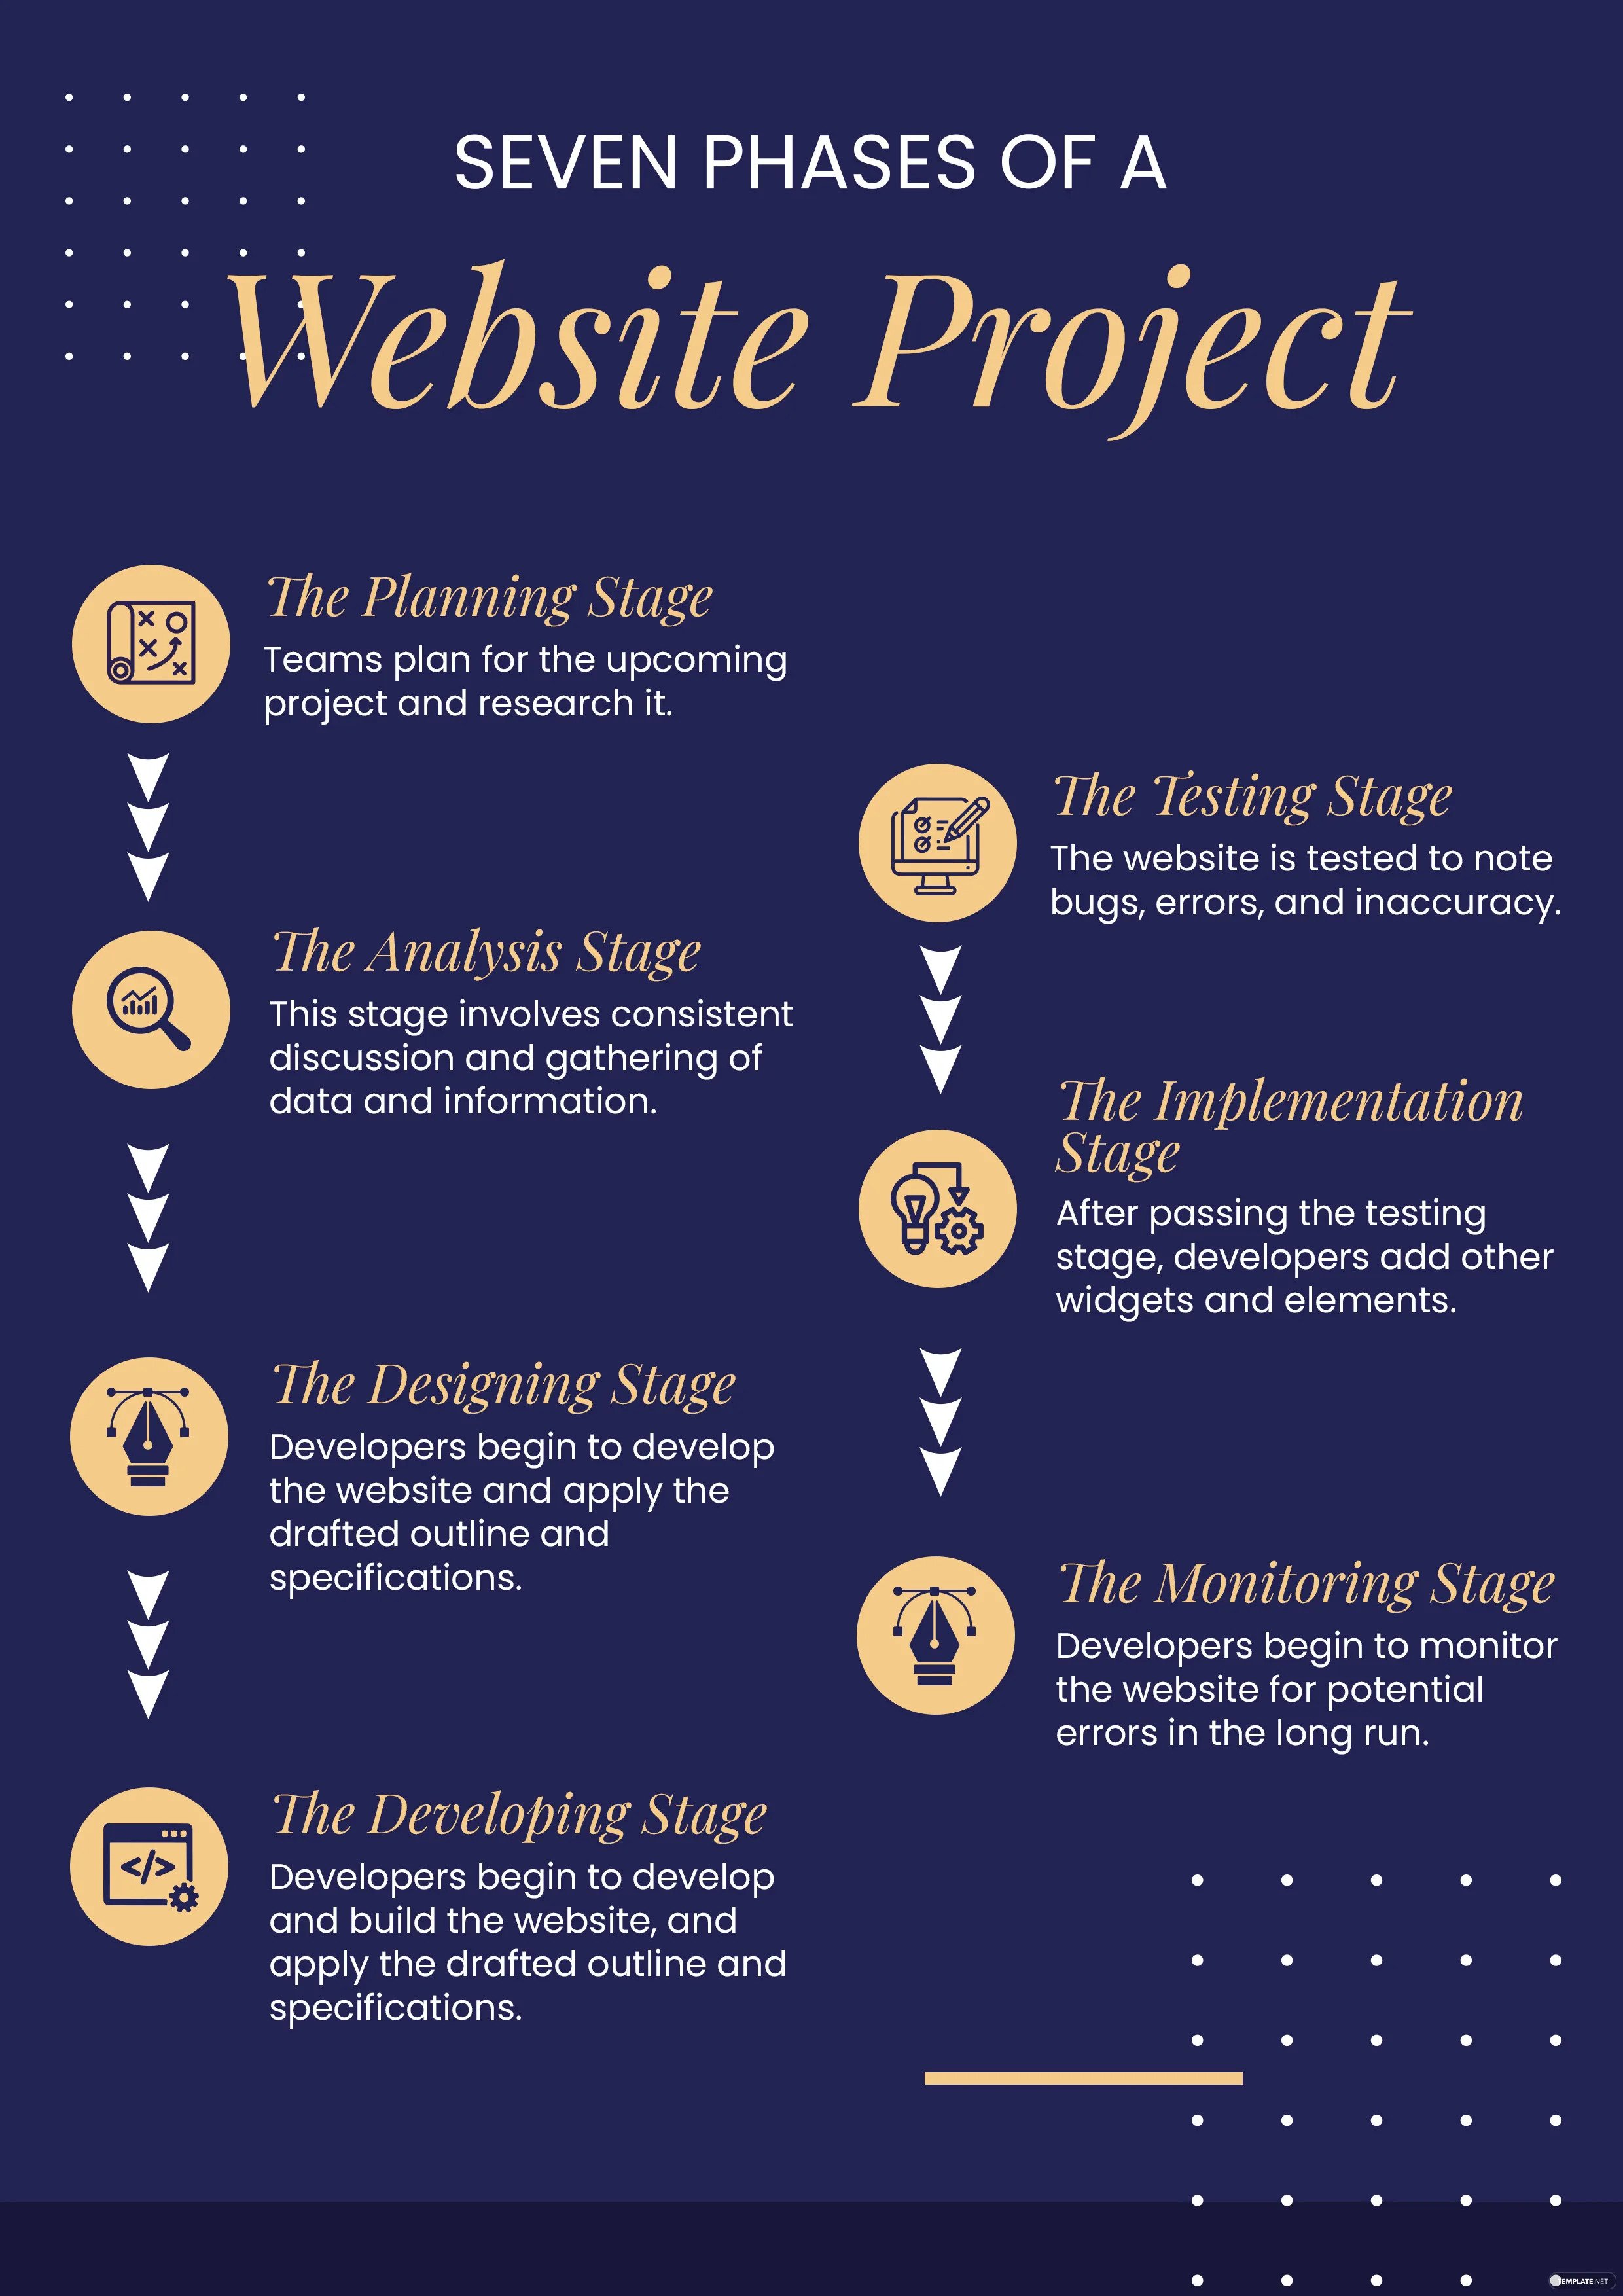
Project Infographic
A project infographic is a comprehensive visual representation that clearly outlines the different phases of your project. When preparing this design, it is important to use a simple project infographic template, include short texts and icons in each phase, and divide the sections appropriately. Apply two contrasting colors to make your infographic stand out and accentuate the content of your infographic.
About Me Infographic
Introduce yourself as an artist, blogger, content creator, or any other professional title with a contemporary About Me infographic that you can use for your CV or resume. Apply some earth tones, simple geometric lines and shapes, and typography art. Add some graphical elements that personify your brand identity.
Real Estate Infographic
This type of infographic is commonly used to help people learn and understand some tips to become successful real estate agents. Demonstrate key aspects of a successful real estate agent and insert some icons to visualize these aspects. Construct a modern real estate infographic to help you in your work.
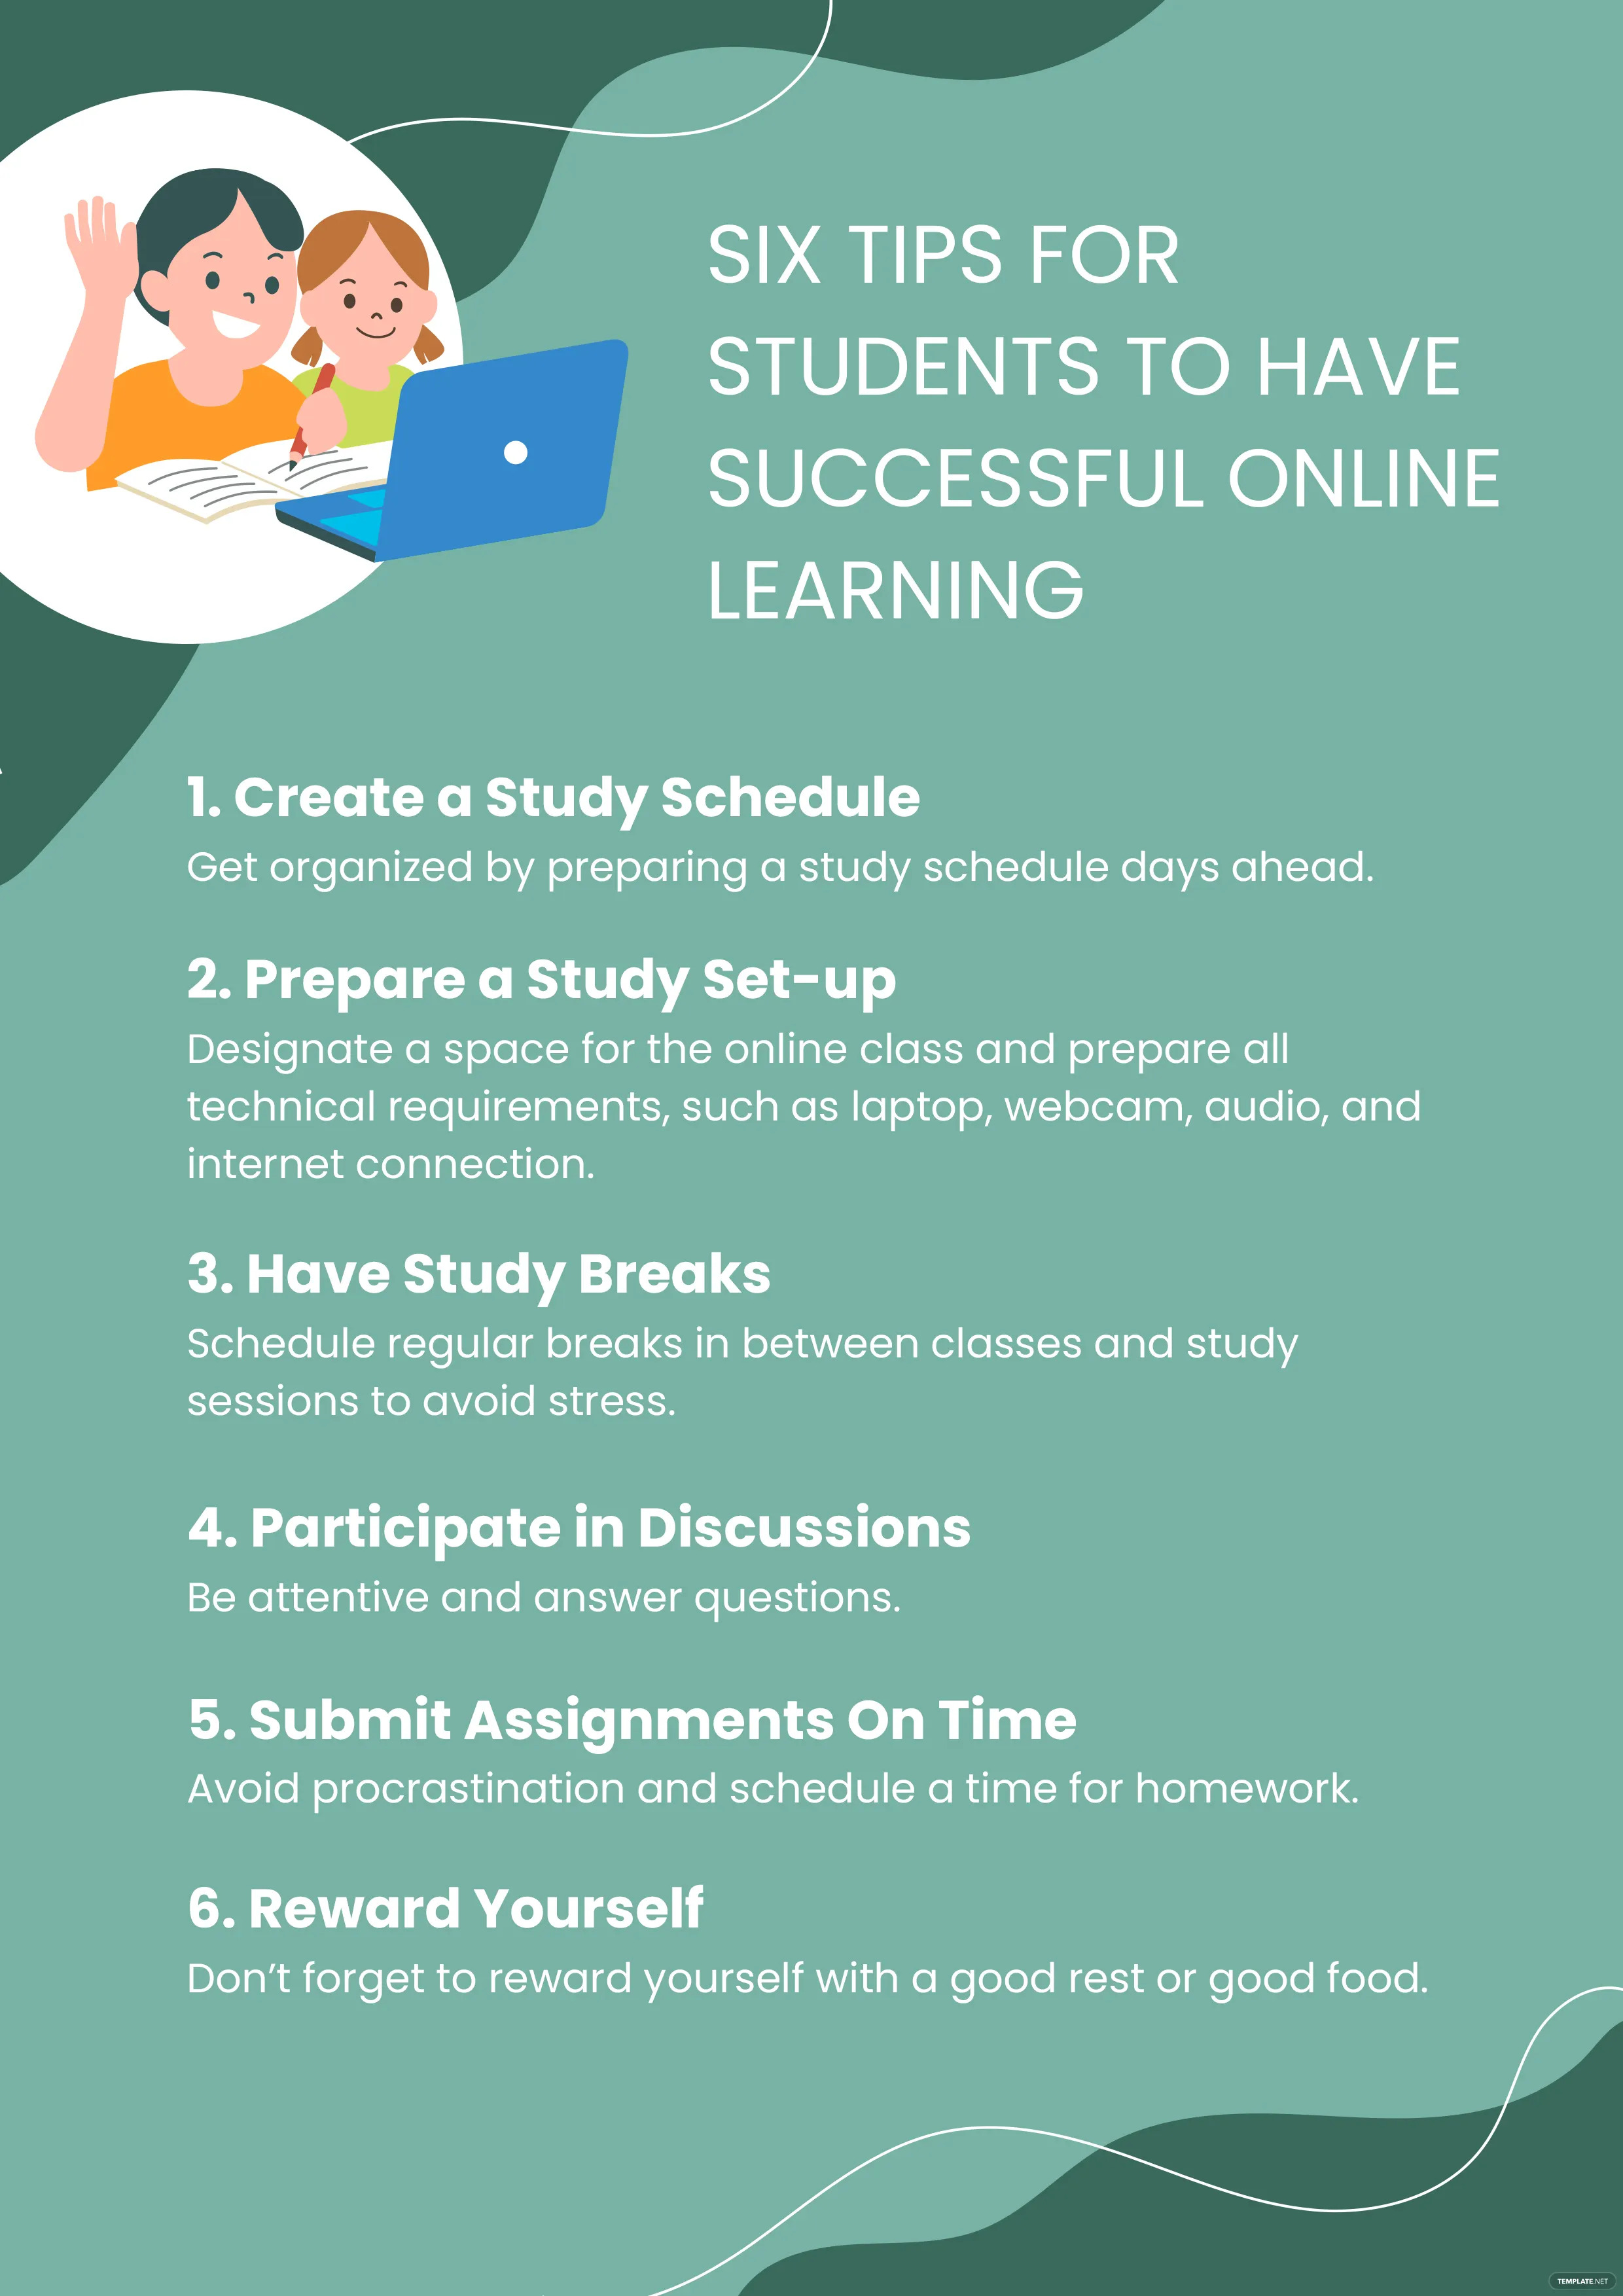
School Infographic
Teachers and other academic professionals need to use awesome infographics in their professional work to assist students in their studies well. Use a compelling school infographic template for your class. Guide your students in their online learning and present an infographic that explains the important tips on how they can be successful in their online learning journey.
Nonprofit Infographic
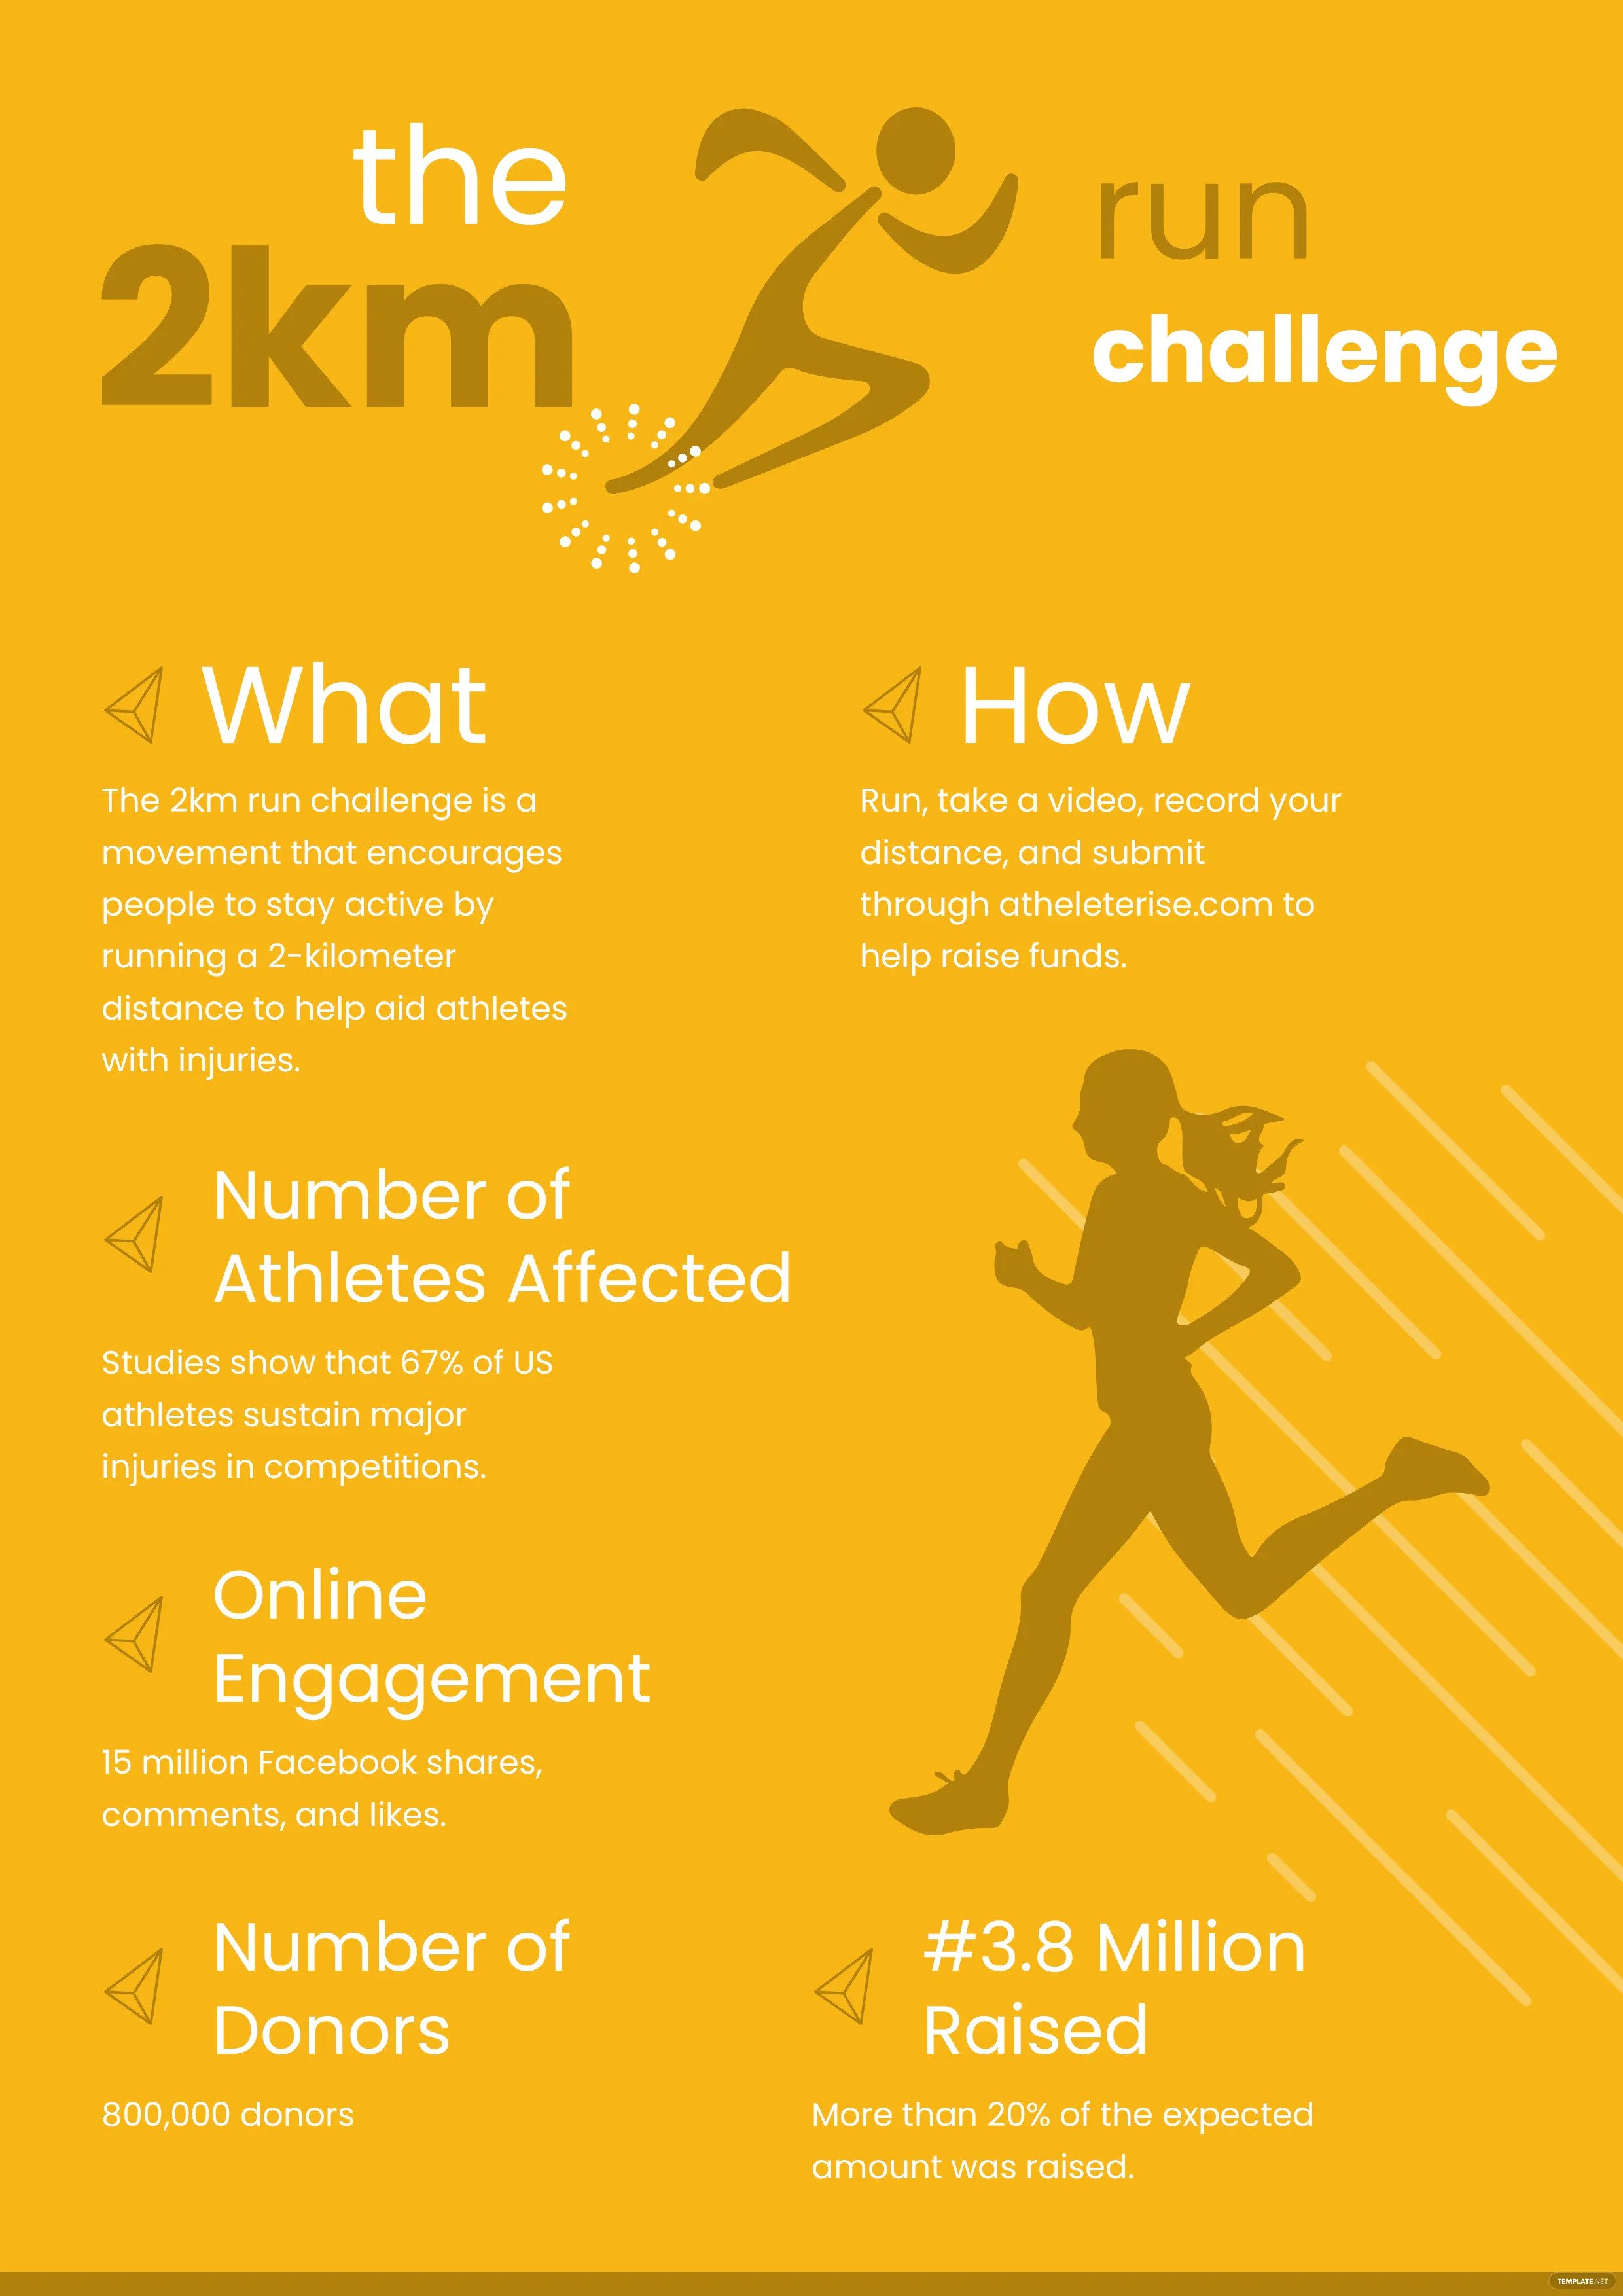
If you are planning to organize a sports fundraising event for a cause, we recommend that you use an incredibly-designed nonprofit infographic template like this one. Indicate the main goals and objectives of the fundraising event, and the key statistics of the event such as the number of athletes affected, online engagement, and the number of donors. Also, tell the people how they can join in the event.
Construction Infographic
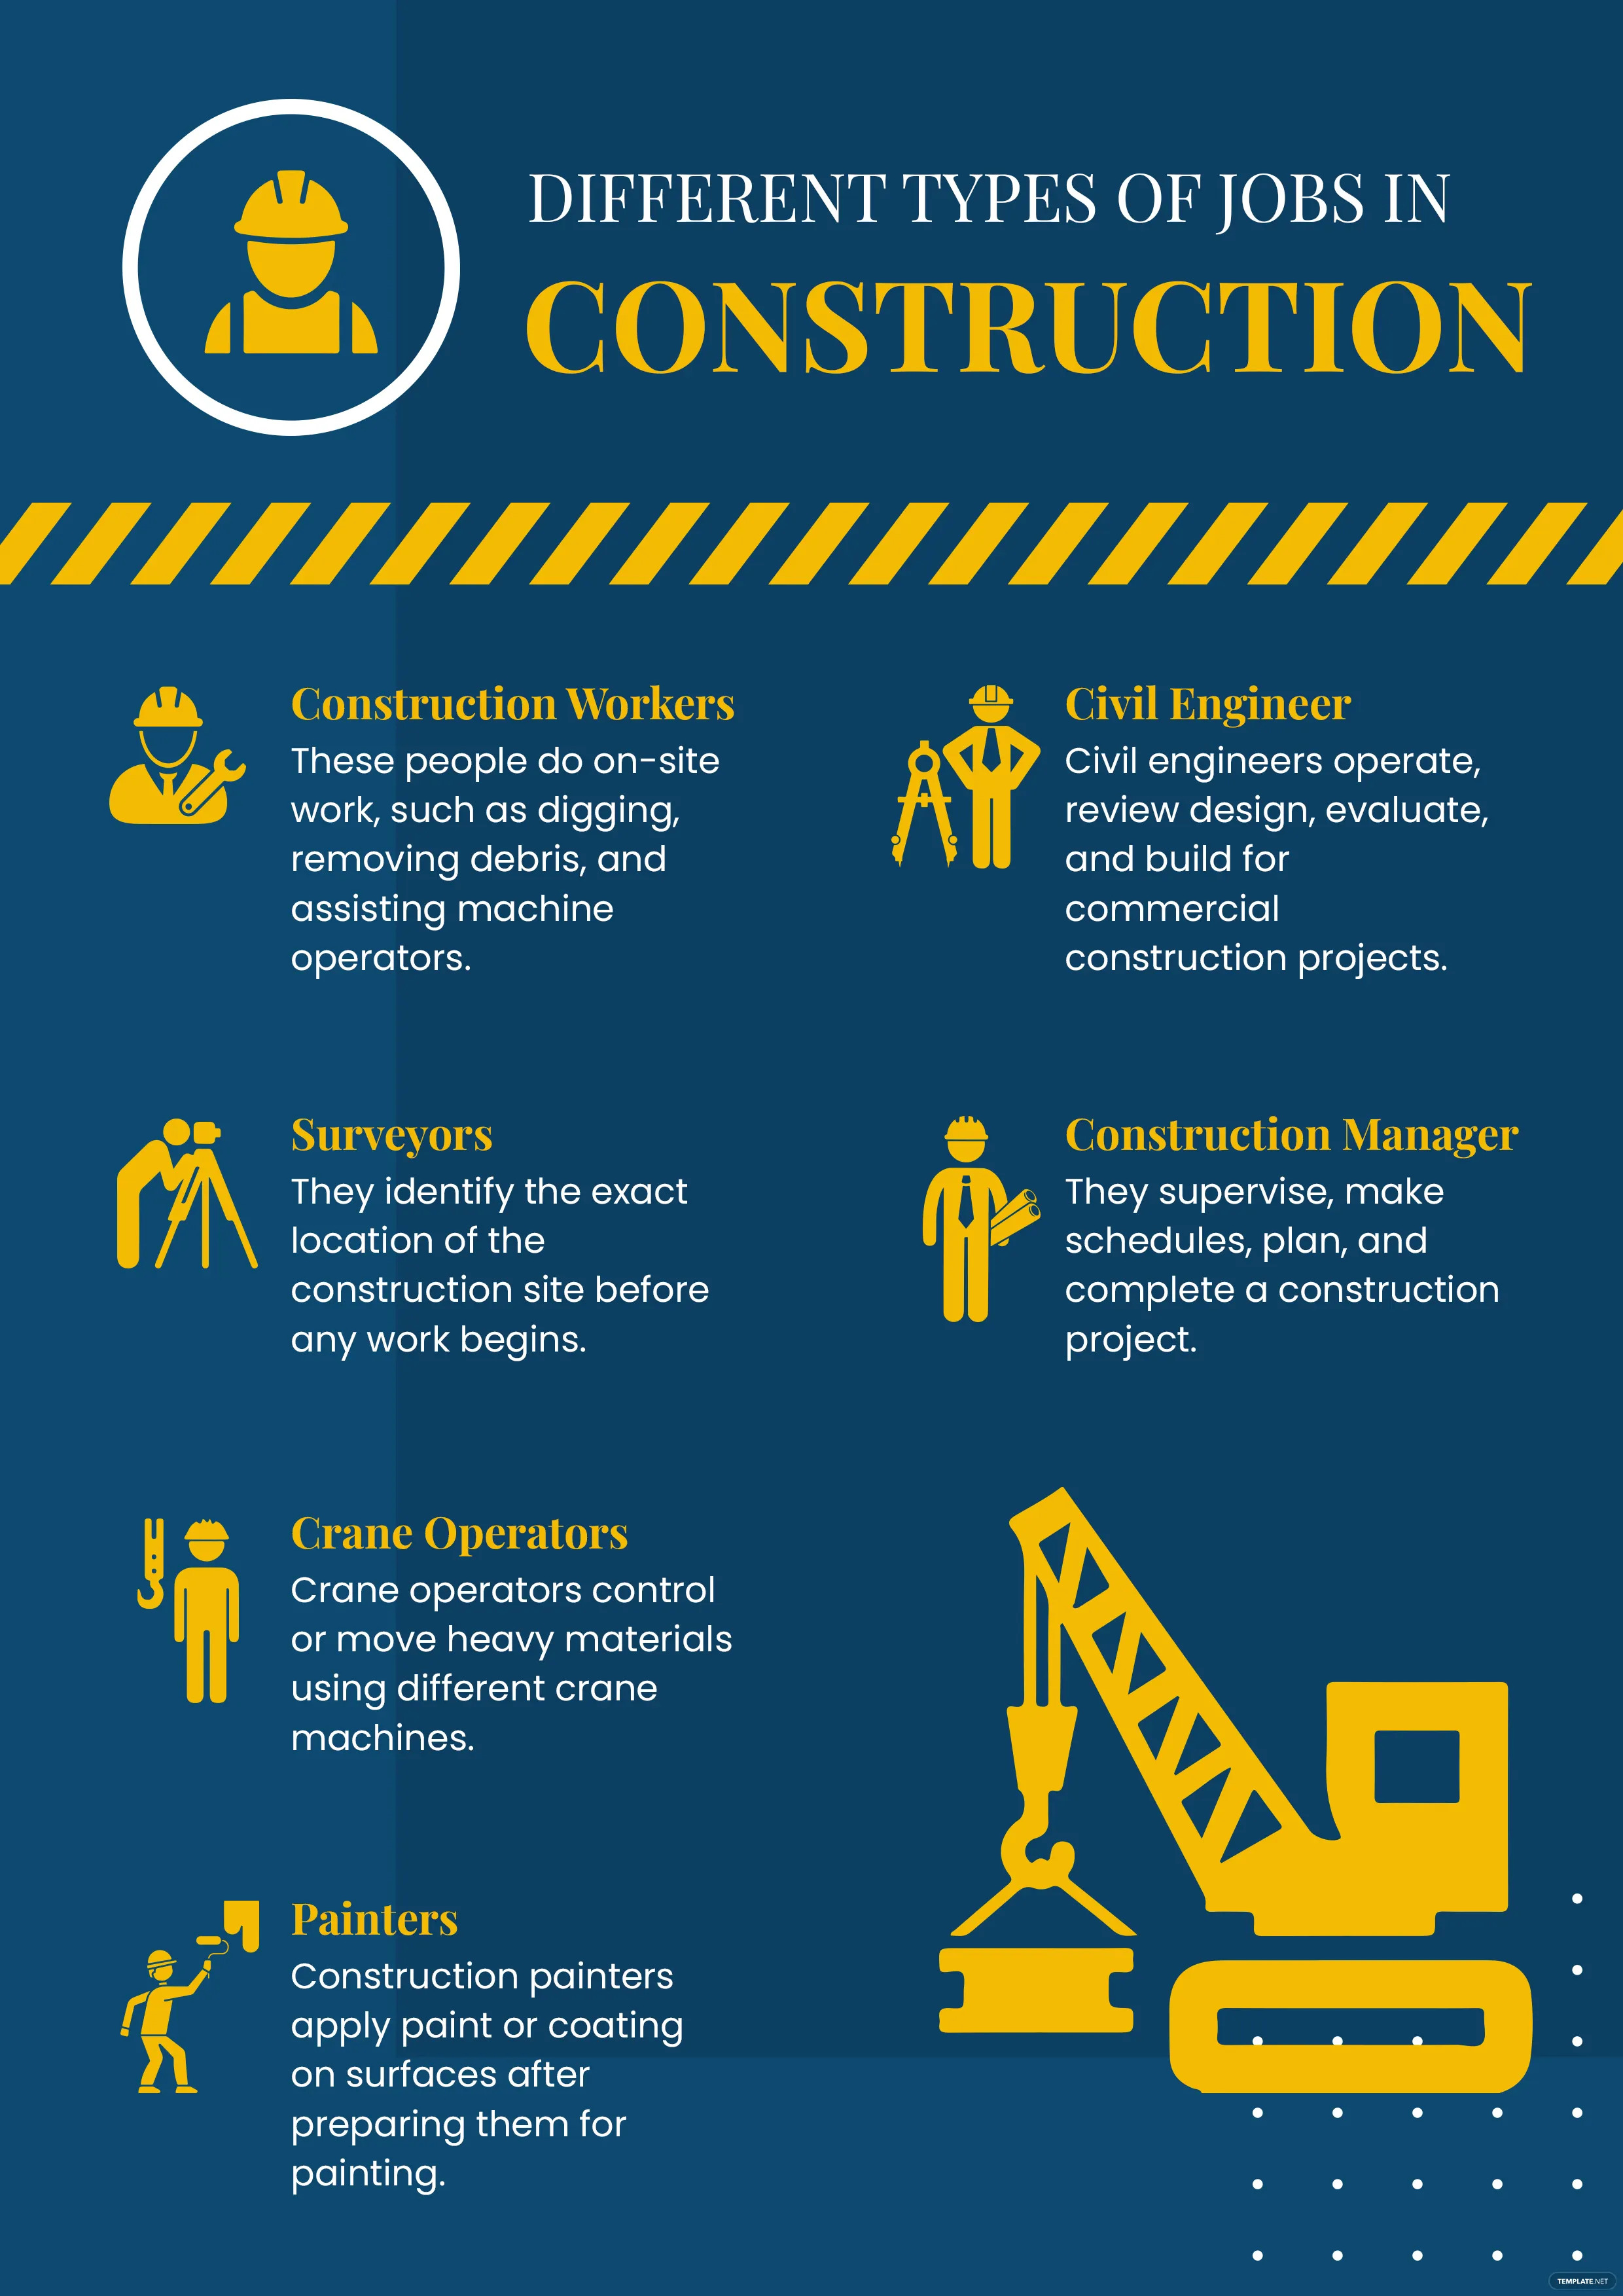
Make a modern and unique infographic when describing the different types of construction jobs such as water treatment, debris removal, crane operation, etc. To assist you in designing the infographic, use a basic building construction infographic template. Customize the template according to your needs and preferences for your work as you add your logo and brand colors to your infographic design.
Infographic Uses, Purpose, Importance
An infographic has multiple uses based on the purpose of the infographic material of a business or an organization. Nowadays, it is widely used in digital content like in blogs and social media pages. Listed below are the common uses, purposes, and importance of infographics.
Brand Awareness
Creating visually appealing infographics is important to reinforce a brand. Having an infographic embedded with your logo and with your business brand prominently displayed is very effective in increasing brand awareness. That’s why many businesses, institutions, social media influences, and content creators showcase their brand value while integrating their brand purpose and services into their infographics.
Informative Guides/Manuals
Infographics are important to internal communication and education. These graphic representations are great in employee guides, product information manuals, food menu guides, social media marketing timeline guides, technology process guides, health and safety booklets, research development process booklets, and/or resource booklets. Academies, schools, colleges, and universities incorporate their service marketing into their infographics.
Marketing and Promotional Tools
Many companies, health facilities, institutions, and organizations use an infographic to market and promote their products, services, and processes to the public. Businesses print company brochures and sell sheets to visualize their products, services, and processes. Through effective infographic marketing, they collect data and reveal their ability, authority, and expertise to solve existing problems.
Increased Blog/Website Traffic
All kinds of infographics published online are immensely shareable for use around the internet. If your infographic is published on a blog or website, it commonly provides an embed code that enables an automatic link from the original website to your blog or website. So, a well-designed infographic generates traffic to your website as your viewers visit your webpage, improving the bounce rate of your site.
Enhanced Search Engine Optimization
As infographics can be easily shared on various social media platforms, it greatly benefits search engine optimization or SEO. It helps your business or organization to become visible on different social media platforms like Facebook, Twitter, LinkedIn, Google+, and Pinterest. A good infographic that enhances SEO must convey a bold and innovative message and has minimal use of words that catches the attention of your target audience.
What’s in an Infographic? Parts?
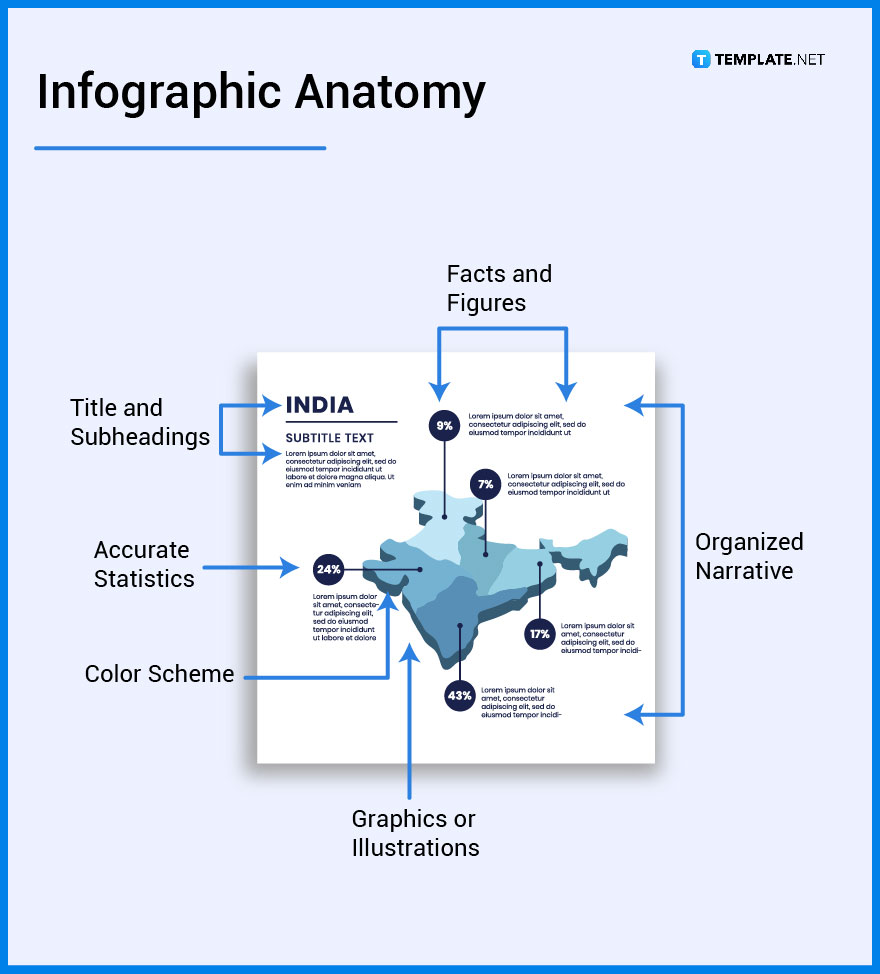
Title and Subheadings
Write a simple yet thought-provoking title and subheadings. Inform your readers of what they need to know right away.
Accurate Statistics
Ensure that you provide accurate, relevant, and valuable statistics. Cite all facts and figures to the legitimate references and sources from which you obtained the information.
Color Scheme
Select a striking color scheme that matches the message you want to convey to the audience. The colors you choose should invoke a certain feeling.
Graphics or Illustrations
Including some eye-catching graphics, or illustrations is a fantastic way to make an enticing infographic. Make your graphics and illustrations stand out from the rest.
Facts and Figures
Highlight the most important facts and figures in your infographic by specially formatting them. You may increase their font size, choose a unique font style, or bold the typeface.
Organized Narrative
The audience is attentive to content with a compelling and organized narrative. Your infographic must be arranged and structured within the right context in a way that they can easily absorb the information.
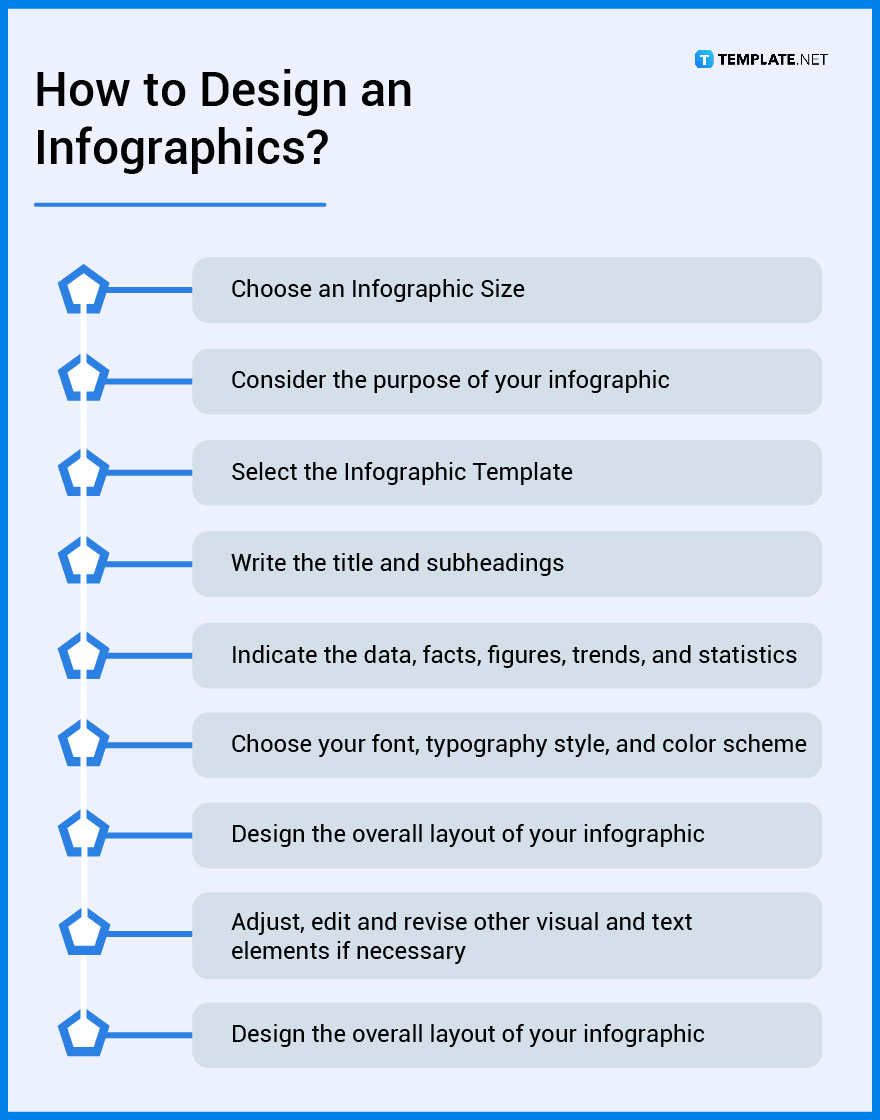
How to Design an Infographic?
1. Choose an Infographic Size
2. Consider the purpose of your infographic
3. Select the Infographics Template
4. Write the title and subheadings
5. Indicate the data, facts, figures, trends, and statistics
6. Choose your font, typography style, and color scheme
7. Design the overall layout of your infographic
8. Adjust, edit and revise other visual and text elements if necessary
9. Finalize and download your work
Infographic vs. Graphic Organizer
An infographic is a visual communication tool that simplifies complex, lengthy data, information, statistics and trends through graphic illustration, large typography and long, vertical orientation.
A graphic organizer is a graphic display that expresses the relationships between facts, ideas, and terms with the use of concept diagrams, knowledge maps, or story map to help individuals classify their ideas in an organized way.
What’s the Difference Between an Infographic, Data Visualization, & Dashboard?
An infographic is an essential visual communication tool that represents specific data, facts, figures, trends, and statistics of a business, or an organization for their advocacy, brand, event, products, and/or services.
A data visualization is a clear graphical representation of data and information with the use of simple charts, graphs, maps, and other data visualization tools to help businesses, organizations, and professionals in observing and analyzing trends, patterns, and outliers in data.
A dashboard is a visual display of one’s data to give primary information at a glance as it obtains information from a linked database.
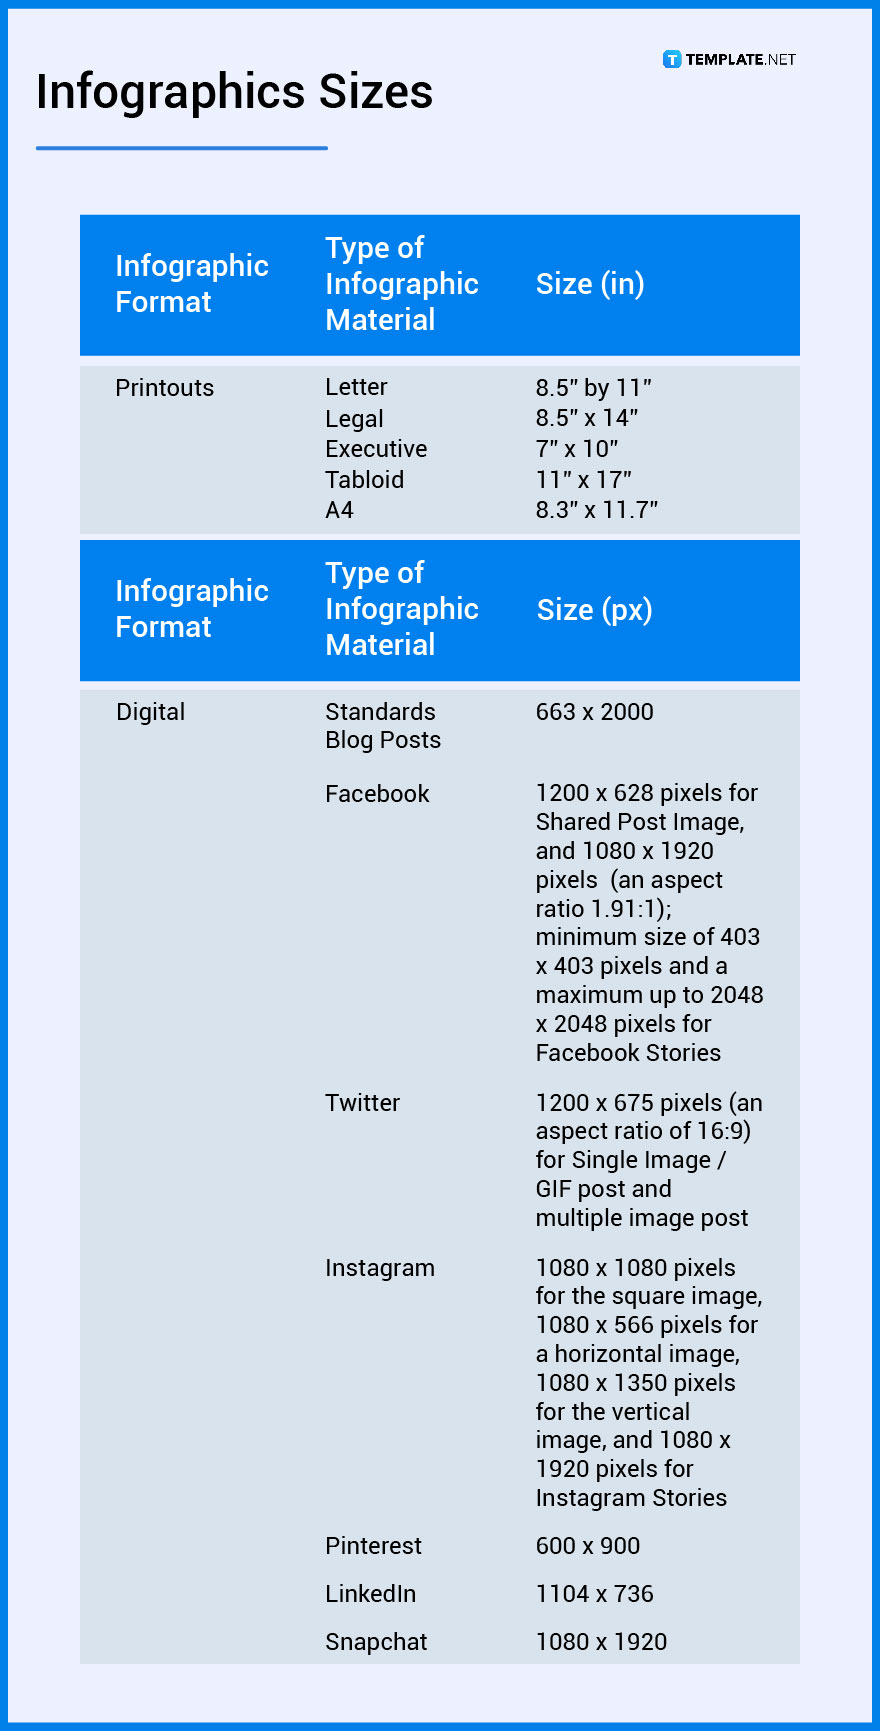
Infographic Sizes
Infographics have a wide array of standard sizes both in digital and physical formats. The infographic size and format are based on the type of infographic material that will be used to present to the public.
Infographic Ideas & Examples
There are numerous ways to demonstrate your creativity and innovation when it comes to designing infographics. Check out the following details for more infographic ideas and design inspiration.
- Marketing Infographic Ideas and Examples
- Art Infographic Ideas and Examples
- Unique Infographic Ideas and Examples
- Product Infographic Ideas and Examples
- Students Infographic Ideas and Examples
- Business Infographic Ideas and Examples
- Social Media Infographic Ideas and Examples
- Events Infographic Ideas and Examples
- Website Infographic Ideas and Examples
- Kids Infographic Ideas and Examples
FAQ
An infographic should include a descriptive title and subheadings, comprehensive statistics, a bold and theme-based color scheme, vivid graphics, a well-structured sequential story, and uniquely formatted facts.
The information presented in the infographic is a visualization of informative data, facts, figures, and statistics, with the use of various charts, graphs, and other graphic representations.
An infographic usually promotes a specific brand, business, event, product, idea, trend, data, and statistics.
An infographic poster is a type of marketing and promotional tool that contains infographics to demonstrate fundamental information.
The standard rules when creating an infographic are to make sure to tell a compelling story, keep things simple, present information in a sensible way, provide context to your data, convey one main idea, and avoid misrepresenting information.
When making an effective infographic, it is important to make a thought-provoking story, maintain simplicity, utilize appropriate data visualization, logically organize the content, avoid text and graphic clutter and select the right color scheme for your infographic material.
Scrutinize the infographic, list down your first impression, identify the major points or arguments that the infographic is trying to convey to its audience and how they are portrayed in the infographic, determine the supporting details for each main argument or point, and examine the connection between the color scheme, font, and images.
An infographic image is a type of image that represents data, information, trends, and statistics.
A well-designed infographic acts as a powerful visual communication tool that helps businesses and organizations in developing eye-catching content and make their brand, products, services, and/or ideas get noticed in a short amount of time.
Go to the SmartArt Graphic Box, choose your preferred SmartArt Graphic Box, and edit infographic text, or you can select an infographic template from their wide selection of infographic templates that fits your current needs and preferences.
What should be included in an infographic?
What information is shown in the infographic?
What is infographic promoting?
What is an infographic poster?
What are the rules for an infographic?
What makes an effective infographic?
How do you analyze an infographic?
What is an infographic image?
What is an infographic supposed to do?
How do you make an infographic on Microsoft Office?
More in Infographic
More in Graphic Design


