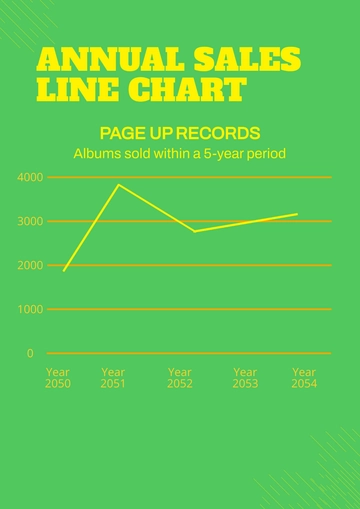
A bold sales line chart for tracking yearly album sales over a five-year period, professionally designed by Template.net, with a bold headline, a yellow line graph and orange gridlines in bright green, yellow and orange.
A bold sales line chart for tracking yearly album sales over a five-year period, professionally designed by Template.net, with a bold headline, a yellow line graph and orange gridlines in bright green, yellow and orange.