Free Advertising E-commerce Campaign Flash Report
Date: [November 20, 2050]
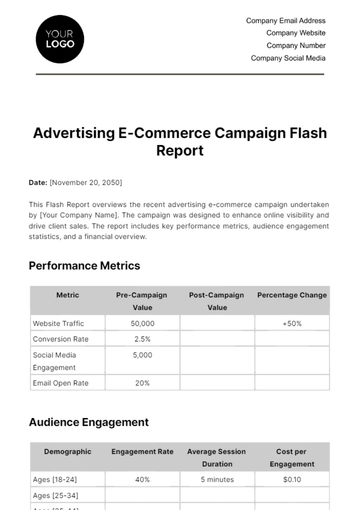
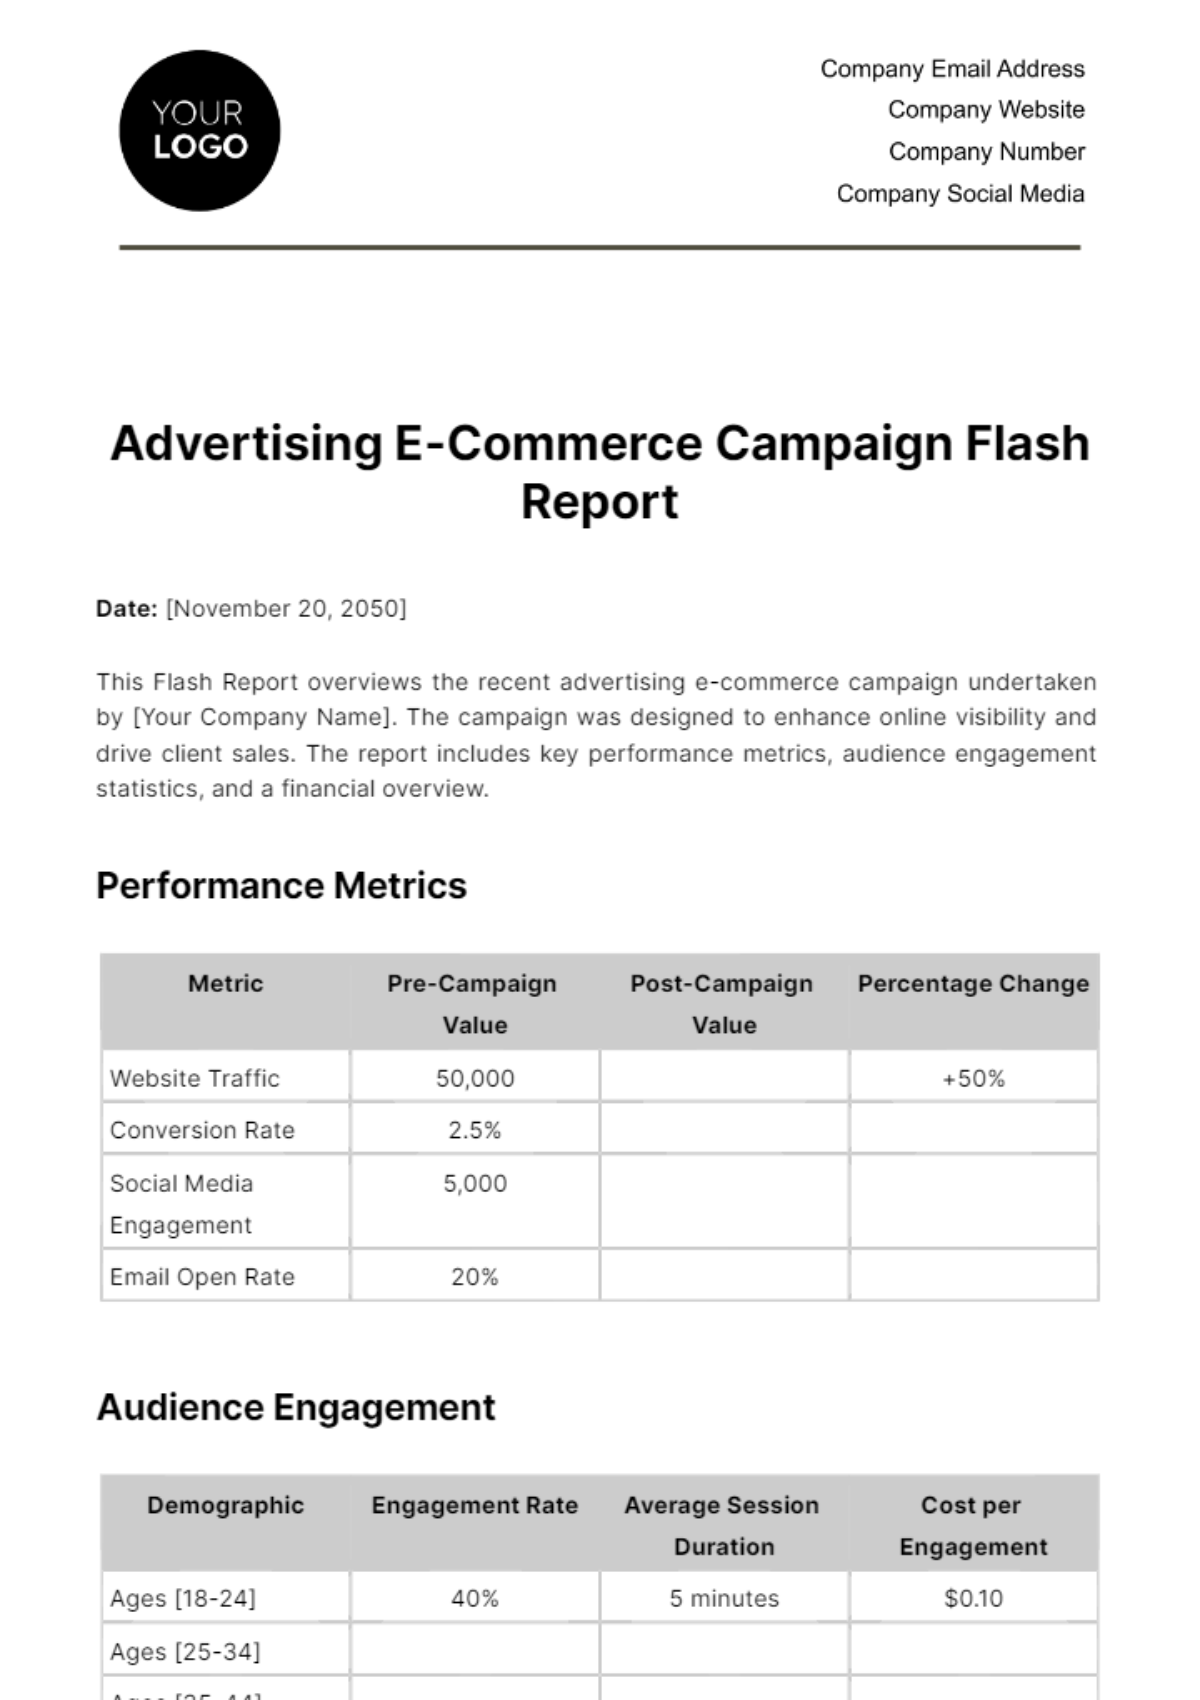
This Flash Report overviews the recent advertising e-commerce campaign undertaken by [Your Company Name]. The campaign was designed to enhance online visibility and drive client sales. The report includes key performance metrics, audience engagement statistics, and a financial overview.
Performance Metrics
Metric | Pre-Campaign Value | Post-Campaign Value | Percentage Change |
Website Traffic | 50,000 | +50% | |
Conversion Rate | 2.5% | ||
Social Media Engagement | 5,000 | ||
Email Open Rate | 20% |
Audience Engagement
Demographic | Engagement Rate | Average Session Duration | Cost per Engagement |
Ages [18-24] | 40% | 5 minutes | $0.10 |
Ages [25-34] | |||
Ages [35-44] | |||
Ages [45 and above] |
Financial Overview
Item | Budget Allocated | Actual Spend | Variance |
Social Media Advertising | $20,000 | $19,000 | -$1,000 |
Email Marketing | |||
Search Engine Marketing | |||
Content Creation |
The campaign achieved its objectives of increasing website traffic, conversion rates, and overall engagement. Notable successes include a [140%] increase in social media interactions and a [60%] improvement in conversion rates. The overall gains in performance metrics offset the slight over-expenditure in the budget.
- 100% Customizable, free editor
- Access 1 Million+ Templates, photo’s & graphics
- Download or share as a template
- Click and replace photos, graphics, text, backgrounds
- Resize, crop, AI write & more
- Access advanced editor
Discover the ultimate solution for analyzing e-commerce campaigns with Template.net's Advertising E-commerce Campaign Flash Report Template. This editable and customizable tool empowers users to swiftly assess campaign performance with precision. Crafted with an intuitive AI Editor Tool, it streamlines data interpretation, offering actionable insights for optimizing future strategies. Maximize your campaign's potential with ease and efficiency.
You may also like
- Sales Report
- Daily Report
- Project Report
- Business Report
- Weekly Report
- Incident Report
- Annual Report
- Report Layout
- Report Design
- Progress Report
- Marketing Report
- Company Report
- Monthly Report
- Audit Report
- Status Report
- School Report
- Reports Hr
- Management Report
- Project Status Report
- Handover Report
- Health And Safety Report
- Restaurant Report
- Construction Report
- Research Report
- Evaluation Report
- Investigation Report
- Employee Report
- Advertising Report
- Weekly Status Report
- Project Management Report
- Finance Report
- Service Report
- Technical Report
- Meeting Report
- Quarterly Report
- Inspection Report
- Medical Report
- Test Report
- Summary Report
- Inventory Report
- Valuation Report
- Operations Report
- Payroll Report
- Training Report
- Job Report
- Case Report
- Performance Report
- Board Report
- Internal Audit Report
- Student Report
- Monthly Management Report
- Small Business Report
- Accident Report
- Call Center Report
- Activity Report
- IT and Software Report
- Internship Report
- Visit Report
- Product Report
- Book Report
- Property Report
- Recruitment Report
- University Report
- Event Report
- SEO Report
- Conference Report
- Narrative Report
- Nursing Home Report
- Preschool Report
- Call Report
- Customer Report
- Employee Incident Report
- Accomplishment Report
- Social Media Report
- Work From Home Report
- Security Report
- Damage Report
- Quality Report
- Internal Report
- Nurse Report
- Real Estate Report
- Hotel Report
- Equipment Report
- Credit Report
- Field Report
- Non Profit Report
- Maintenance Report
- News Report
- Survey Report
- Executive Report
- Law Firm Report
- Advertising Agency Report
- Interior Design Report
- Travel Agency Report
- Stock Report
- Salon Report
- Bug Report
- Workplace Report
- Action Report
- Investor Report
- Cleaning Services Report
- Consulting Report
- Freelancer Report
- Site Visit Report
- Trip Report
- Classroom Observation Report
- Vehicle Report
- Final Report
- Software Report
