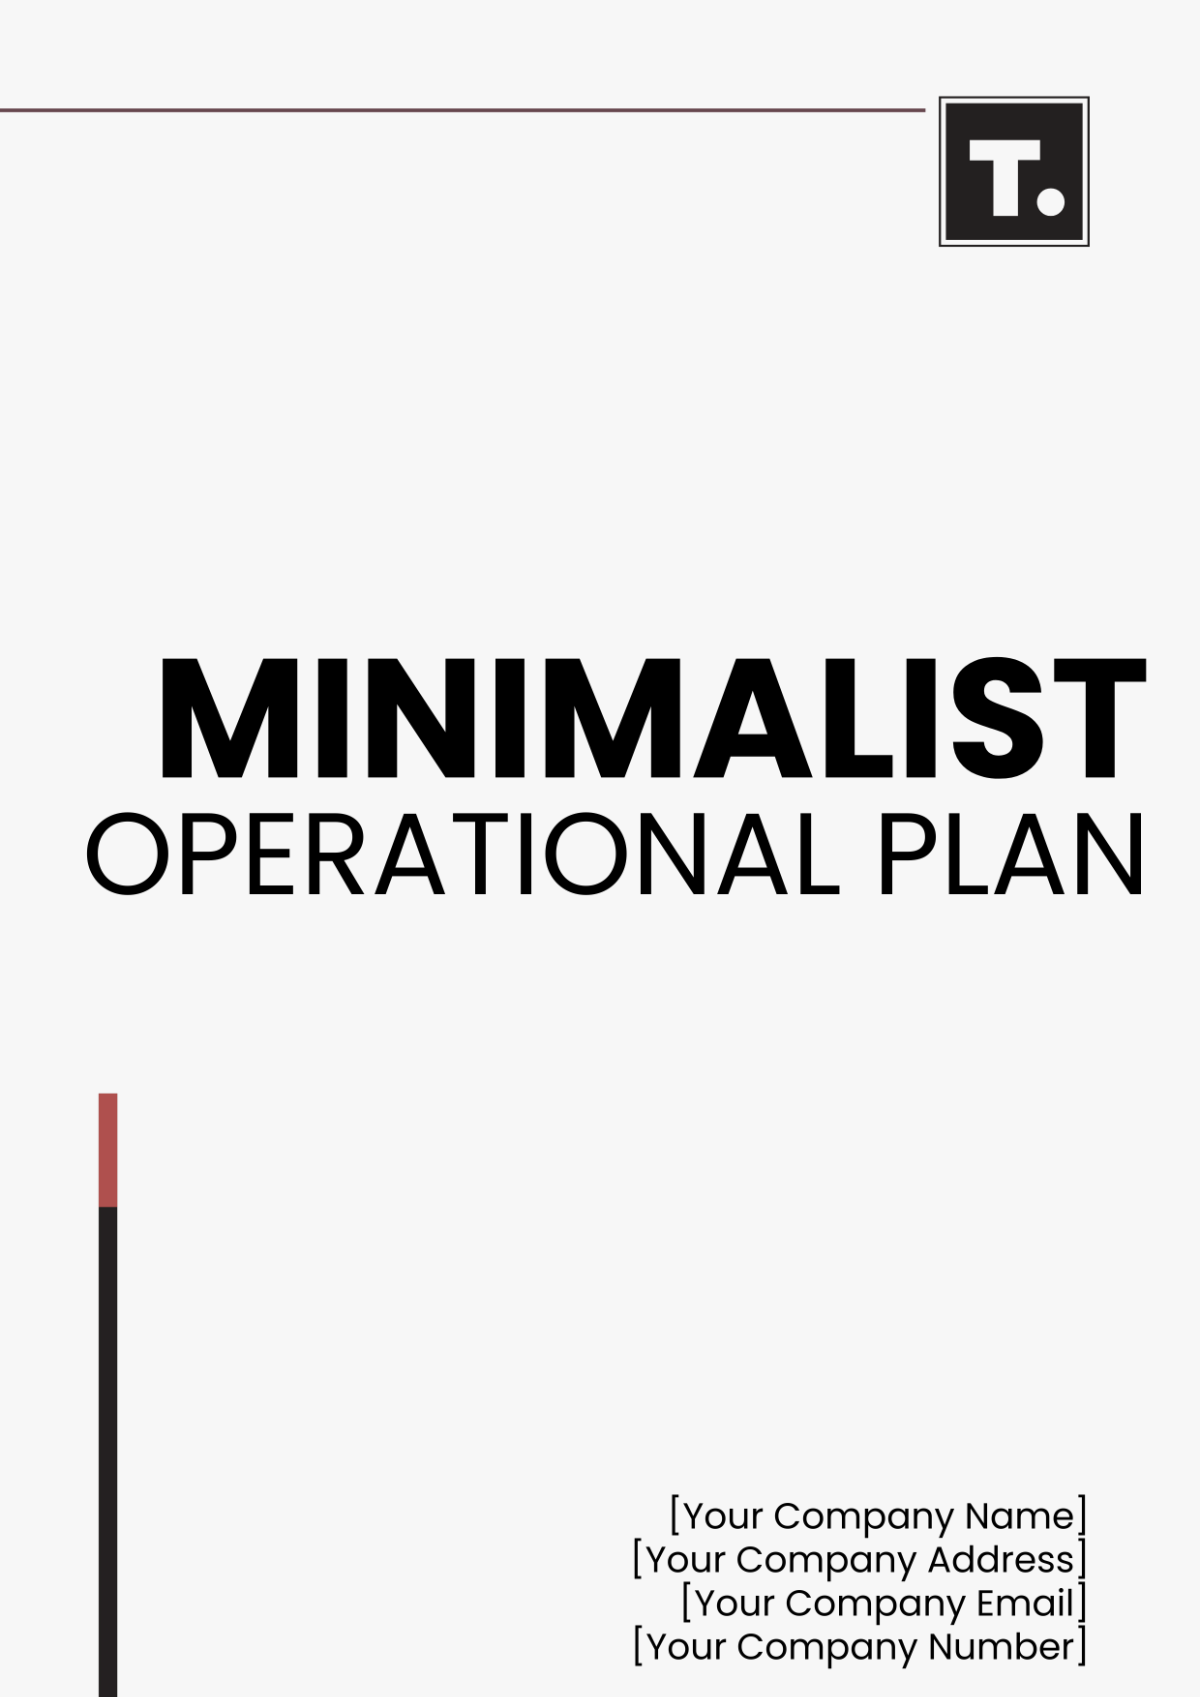
Free Minimalist Operational Plan
I. Executive Summary
The Minimalist Operational Plan outlines the essential strategies and tactics to achieve operational objectives efficiently and effectively. This concise plan provides a streamlined framework for guiding daily activities and ensuring alignment with organizational goals.
II. Objectives
The primary objectives of the Minimalist Operational Plan are:
Increase market share by 15% within the next two years.
Improve customer satisfaction ratings to 90% by the end of the fiscal year 2052.
Streamline operational processes to reduce costs by 10% by 2053.
III. Key Strategies
A. Market Expansion
Launch targeted marketing campaigns to reach new demographics.
Strengthen partnerships with distributors to enhance product reach.
B. Customer Experience Enhancement
Implement customer feedback mechanisms for continuous improvement.
Train frontline staff to deliver exceptional service experiences.
C. Operational Efficiency
Automate repetitive tasks to increase productivity.
Optimize supply chain management to minimize delays and reduce costs.
IV. Action Plan
A. Market Expansion
Conduct market research to identify untapped segments. (Due Date: March 2050)
Develop personalized marketing strategies for each target demographic. (Due Date: June 2050)
B. Customer Experience Enhancement
Launch customer satisfaction survey program. (Due Date: April 2050)
Provide ongoing training sessions for frontline staff. (Due Date: May 2050)
C. Operational Efficiency
Evaluate current processes for automation opportunities. (Due Date: July 2050)
Implement software solutions for supply chain optimization. (Due Date: September 2050)
V. Resource Allocation
The allocation of resources for the Minimalist Operational Plan includes:
Human Resources: 20 staff members dedicated to plan implementation.
Financial Resources: A Budget of $500,000 was allocated for marketing and technology investments.
Material Resources: Procurement of new software tools to support operational improvements.
VI. Monitoring and Evaluation
Regular monitoring and evaluation will be conducted to track progress and make adjustments as necessary. Key performance indicators (KPIs) include:
Market share growth
Customer satisfaction ratings
Cost reduction achievements
VII. Risk Management
Identified risks and mitigation strategies:
Market competition: Continuous market analysis to anticipate competitor actions.
Technology disruptions: Regular updates and backups to prevent data loss.
VIII. Communication Plan
Effective communication channels will be established to ensure all stakeholders are informed and engaged throughout the implementation process.
IX. Financial Projections
Year | Revenue (USD) | Expenses (USD) | Profit (USD) |
|---|---|---|---|
2050 | $2,000,000 | $1,500,000 | $500,000 |
2051 | $2,500,000 | $1,700,000 | $800,000 |
2052 | $3,000,000 | $1,800,000 | $1,200,000 |
X. SWOT Analysis
Strengths | Weaknesses |
|---|---|
- Strong brand | - Limited market reach |
- Innovative products | - High production costs |
Opportunities | Threats |
|---|---|
- Emerging markets | - Intense competition |
- Technological advancements | - Economic downturns |
- 100% Customizable, free editor
- Access 1 Million+ Templates, photo’s & graphics
- Download or share as a template
- Click and replace photos, graphics, text, backgrounds
- Resize, crop, AI write & more
- Access advanced editor
Introducing the Minimalist Operational Plan Template, a sleek and straightforward document designed by Template.net for streamlined operational planning. This minimalist template focuses on essential elements such as goals, strategies, tasks, timelines, and responsibilities, without unnecessary clutter. With a clean and uncluttered layout, it allows users to easily input key information and customize the plan to their specific needs. Whether you're managing a small business, a project, or an event, this template helps you stay organized and focused on what matters most. Simplify your operational planning process and achieve your goals efficiently with the Minimalist Operational Plan Template.
You may also like
- Finance Plan
- Construction Plan
- Sales Plan
- Development Plan
- Career Plan
- Budget Plan
- HR Plan
- Education Plan
- Transition Plan
- Work Plan
- Training Plan
- Communication Plan
- Operation Plan
- Health And Safety Plan
- Strategy Plan
- Professional Development Plan
- Advertising Plan
- Risk Management Plan
- Restaurant Plan
- School Plan
- Nursing Home Patient Care Plan
- Nursing Care Plan
- Plan Event
- Startup Plan
- Social Media Plan
- Staffing Plan
- Annual Plan
- Content Plan
- Payment Plan
- Implementation Plan
- Hotel Plan
- Workout Plan
- Accounting Plan
- Campaign Plan
- Essay Plan
- 30 60 90 Day Plan
- Research Plan
- Recruitment Plan
- 90 Day Plan
- Quarterly Plan
- Emergency Plan
- 5 Year Plan
- Gym Plan
- Personal Plan
- IT and Software Plan
- Treatment Plan
- Real Estate Plan
- Law Firm Plan
- Healthcare Plan
- Improvement Plan
- Media Plan
- 5 Year Business Plan
- Learning Plan
- Marketing Campaign Plan
- Travel Agency Plan
- Cleaning Services Plan
- Interior Design Plan
- Performance Plan
- PR Plan
- Birth Plan
- Life Plan
- SEO Plan
- Disaster Recovery Plan
- Continuity Plan
- Launch Plan
- Legal Plan
- Behavior Plan
- Performance Improvement Plan
- Salon Plan
- Security Plan
- Security Management Plan
- Employee Development Plan
- Quality Plan
- Service Improvement Plan
- Growth Plan
- Incident Response Plan
- Basketball Plan
- Emergency Action Plan
- Product Launch Plan
- Spa Plan
- Employee Training Plan
- Data Analysis Plan
- Employee Action Plan
- Territory Plan
- Audit Plan
- Classroom Plan
- Activity Plan
- Parenting Plan
- Care Plan
- Project Execution Plan
- Exercise Plan
- Internship Plan
- Software Development Plan
- Continuous Improvement Plan
- Leave Plan
- 90 Day Sales Plan
- Advertising Agency Plan
- Employee Transition Plan
- Smart Action Plan
- Workplace Safety Plan
- Behavior Change Plan
- Contingency Plan
- Continuity of Operations Plan
- Health Plan
- Quality Control Plan
- Self Plan
- Sports Development Plan
- Change Management Plan
- Ecommerce Plan
- Personal Financial Plan
- Process Improvement Plan
- 30-60-90 Day Sales Plan
- Crisis Management Plan
- Engagement Plan
- Execution Plan
- Pandemic Plan
- Quality Assurance Plan
- Service Continuity Plan
- Agile Project Plan
- Fundraising Plan
- Job Transition Plan
- Asset Maintenance Plan
- Maintenance Plan
- Software Test Plan
- Staff Training and Development Plan
- 3 Year Plan
- Brand Activation Plan
- Release Plan
- Resource Plan
- Risk Mitigation Plan
- Teacher Plan
- 30 60 90 Day Plan for New Manager
- Food Safety Plan
- Food Truck Plan
- Hiring Plan
- Quality Management Plan
- Wellness Plan
- Behavior Intervention Plan
- Bonus Plan
- Investment Plan
- Maternity Leave Plan
- Pandemic Response Plan
- Succession Planning
- Coaching Plan
- Configuration Management Plan
- Remote Work Plan
- Self Care Plan
- Teaching Plan
- 100-Day Plan
- HACCP Plan
- Student Plan
- Sustainability Plan
- 30 60 90 Day Plan for Interview
- Access Plan
- Site Specific Safety Plan
