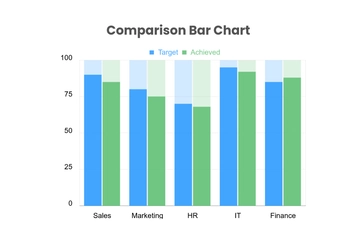
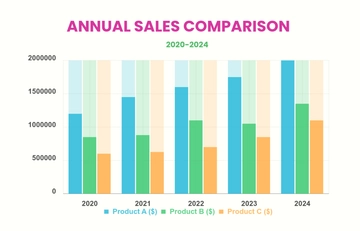
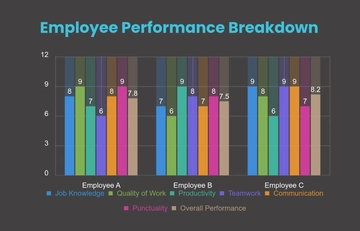
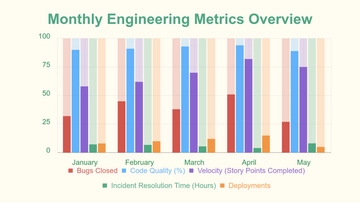
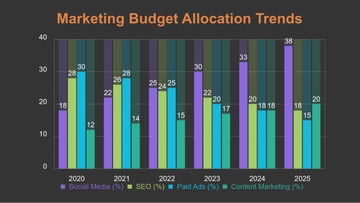
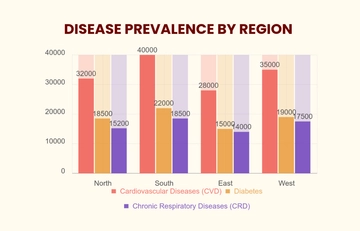
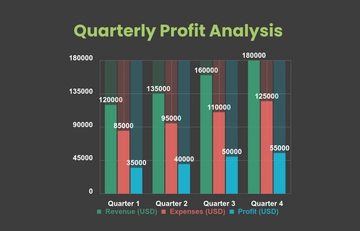
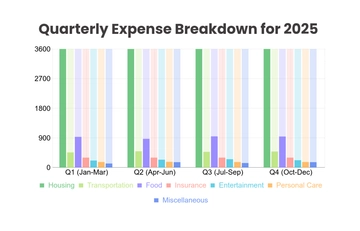
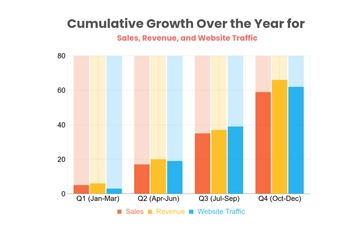
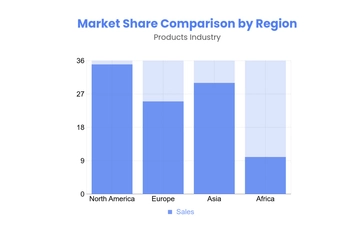
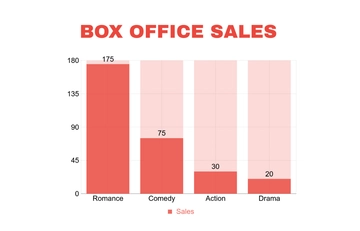
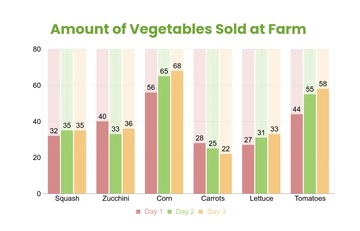
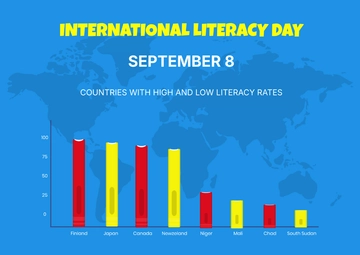
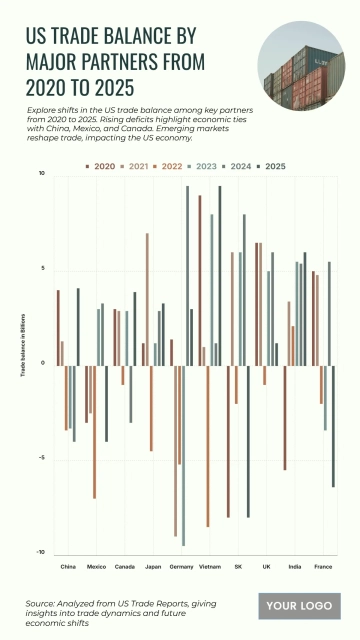
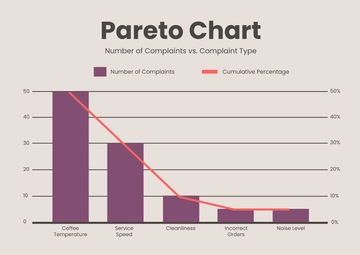
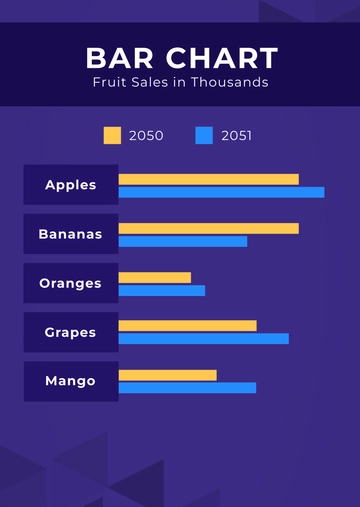
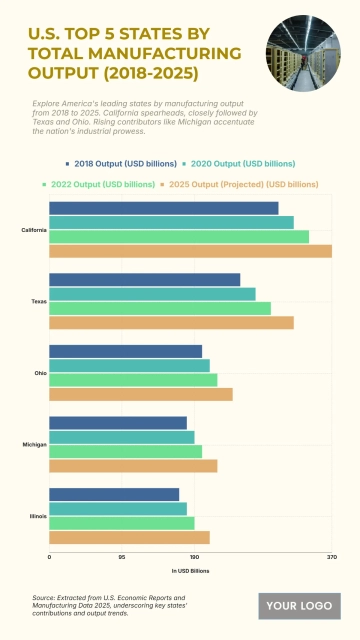
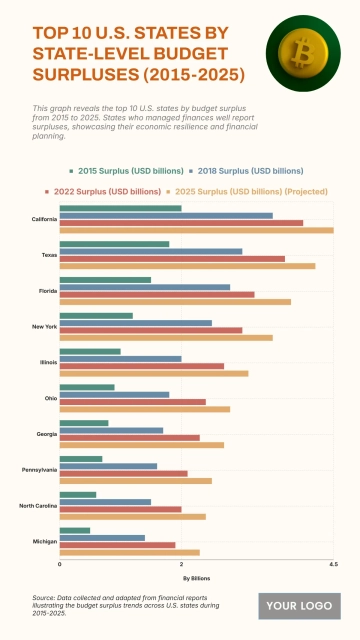
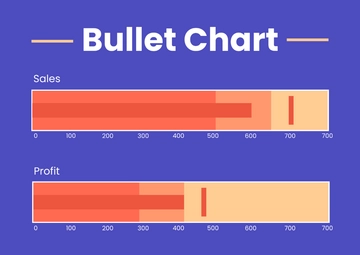
A playful bar graph chart for comparing yearly sales across several products, professionally designed by Template.net, with a grouped bar chart, a bold headline and a colour-coded legend in sky blue, mint green and soft orange.
A playful bar graph chart for comparing yearly sales across several products, professionally designed by Template.net, with a grouped bar chart, a bold headline and a colour-coded legend in sky blue, mint green and soft orange.