Free Top 10 U.S. States by State-Level Budget Surpluses (2015-2025)
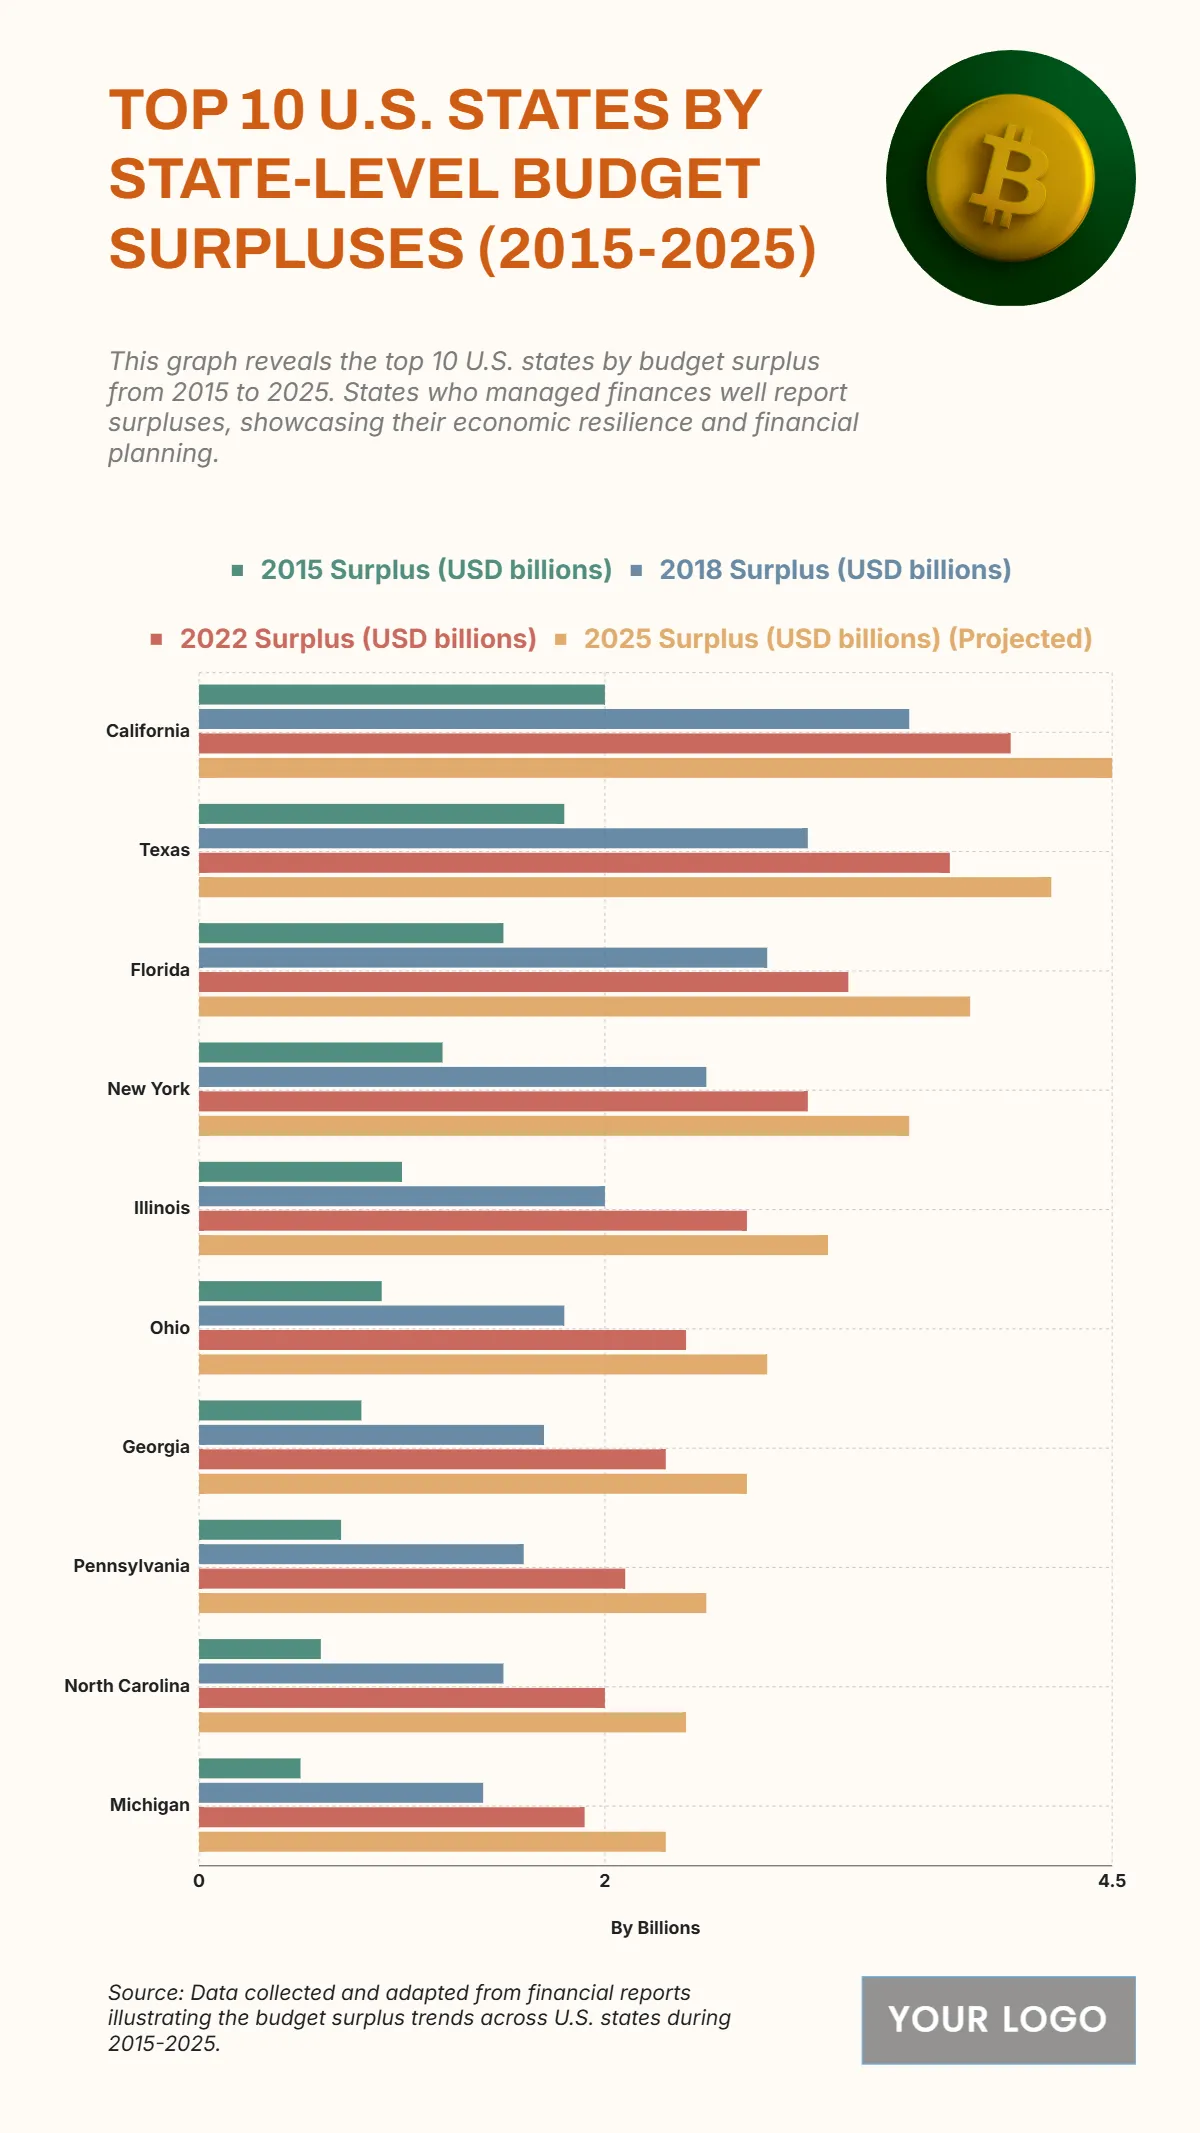
The chart highlights the top U.S. states maintaining strong budget surpluses from 2015 to 2025, showing consistent fiscal growth and financial resilience. California remains the leader, increasing its surplus from $2.0 billion in 2015 to $4.0 billion in 2022, with a projected $4.5 billion in 2025. Texas follows closely, rising from $1.8 billion to $3.7 billion, reaching $4.2 billion by 2025. Florida also shows strong performance, climbing from $1.5 billion to $3.2 billion, projected to hit $3.8 billion. New York grows from $1.2 billion to $3.0 billion, with a $3.5 billion projection. Other states, including Illinois ($1.0B to $2.7B), Ohio ($0.9B to $2.4B), and Georgia ($0.8B to $2.3B), exhibit steady fiscal strengthening. Pennsylvania, North Carolina, and Michigan follow with more modest surpluses but clear upward trajectories, reaching $2.5B, $2.4B, and $2.3B in 2025, respectively.
| Labels | 2015 Surplus (USD billions) | 2018 Surplus (USD billions) | 2022 Surplus (USD billions) | 2025 Surplus (USD billions) (Projected) |
|---|---|---|---|---|
| California | 2.0 | 3.5 | 4.0 | 4.5 |
| Texas | 1.8 | 3.0 | 3.7 | 4.2 |
| Florida | 1.5 | 2.8 | 3.2 | 3.8 |
| New York | 1.2 | 2.5 | 3.0 | 3.5 |
| Illinois | 1.0 | 2.0 | 2.7 | 3.1 |
| Ohio | 0.9 | 1.8 | 2.4 | 2.8 |
| Georgia | 0.8 | 1.7 | 2.3 | 2.7 |
| Pennsylvania | 0.7 | 1.6 | 2.1 | 2.5 |
| North Carolina | 0.6 | 1.5 | 2.0 | 2.4 |
| Michigan | 0.5 | 1.4 | 1.9 | 2.3 |


