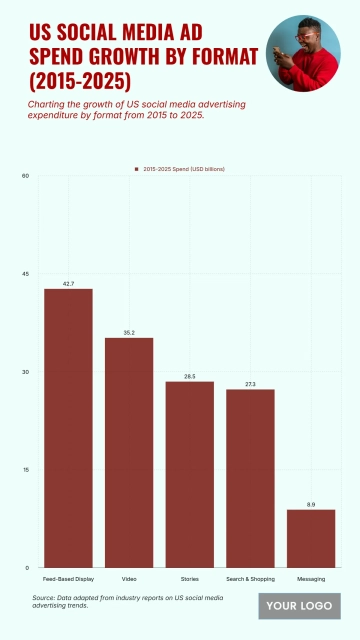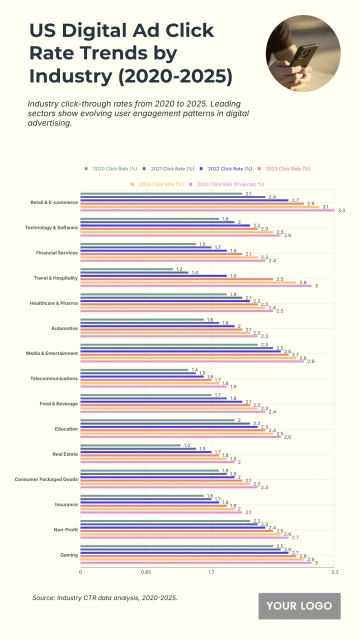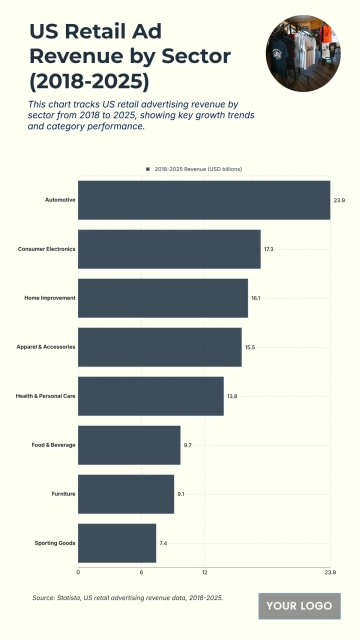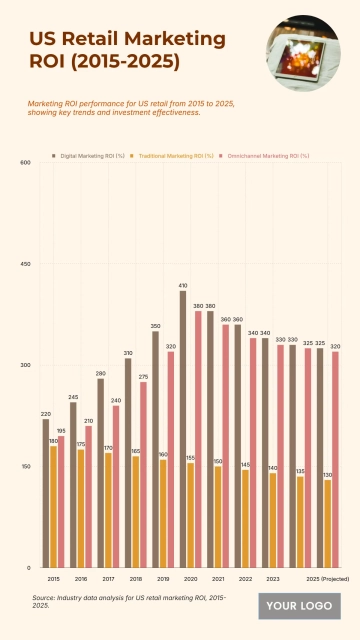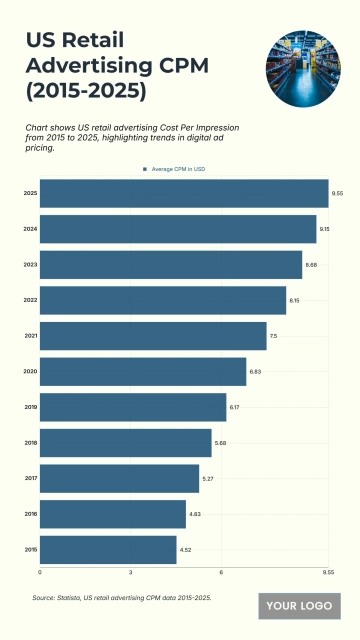
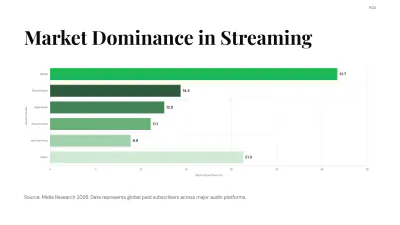
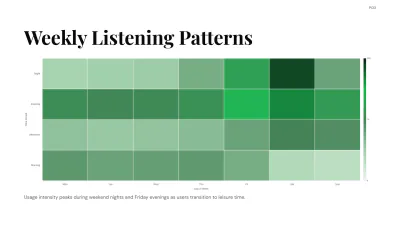
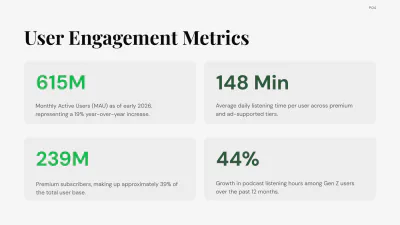
A modern 16:9 chart presentation for analyzing music streaming usage, professionally designed by Template.net, with a bar chart, a weekly heatmap and engagement metric cards in deep forest green, bright green and clean white.
A modern 16:9 chart presentation for analyzing music streaming usage, professionally designed by Template.net, with a bar chart, a weekly heatmap and engagement metric cards in deep forest green, bright green and clean white.