Free Top 10 States by Change in Workforce Productivity (2018–2025)
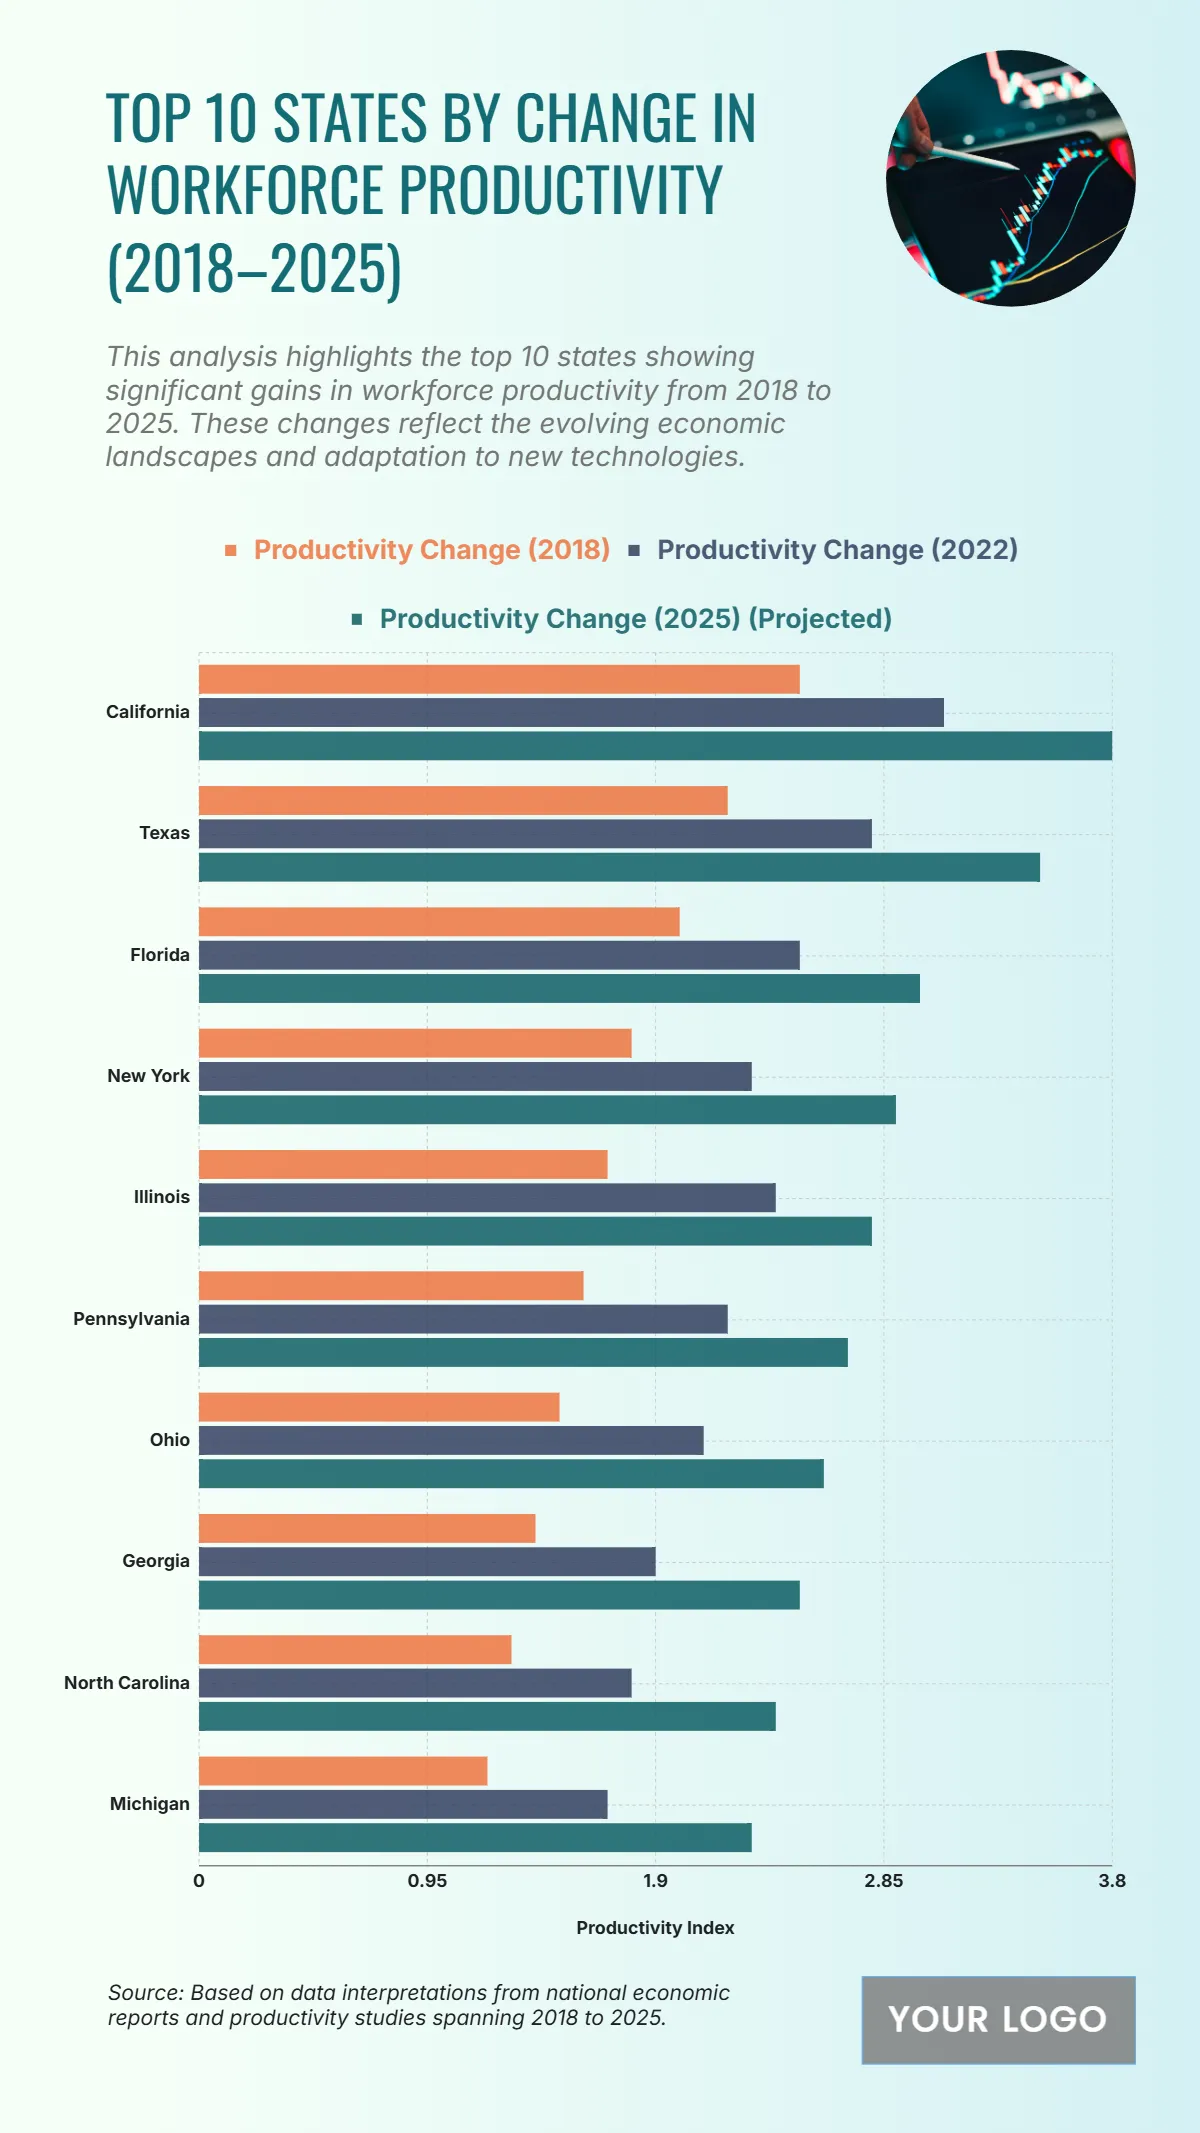
The chart shows the states with the greatest gains in workforce productivity between 2018 and 2025, reflecting technological adaptation and economic expansion. California stands out with a growth from 2.5 in 2018 to 3.8 in 2025, marking the highest improvement. Texas follows, rising from 2.2 to 3.5, while Florida climbs from 2.0 to 3.0, demonstrating strong workforce efficiency advancements. New York improves from 1.8 to 2.9, Illinois from 1.7 to 2.8, and Pennsylvania from 1.6 to 2.7. Ohio progresses from 1.5 to 2.6, Georgia from 1.4 to 2.5, North Carolina from 1.3 to 2.4, and Michigan from 1.2 to 2.3, highlighting notable productivity growth across all states. This upward trend illustrates a broad national shift toward more productive labor markets supported by economic investments and innovation.
| Labels | Productivity Change (2018) | Productivity Change (2022) | Productivity Change (2025) (Projected) |
|---|---|---|---|
| California | 2.5 | 3.1 | 3.8 |
| Texas | 2.2 | 2.8 | 3.5 |
| Florida | 2.0 | 2.5 | 3.0 |
| New York | 1.8 | 2.3 | 2.9 |
| Illinois | 1.7 | 2.4 | 2.8 |
| Pennsylvania | 1.6 | 2.2 | 2.7 |
| Ohio | 1.5 | 2.1 | 2.6 |
| Georgia | 1.4 | 1.9 | 2.5 |
| North Carolina | 1.3 | 1.8 | 2.4 |
| Michigan | 1.2 | 1.7 | 2.3 |


