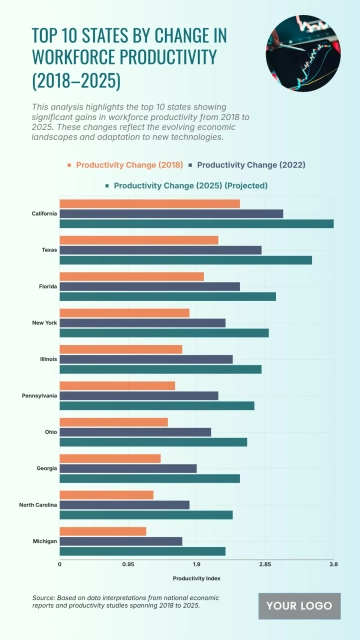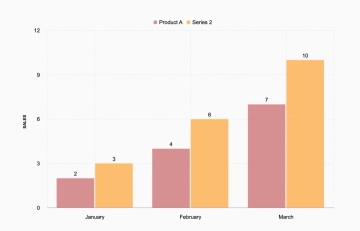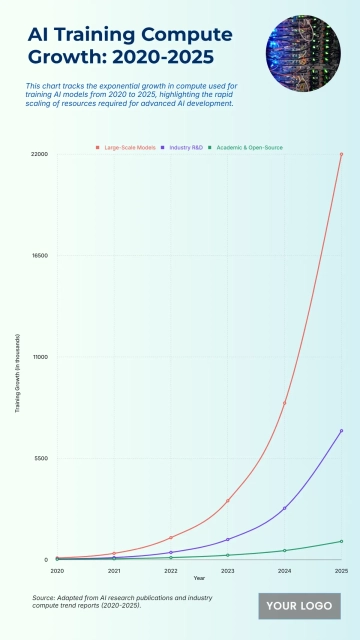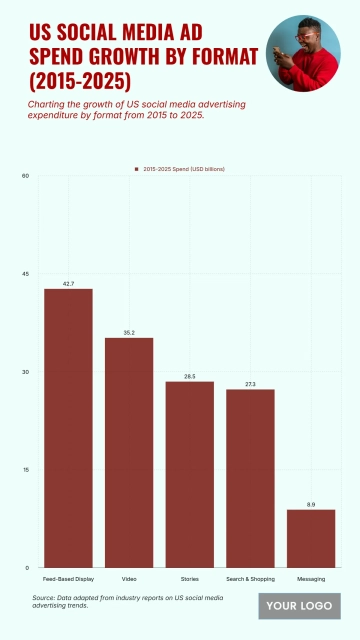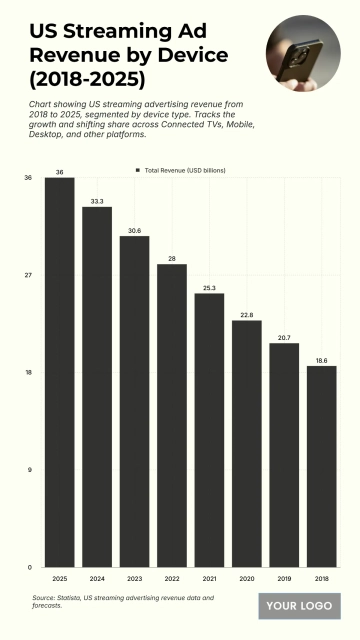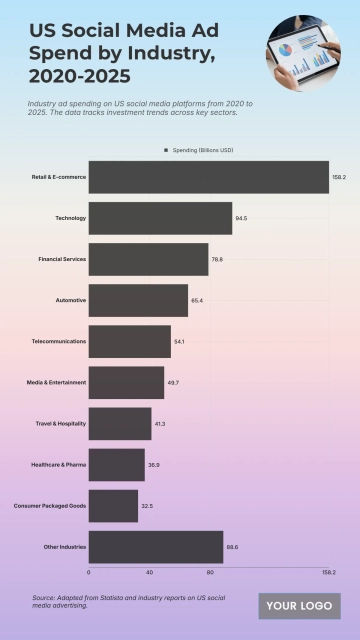
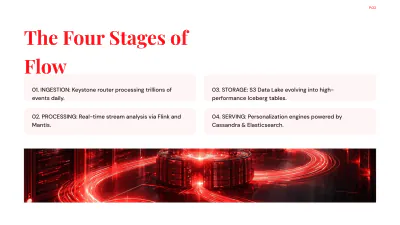
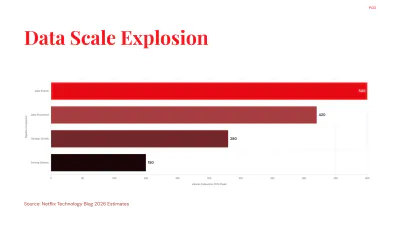
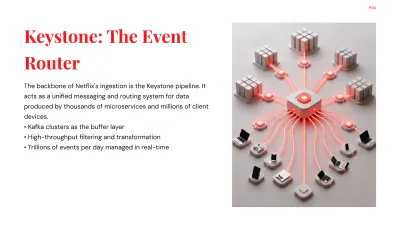

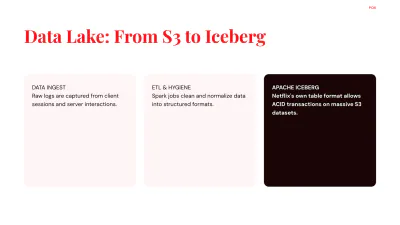

A bold 16:9 chart presentation for explaining a streaming data pipeline, professionally designed by Template.net, with a bar chart, glowing server illustrations and info cards across seven pages in vivid red, near-black and white.
A bold 16:9 chart presentation for explaining a streaming data pipeline, professionally designed by Template.net, with a bar chart, glowing server illustrations and info cards across seven pages in vivid red, near-black and white.