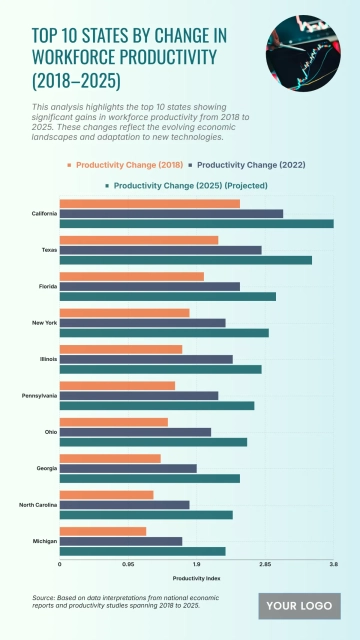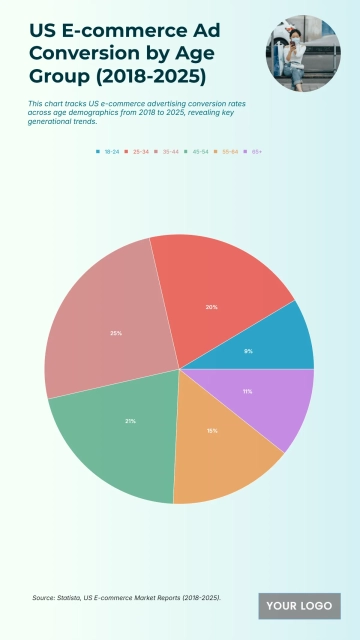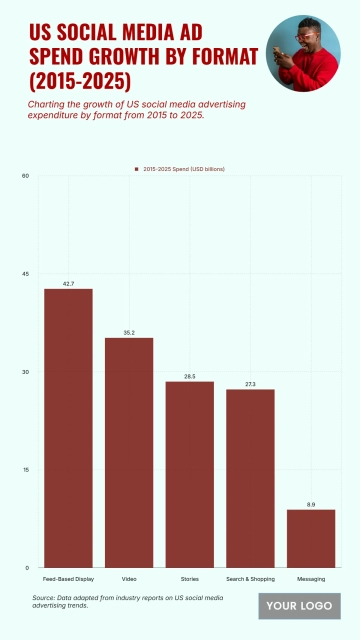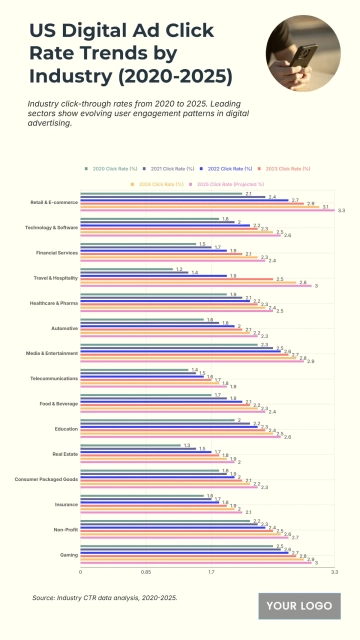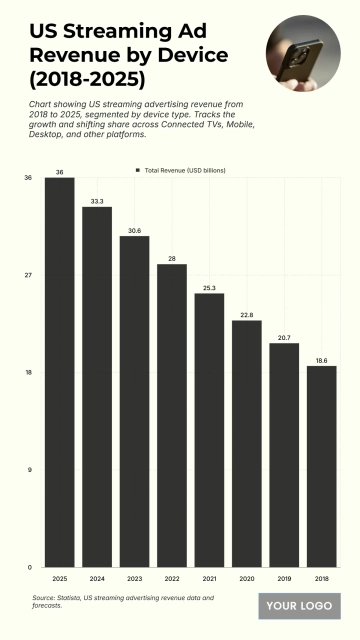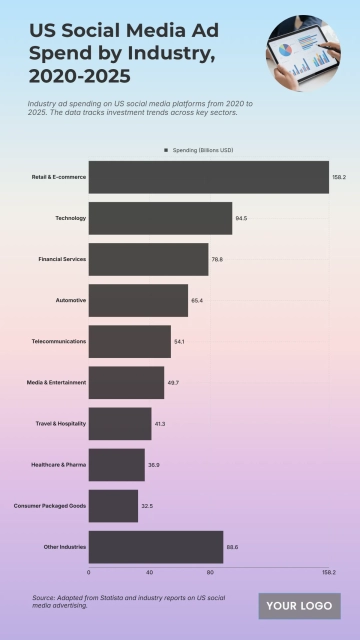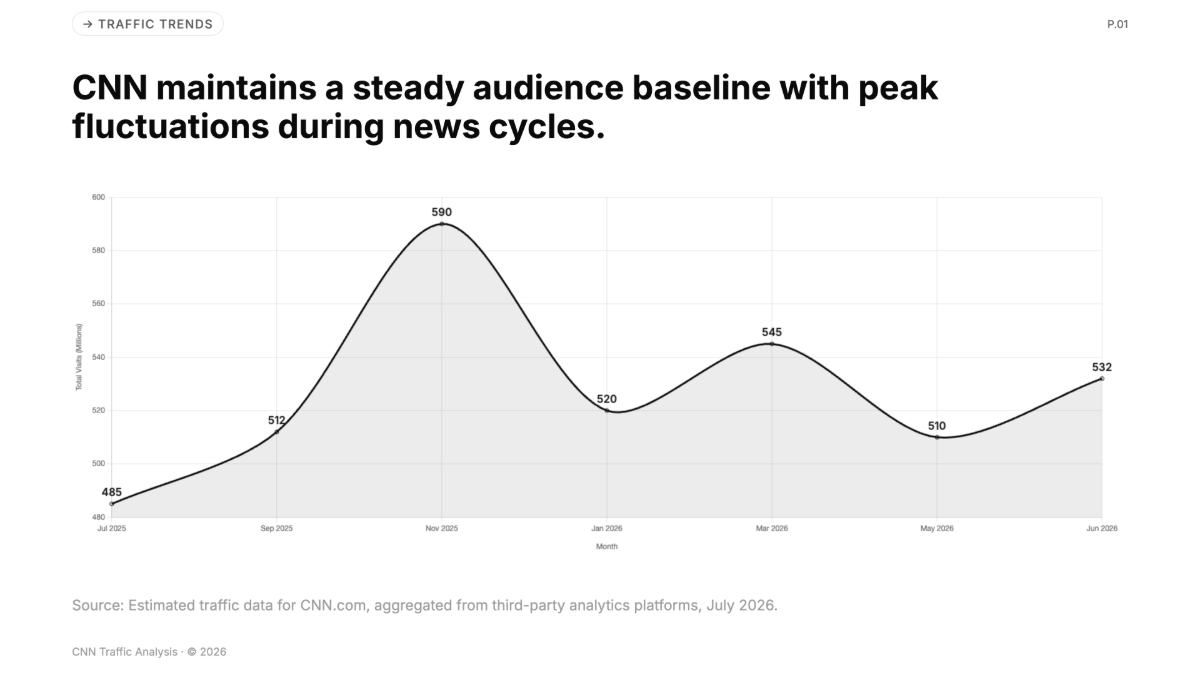
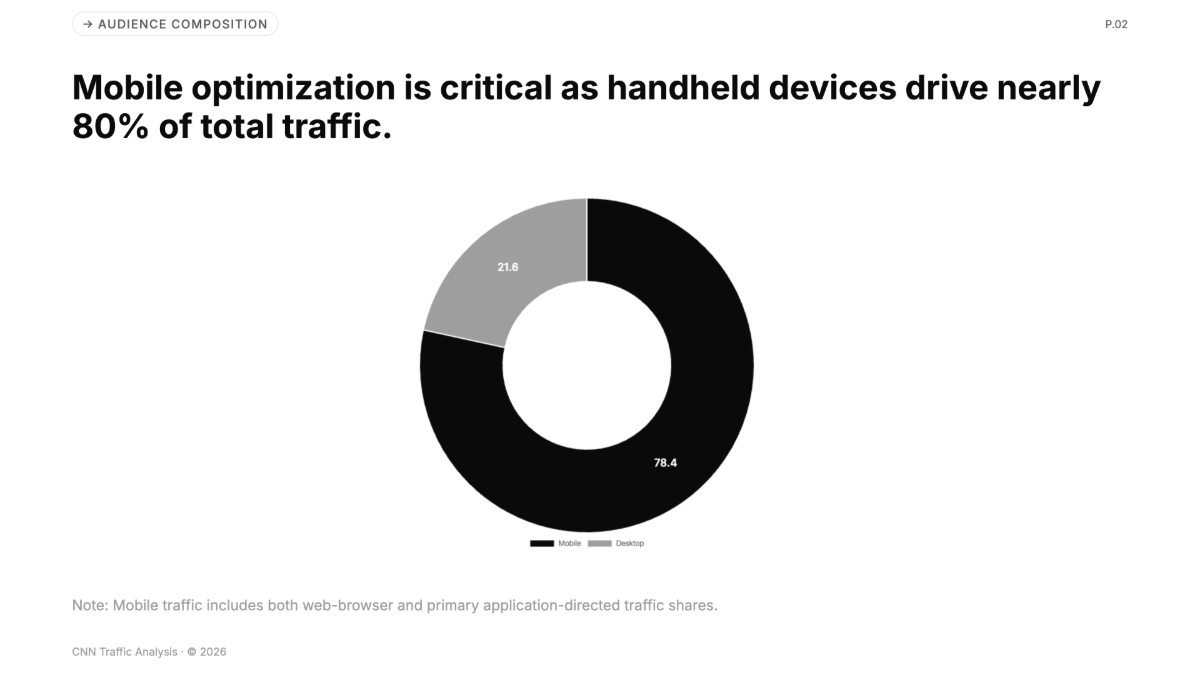
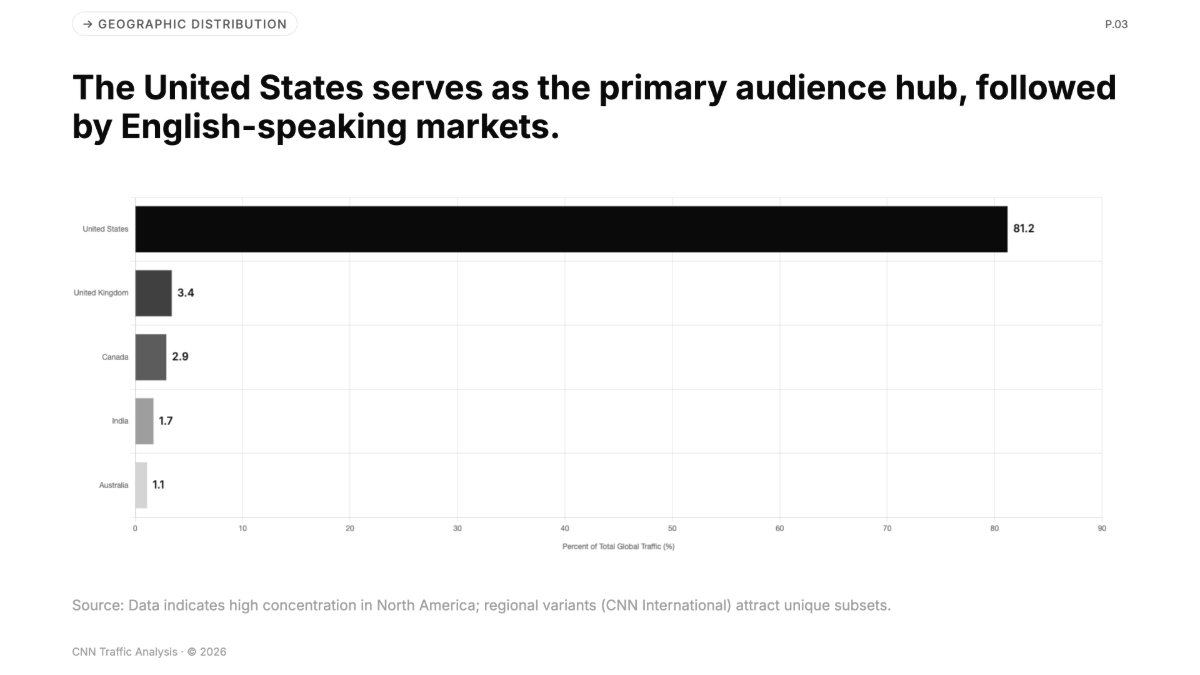
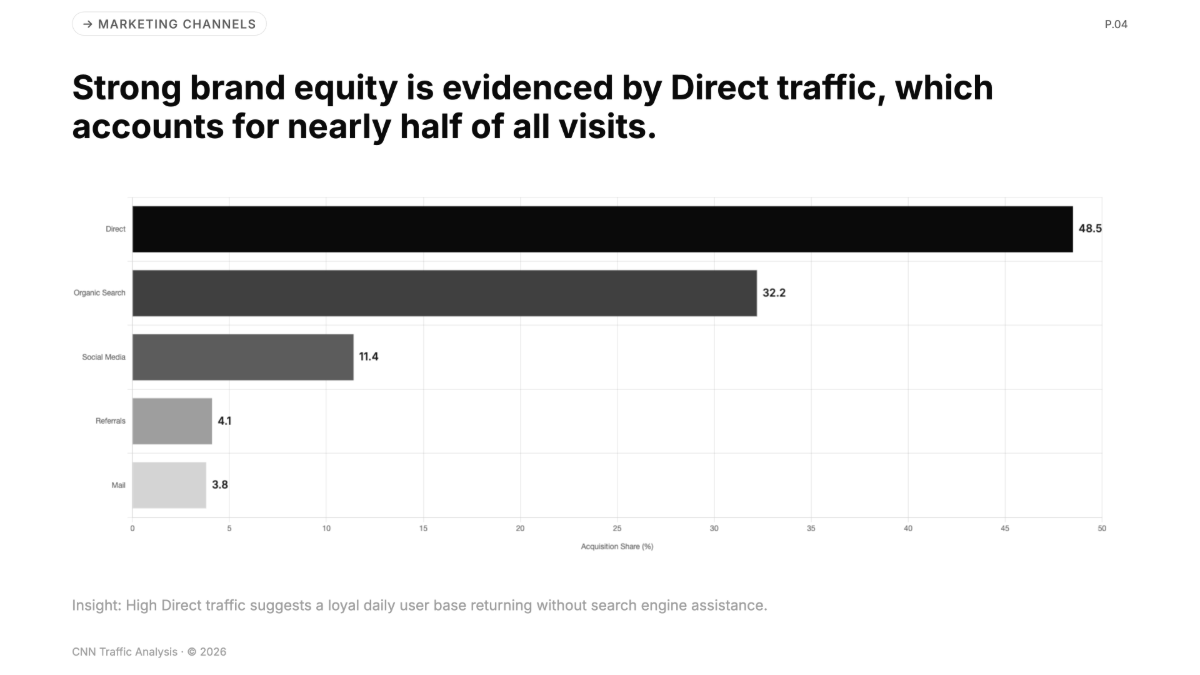
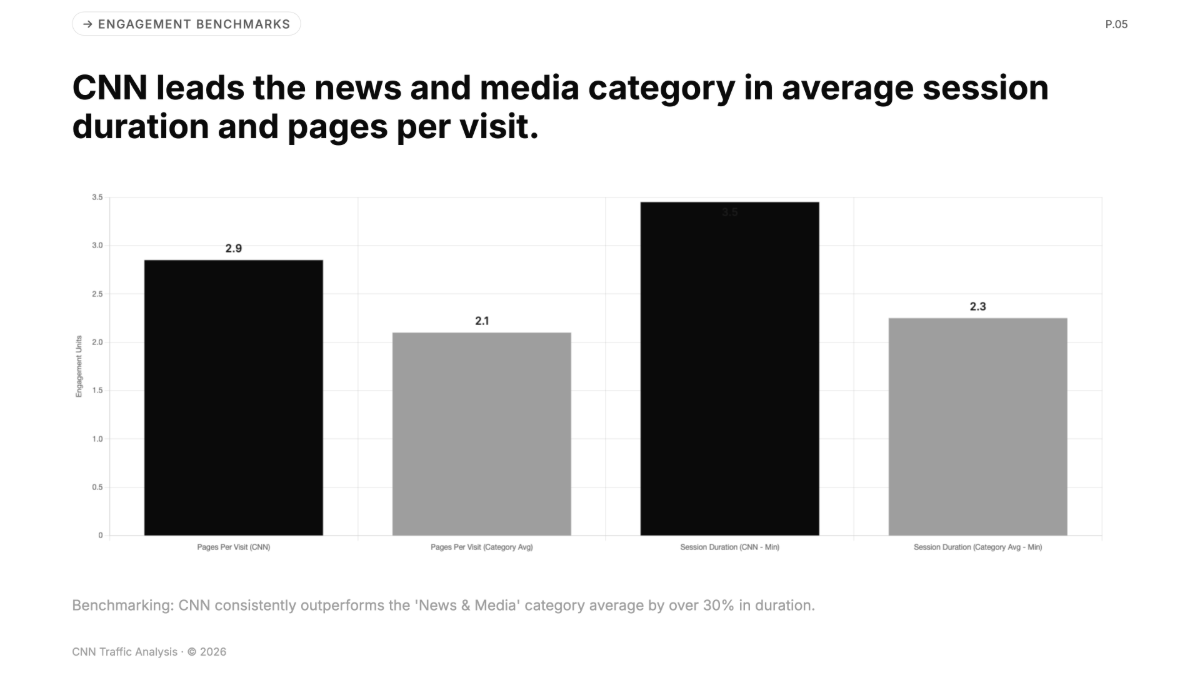
Website Traffic Chart visually presents site visitor data and engagement trends for media and marketing analysis. Analysts and business stakeholders use it to gauge digital presence and brand performance.
Website Traffic Chart visually presents site visitor data and engagement trends for media and marketing analysis. Analysts and business stakeholders use it to gauge digital presence and brand performance.
How do I create a Website Traffic Chart?
- Describe your detailsProvide key inputs like Company Name, Analysis Period, and Data Source with relevant traffic data.
- Click GeneratePress Generate to have Template.net's AI produce a customized Website Traffic Chart based on your details.
- Review & EditRefine the chart by typing new instructions or manually editing elements using the inline editor.
- Download, share or publish to social mediaDownload in formats like jpg, png, pdf, PowerPoint, or Word; share edit links; or publish directly to social channels.
What Are the Benefits of Using a Website Traffic Chart?
Website Traffic Charts offer clear insights into visitor behavior and engagement.
Visualize Trends
Easily identify audience growth or decline over specific periods.Inform Marketing
Use data to tailor campaigns for better outreach and conversion.Support Stakeholders
Provide business leaders with concrete metrics for digital strategy.Customizable Design
Adjust colors and fonts to match your brand identity.
What Are Some Website Traffic Chart Prompt Examples?
Use these examples to get started quickly with Template.net's Website Traffic Chart creation.
- Analyze marketing impact for Company Name during the Analysis Period
- Visualize monthly visitor trends from the Data Source in a clean layout
- Generate a professional chart showing weekly audience engagement
- Use my logo to ensure brand consistency in the Website Traffic Chart
- Create a presentation-ready chart for media stakeholders in minimalistic style
Template.net AI uses this black, gray, and white minimalist data analytics Website Traffic Chart template in landscape format, applying your Company Name, Analysis Period, and Data Source to generate a unique, customizable presentation for you.