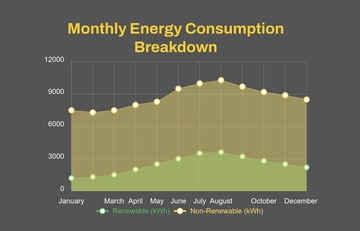
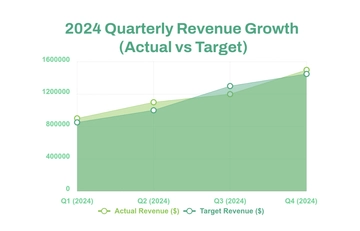
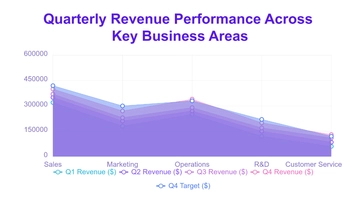
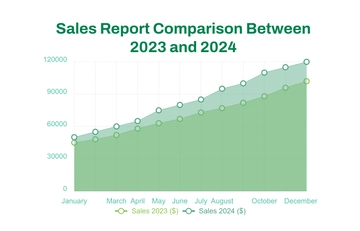
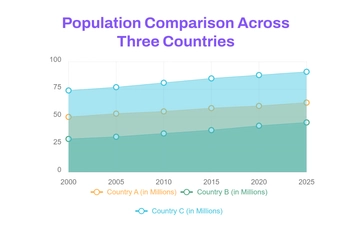
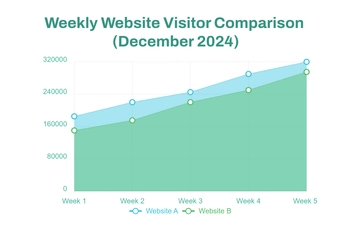
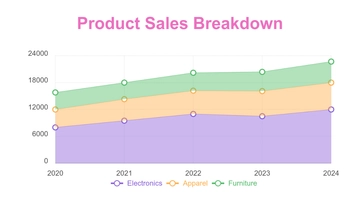
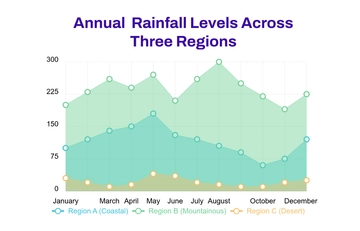
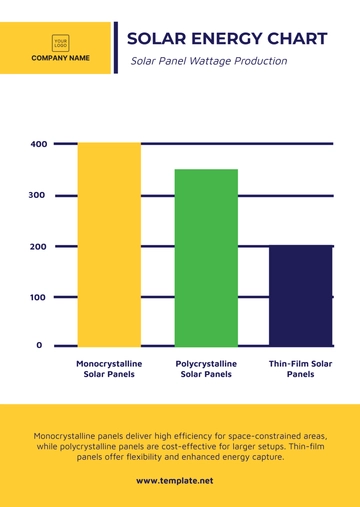
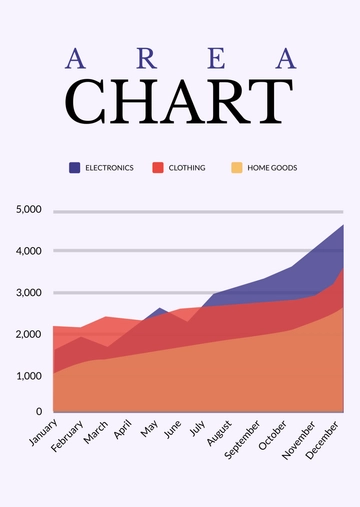
A professional area graph chart for tracking monthly energy consumption, professionally designed by Template.net, with a stacked area chart, a legend and a bold yellow headline in charcoal gray, olive green and golden yellow.
A professional area graph chart for tracking monthly energy consumption, professionally designed by Template.net, with a stacked area chart, a legend and a bold yellow headline in charcoal gray, olive green and golden yellow.