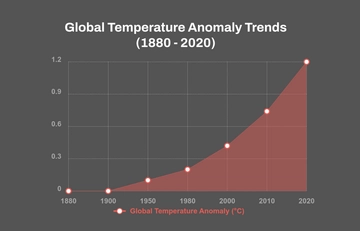
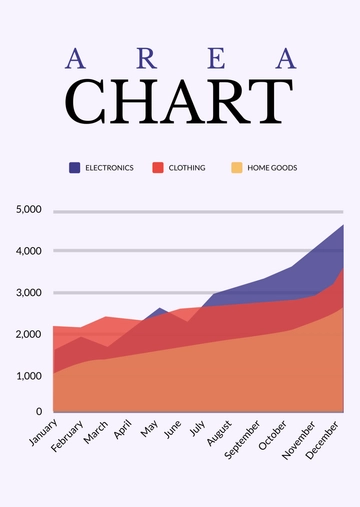
A serious area graph chart for showing climate change data, professionally designed by Template.net, with a rising area chart, a bold title and a data legend in charcoal gray, muted red and white.
A serious area graph chart for showing climate change data, professionally designed by Template.net, with a rising area chart, a bold title and a data legend in charcoal gray, muted red and white.