Get Access to World’s largest Template Library & Tools

How to Find the P-Value in Microsoft Excel

Microsoft Excel offers a robust suite of tools for statistical analysis, including the capability to calculate P-values, which are crucial for interpreting the significance of your test results. Understanding how to compute P-values in Excel is essential to assess the reliability of your statistical conclusions.
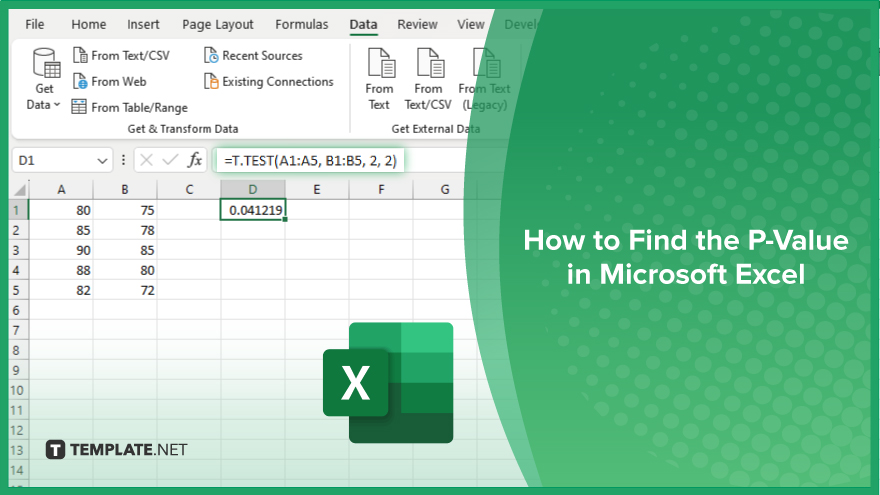
How to Find the P-Value in Microsoft Excel


Determining the P-value in Microsoft Excel helps you understand whether your results are statistically significant. By calculating P-values, you can make informed decisions about the validity of your hypotheses. This guide outlines the steps to find P-values in Excel using available functions and tools.

  • Step 1. Enter Your Data

    Start by entering your experimental data into two columns in Excel, ensuring that each column represents a different condition or group for comparison.

  • Step 2. Use an Appropriate Statistical Test

    Depending on the type of data and the hypothesis being tested, use an Excel function that fits your analysis needs. For instance, for a T-test, you might use the T.TEST function.

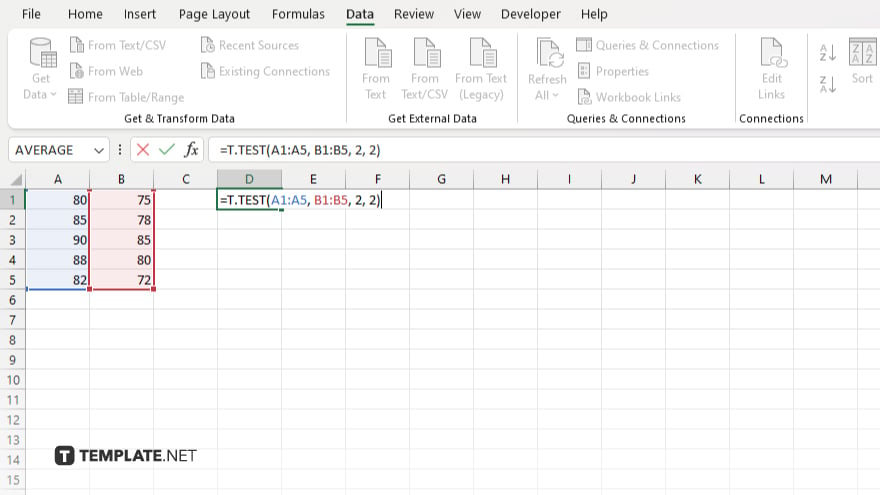
  • Step 3. Set Up the Function Formula

    step 3 set up the function formula

    Enter the function into a new cell. For a T-test, you would input “=T.TEST(array1, array2, tails, type),” where “array1” and “array2” are your data ranges, “tails” specifies one-tailed or two-tailed test, and “type” defines the type of T-test.

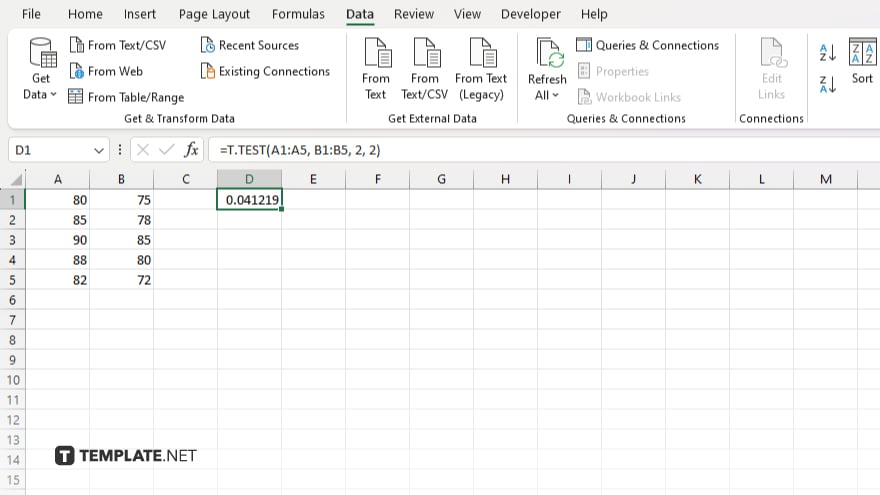
  • Step 4. Interpret the Result

    step 4 interpret the result

    After entering the formula, press “Enter.” Excel will calculate and display the P-value in the cell. This value indicates the probability that the observed differences between groups occurred by chance. A commonly used threshold for significance is a P-value of less than 0.05.

  • Step 5. Document the Results

    Document your findings and the calculated P-value. If the P-value is below your threshold for significance, your results can be considered statistically significant, thus supporting your hypothesis.

You may also find valuable insights in the following articles offering tips for Microsoft Excel:

note iconNote

Unlock Your Productivity with Over 100,000 Microsoft Excel Templates! Exclusively Available at Template.net – Download Now and Transform Your Data Handling Experience!

FAQs

How do I choose the right statistical test for calculating the P-value in Excel?

Choose based on your data type and hypothesis; for comparing means, use a T-test (T.TEST), and for correlation analysis, use Pearson (CORREL).

What does a P-value tell me about my hypothesis?

A P-value indicates the probability that the observed results are due to chance; a low P-value (typically <0.05) suggests significant evidence against the null hypothesis.

Can Excel calculate p-values for ANOVA tests?

Yes, use the ANOVA functions such as ANOVA.SINGLE or ANOVA.TWO depending on your data layout and the number of factors.

Is there a way to automatically interpret P-values in Excel?

While Excel calculates P-values, interpretation based on your significance threshold (like 0.05) must be done manually or scripted with conditional formatting.

How do I ensure accuracy in calculating P-values in Excel?

Ensure data is correctly formatted and clean, select the appropriate test and settings, and double-check formulas for errors to maintain calculation accuracy.

More in Excel

How to Make Comparison Charts in Microsoft ExcelHow to Code in Microsoft Excel
How to Write a Paragraph in Microsoft ExcelHow to Find on Microsoft Excel
How to Select All Rows in Microsoft ExcelHow to Create a Weekly Schedule in Microsoft Excel
How To Add 2 Columns in Microsoft ExcelHow to Export Microsoft Excel to PDF
How to Add Vertical Lines in an Excel GraphHow to Wrap a Cell in Microsoft Excel
How to Add Dates in Microsoft Excel AutomaticallyHow to Create a Flowchart in Microsoft Excel
How to Change the Y Axis in Microsoft ExcelHow to Add Cells Together in Microsoft Excel
How to Switch Axes in Microsoft ExcelHow to Compare Two Tabs in Microsoft Excel
How to Make a Scatter Plot on Microsoft ExcelHow to Remove Autofilter in Microsoft Excel
How to Do a Line Graph in Microsoft ExcelHow to Convert Date to Month in Microsoft Excel
How to Make a Balance Sheet in Microsoft ExcelHow to Refresh Microsoft Excel Formulas
How to Do a Histogram in Microsoft ExcelHow to Change the Microsoft Excel Theme
How to Learn Microsoft Excel for FreeHow to Create Address Labels in Microsoft Excel
How to Sort a Table in Microsoft ExcelHow to Find the Mean, Median, and Mode in Microsoft Excel
How to Sum Random Cells in Microsoft ExcelHow to Add a Whole Column in Microsoft Excel
How to Make a Copy of a Microsoft Excel WorkbookHow to Subtract a Column in Microsoft Excel
How to Remove Parentheses in Microsoft ExcelHow to Fix Rows in Microsoft Excel
How to Make a Timesheet in Microsoft ExcelHow to Create a Flow Chart in Microsoft Excel
How to Make Square Cells in Microsoft ExcelHow to Apply a Filter in Microsoft Excel
How to Insert a Note in Microsoft ExcelHow to Make a Graph in Microsoft Excel With Data
How to Create a Sparkline in Microsoft ExcelHow to Set Margins in Microsoft Excel
How to Copy Filtered Data in Microsoft ExcelHow to Set Default Font in Microsoft Excel
How to Edit Footer in Microsoft ExcelHow to Unhide All Sheets in Microsoft Excel
How to Get Rid of Spaces in Microsoft ExcelHow to Calculate Columns in Microsoft Excel
How to Change a Formula to a Value in Microsoft ExcelHow to Flip Rows and Columns in Microsoft Excel
How to Make a Box in Microsoft ExcelHow to Use NPV in Microsoft Excel
How to Make a List of Numbers in Microsoft ExcelHow to Make a Sensitivity Table in Microsoft Excel
How to Keep 0 in Front of a Number in Microsoft ExcelHow to Do an Absolute Reference in Microsoft Excel
How to Put a Drop Down in Microsoft ExcelHow to Change a Negative Number to Positive in Excel
How to Combine Tables in Microsoft ExcelHow to Highlight Blank Cells in Microsoft Excel
How to Save a Macro in Microsoft ExcelHow to Sort by Month in Microsoft Excel
How to Do a Percentage Increase in Microsoft ExcelHow to Apply Filter in Microsoft Excel
How to Delete Multiple Sheets in Microsoft ExcelHow to Create a Slicer in Microsoft Excel
How to Turn Microsoft Excel Data Into a GraphHow to Move a Page Break in Microsoft Excel
How to Clear Table Format in Microsoft ExcelHow to Extract the Year From a Date in Microsoft Excel
How to Do a Bar Graph in Microsoft ExcelHow to Change Theme in Microsoft Excel
How to Calculate Cells in Microsoft ExcelHow to Label X and Y Axis on Microsoft Excel
How to Change Print Area in Microsoft ExcelHow to Add 2 Cells in Microsoft Excel
How to Write Vertically in Microsoft ExcelHow to Display All Formulas in Microsoft Excel
How to Change the Chart Style in Microsoft ExcelHow to Enter Bullet Points in Microsoft Excel
How to Change a Microsoft Excel File from Read OnlyHow to Show the Ribbon in Microsoft Excel
How to Make a Clustered Column Chart in ExcelHow to See Duplicates in Microsoft Excel
How to Trim in Microsoft ExcelHow to Do a Scatter Plot in Microsoft Excel
How to Switch Cells in Microsoft ExcelHow to Calculate Workdays in Microsoft Excel
How to Make a Macro in Microsoft ExcelHow to Create a Sensitivity Table in Microsoft Excel
How to Calculate a Percentage in Microsoft ExcelHow to Freeze 2 Rows in Microsoft Excel
How to Import a File Into Microsoft ExcelHow to Email a Microsoft Excel Sheet
How to Create Labels in Word From Microsoft ExcelHow to Auto-Adjust Row Height in Microsoft Excel
How to Combine Tabs in Microsoft ExcelHow to Wrap Text in a Microsoft Excel Cell
How to Autofill the Date in Microsoft ExcelHow to Fix a Circular Reference in Microsoft Excel
bottom banner