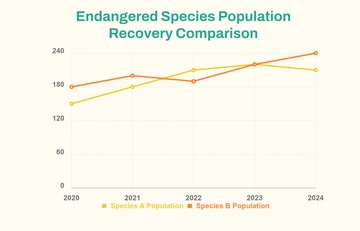
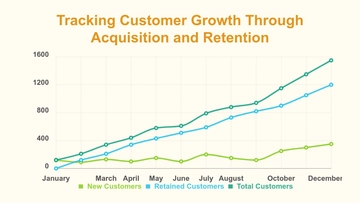
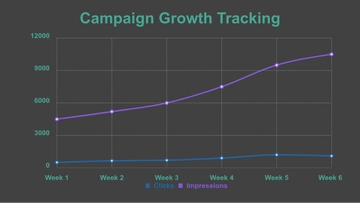
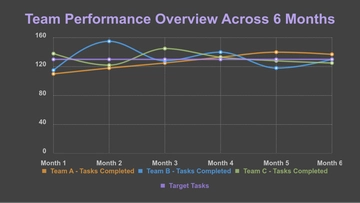
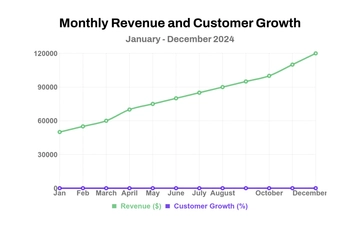
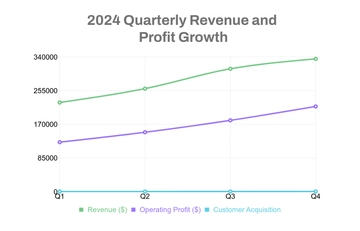
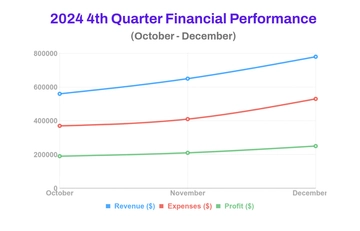
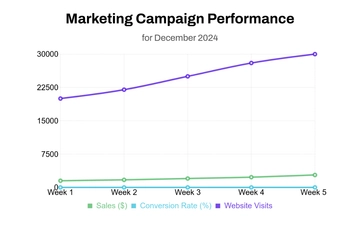
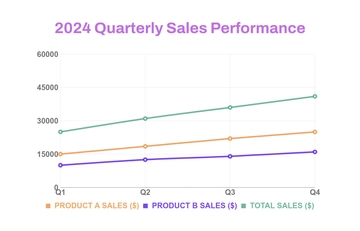
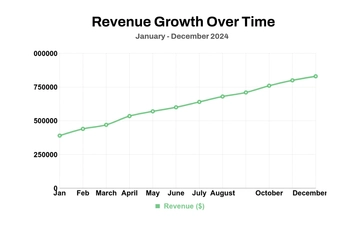
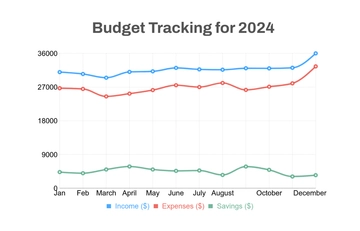
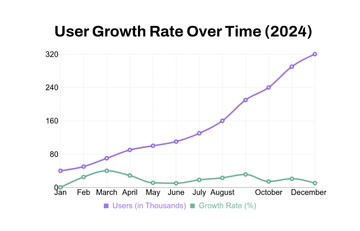
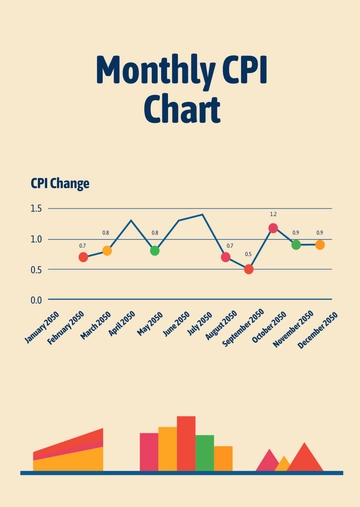
A playful line graph chart for tracking monthly consumer price index changes, professionally designed by Template.net, with a line graph, colourful data points and decorative bar shapes in navy blue, soft cream and warm orange.
A playful line graph chart for tracking monthly consumer price index changes, professionally designed by Template.net, with a line graph, colourful data points and decorative bar shapes in navy blue, soft cream and warm orange.