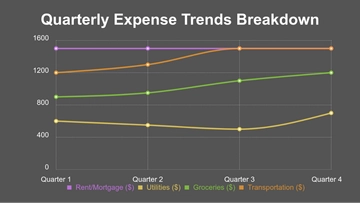
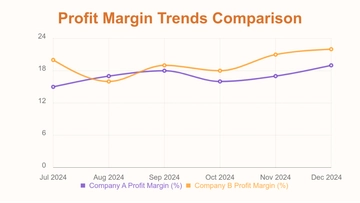
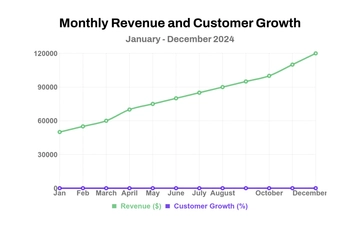
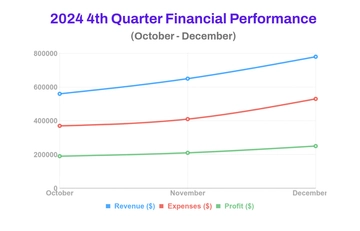
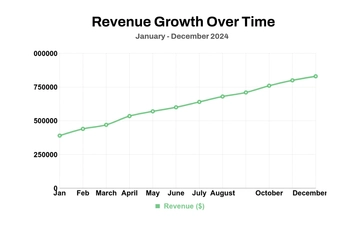
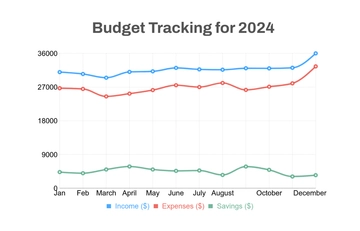
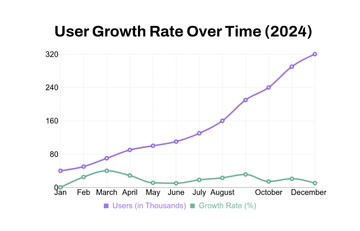
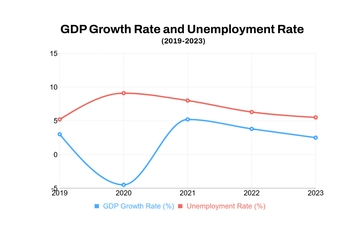
A minimal line graph chart for comparing stock market indices over time, professionally designed by Template.net, with a two-line comparison graph, a chart title and a colour-coded legend in teal green, violet purple and white.
A minimal line graph chart for comparing stock market indices over time, professionally designed by Template.net, with a two-line comparison graph, a chart title and a colour-coded legend in teal green, violet purple and white.