Free Data Analysis Flow Chart
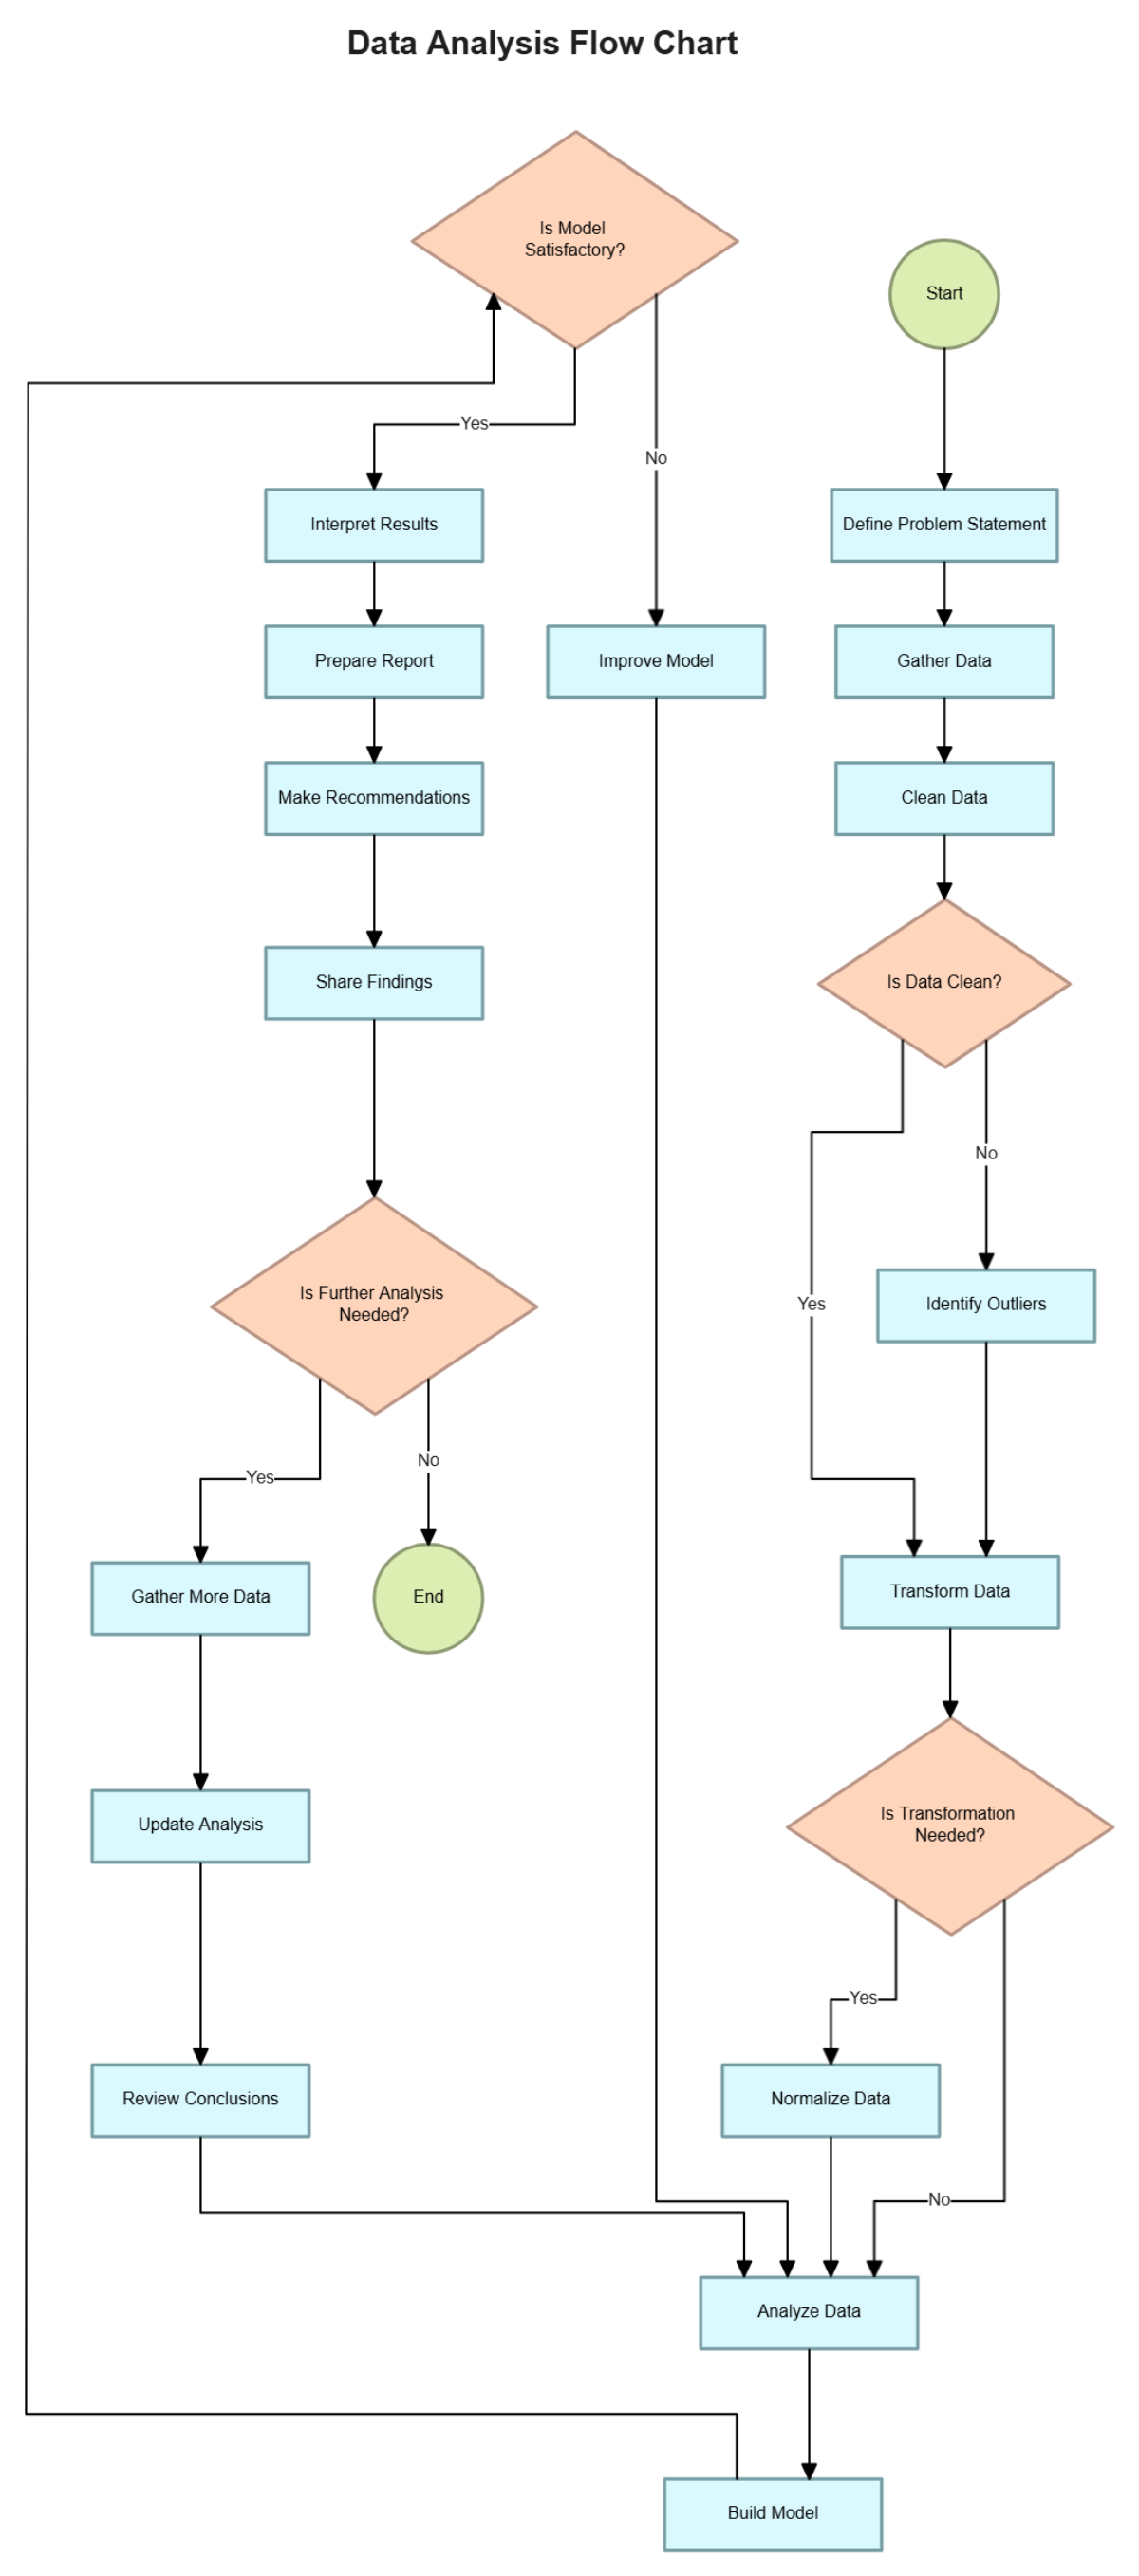
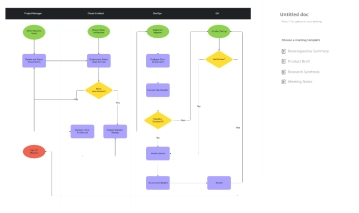
The Data Analysis Flow Chart presents a methodical, decision-oriented framework for transforming raw data into actionable insights. It begins with a clearly defined problem statement, followed by data gathering and cleaning—ensuring that the foundation of analysis is both relevant and reliable. A decision point evaluates whether the data is sufficiently clean; if not, the process loops through outlier identification and refinement. Once validated, the flow advances to model evaluation, where analysts determine if the model meets performance expectations. Unsatisfactory models trigger iterative improvements, while successful ones lead to interpretation, reporting, and recommendation stages. A final decision assesses whether further analysis is needed, allowing for continued refinement or closure. This chart is ideal for teams seeking a resilient, feedback-driven approach to data analysis that emphasizes clarity, quality control, and continuous improvement.
