Free Dashboard Reporting Flow Chart
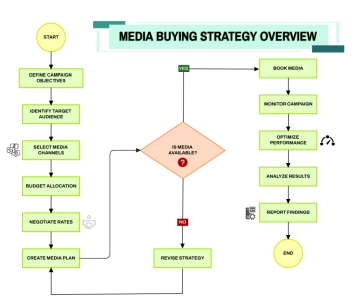
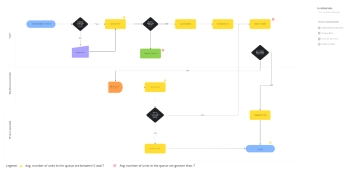
The Dashboard Reporting Flow Chart outlines a streamlined, decision-based process for building and validating data dashboards, ensuring that each report is both accurate and actionable. It begins with gathering requirements, establishing the foundation for what the dashboard must deliver. A key decision point checks data availability; if data is missing, the flow initiates collection and cleaning procedures to ensure integrity. Once data is ready, the process evaluates whether the dashboard design has been approved. If not, revisions are made before development begins. The chart then guides teams through dashboard creation and determines whether testing is required. If so, unit testing is conducted to validate functionality and performance. This flowchart is ideal for organizations aiming to produce reliable, user-friendly dashboards that reflect stakeholder needs while maintaining technical precision and iterative quality control.

