Free KPI Tracking Flow Chart
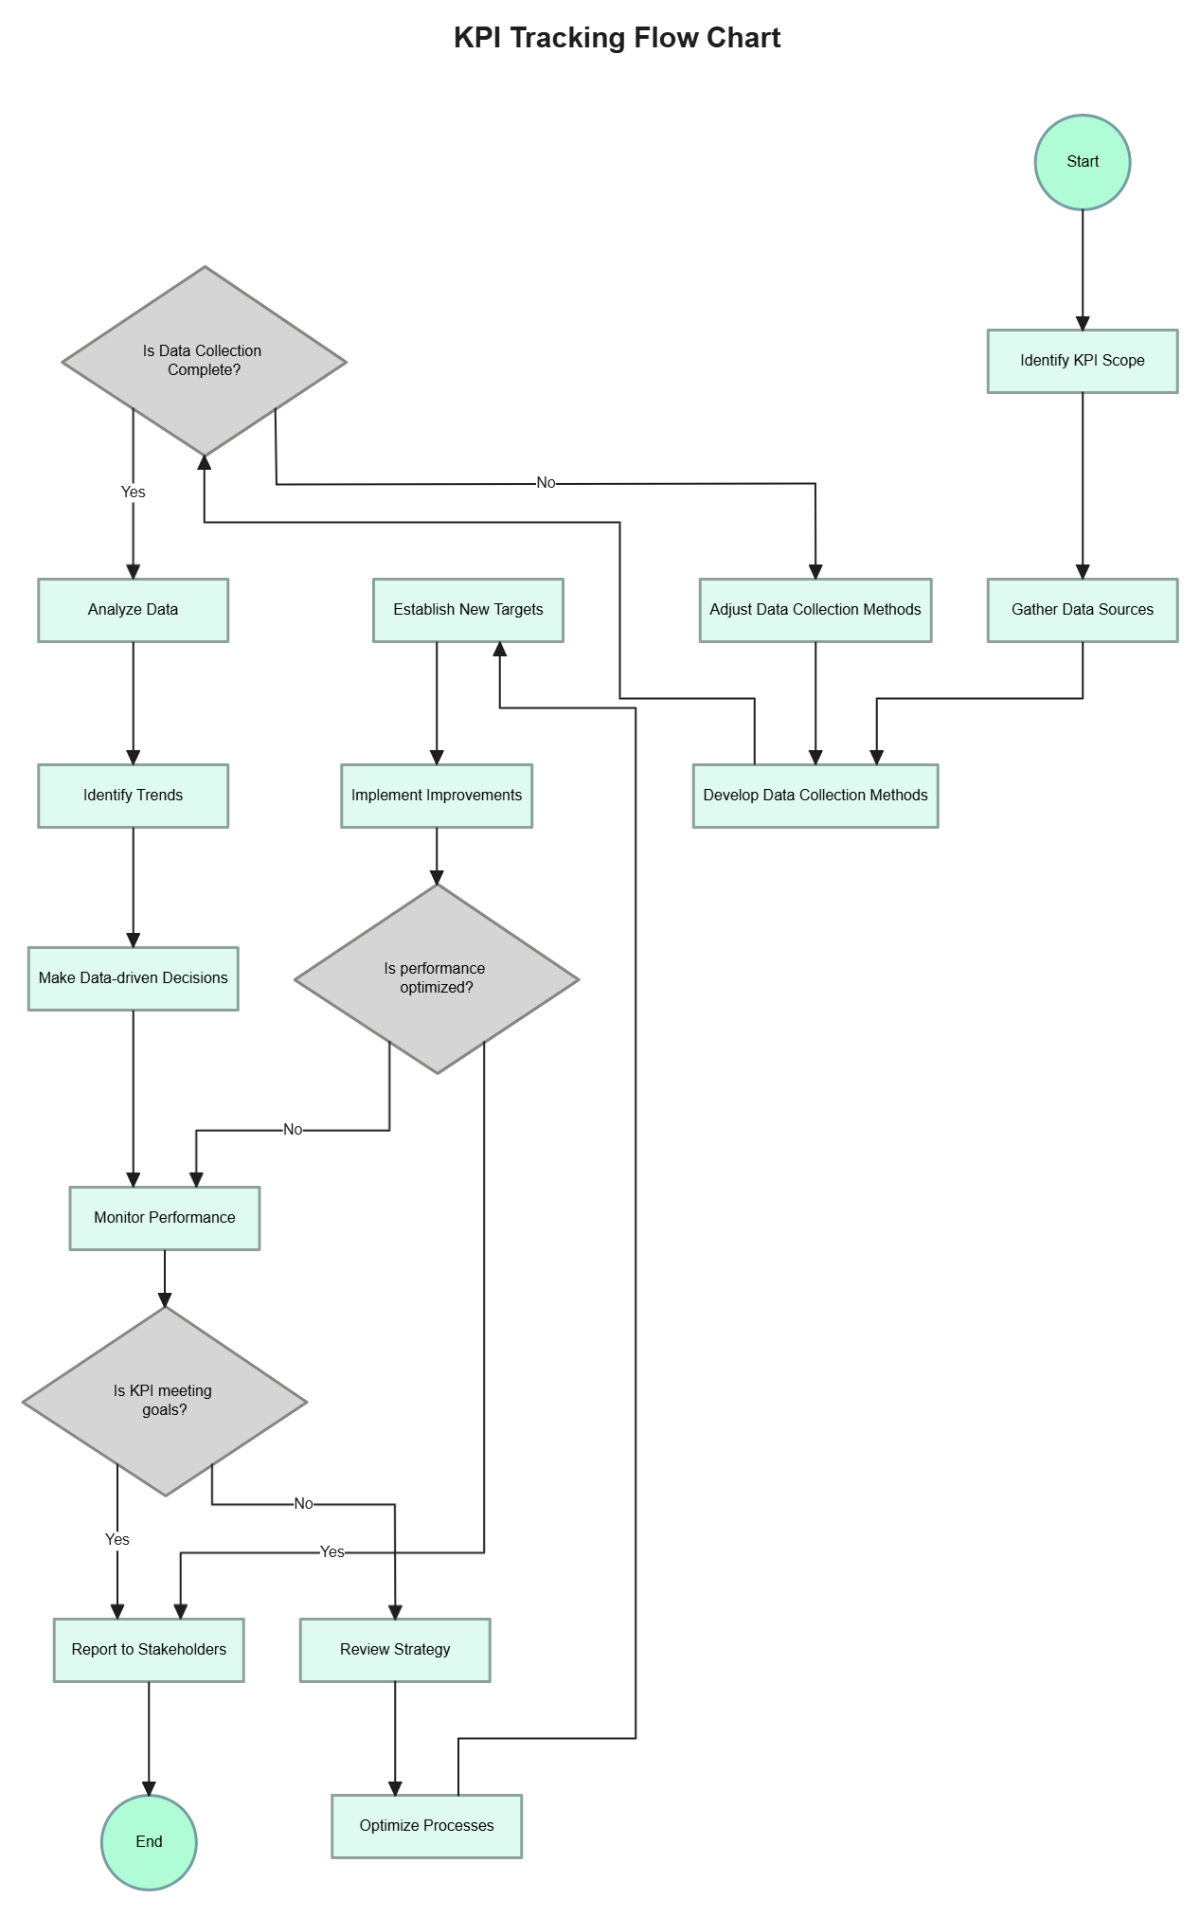
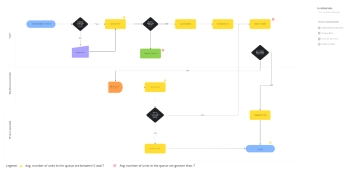
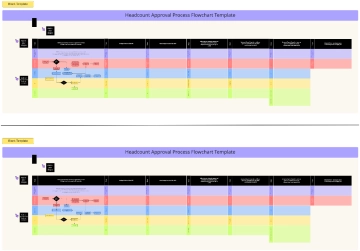
The KPI Tracking Flow Chart delivers a structured, performance-driven framework for monitoring and optimizing key metrics across an organization. It begins by defining the scope of the KPIs and identifying relevant data sources, ensuring that tracking efforts are aligned with strategic goals. From there, the process moves into refining and developing data collection methods, with a decision point that checks whether data collection is complete. If not, the flow loops back to improve the methodology; if yes, it proceeds to data analysis, trend identification, and informed decision-making. The chart then guides teams through establishing new performance targets and implementing improvements. A final decision evaluates whether performance has reached optimal levels—if so, monitoring continues; if not, further improvements are initiated. This flowchart is ideal for teams committed to continuous improvement, offering a resilient system for turning raw data into actionable insights and reinforcing accountability at every stage.
