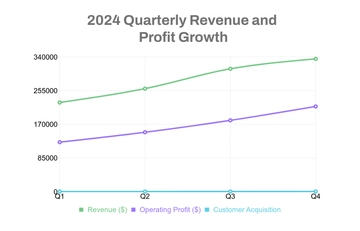
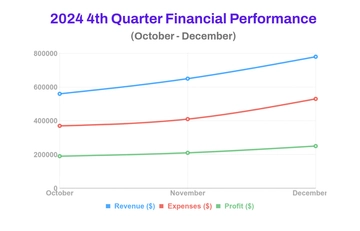
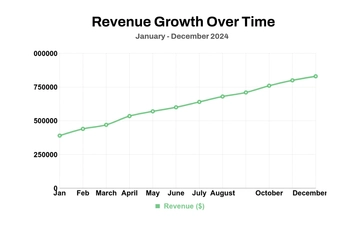
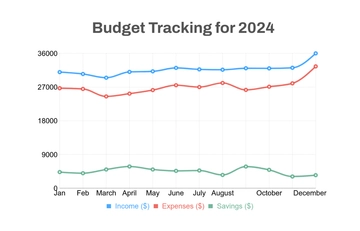
A modern line graph chart for presenting monthly unit sales, professionally designed by Template.net, with a yellow line graph, cyan gridlines and striped overlapping circles in deep navy blue, golden yellow and bright cyan.
A modern line graph chart for presenting monthly unit sales, professionally designed by Template.net, with a yellow line graph, cyan gridlines and striped overlapping circles in deep navy blue, golden yellow and bright cyan.