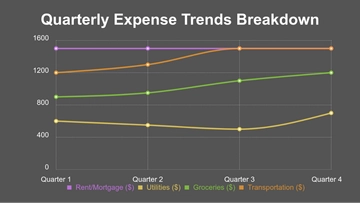
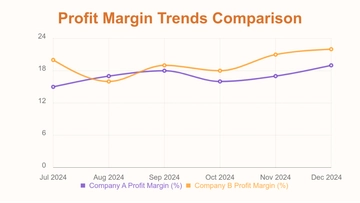
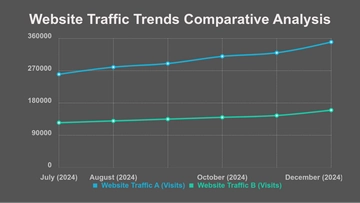
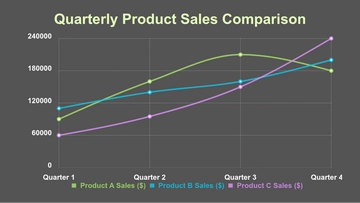
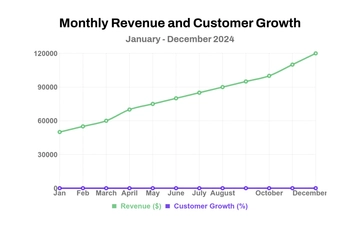
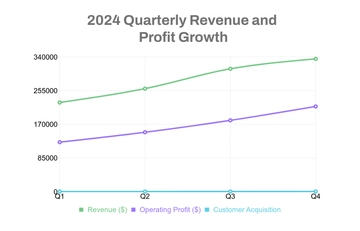
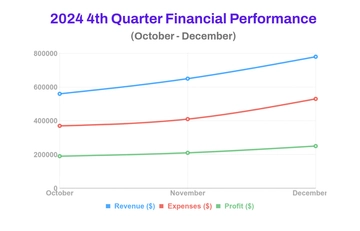
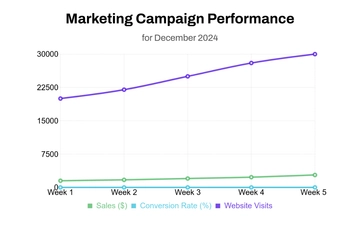
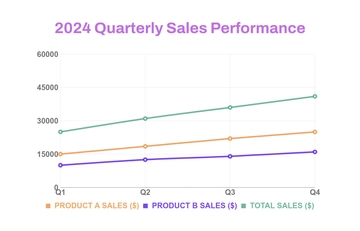
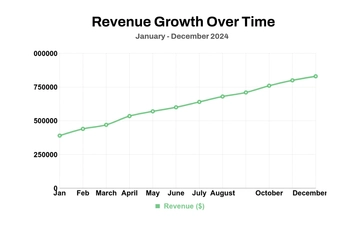
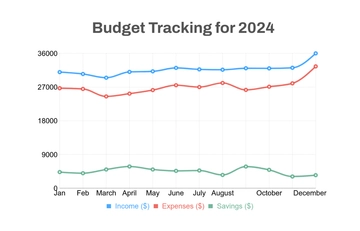
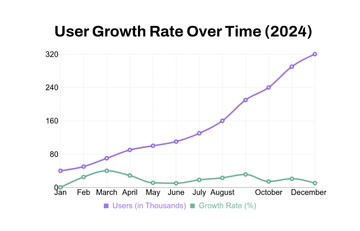
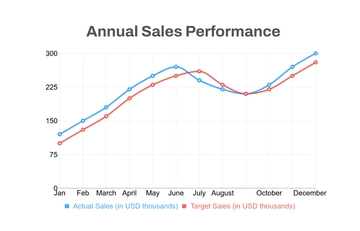
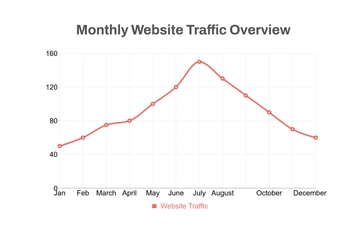
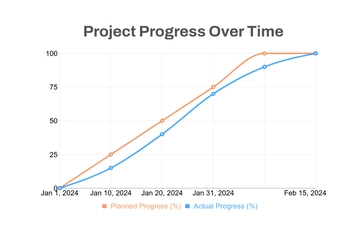
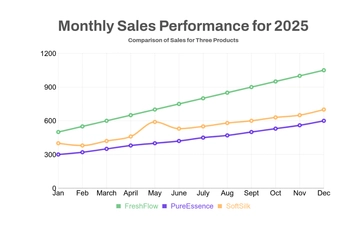
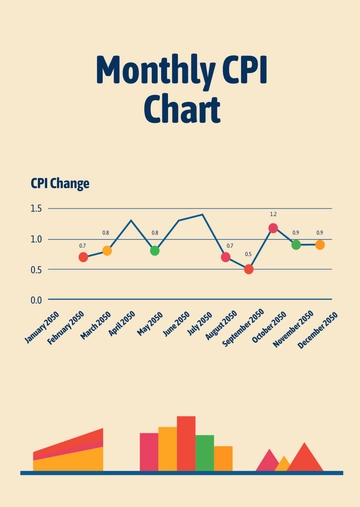
A bold line graph chart for sales projections, professionally designed by Template.net, with a two-line monthly chart, month labels and a sales forecast banner in bright green, vivid yellow and warm orange.
A bold line graph chart for sales projections, professionally designed by Template.net, with a two-line monthly chart, month labels and a sales forecast banner in bright green, vivid yellow and warm orange.