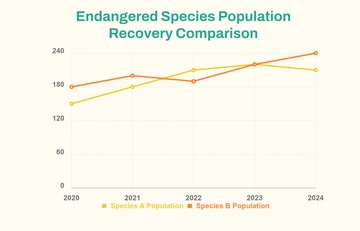
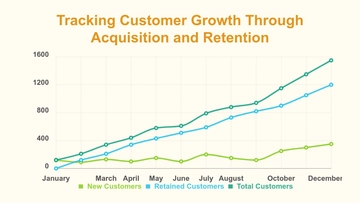
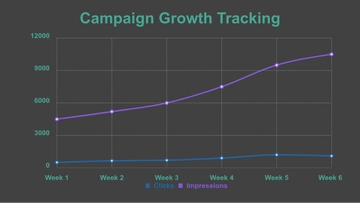
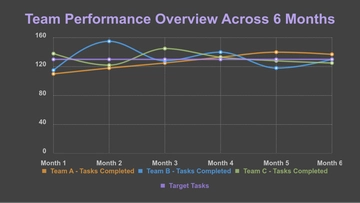
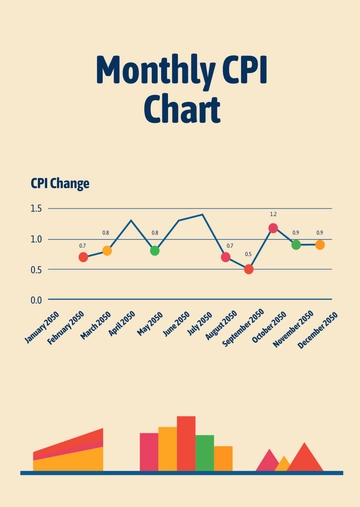
A clean line graph chart for tracking product inflation and deflation rates over six months, professionally designed by Template.net, with a two-line chart, a colour legend and a data table in pale cream yellow, soft blue and coral orange.
A clean line graph chart for tracking product inflation and deflation rates over six months, professionally designed by Template.net, with a two-line chart, a colour legend and a data table in pale cream yellow, soft blue and coral orange.