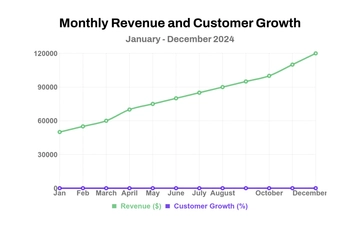
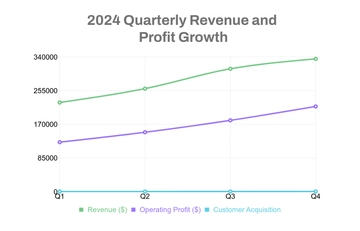
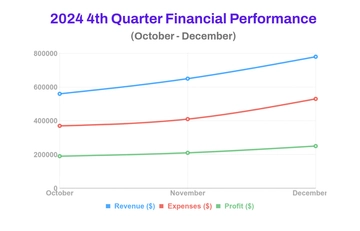
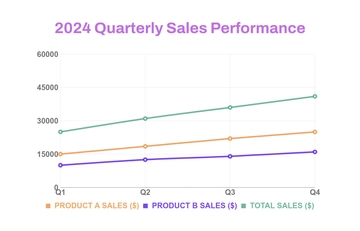
A professional line graph chart for tracking monthly Bitcoin prices, professionally designed by Template.net, with a twelve-month price table, a Bitcoin coin and a green trend arrow in dark navy, white and golden orange.
A professional line graph chart for tracking monthly Bitcoin prices, professionally designed by Template.net, with a twelve-month price table, a Bitcoin coin and a green trend arrow in dark navy, white and golden orange.