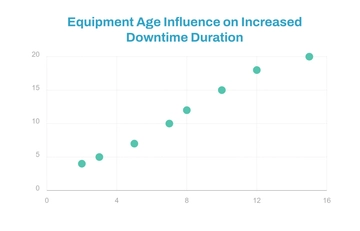
A clean scatter graph chart for showing a positive correlation between two variables, professionally designed by Template.net, with a scatter plot, blue data points and a chart title in teal green, bright blue and white.
A clean scatter graph chart for showing a positive correlation between two variables, professionally designed by Template.net, with a scatter plot, blue data points and a chart title in teal green, bright blue and white.