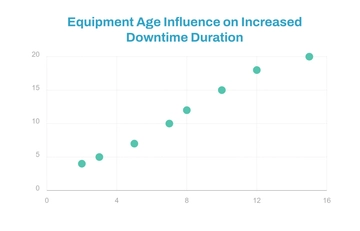
A clean scatter graph chart for comparing product pricing with consumer demand, professionally designed by Template.net, with a scatter plot, orange data points and a green chart title in orange, green and white.
A clean scatter graph chart for comparing product pricing with consumer demand, professionally designed by Template.net, with a scatter plot, orange data points and a green chart title in orange, green and white.