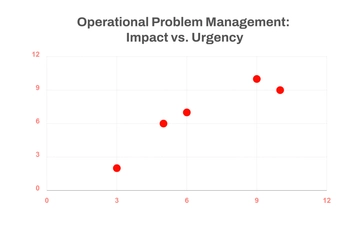
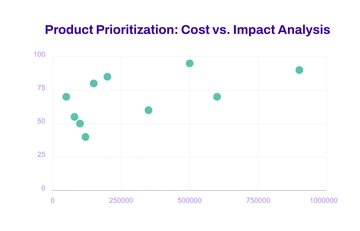
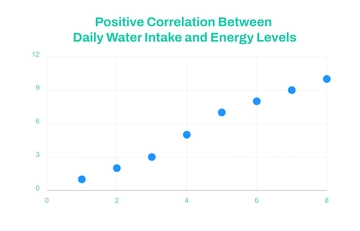
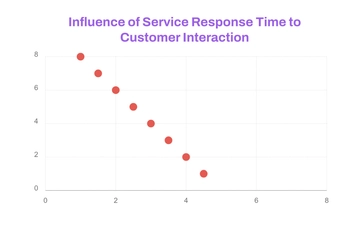
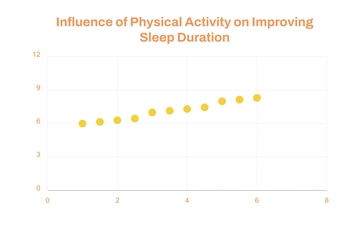
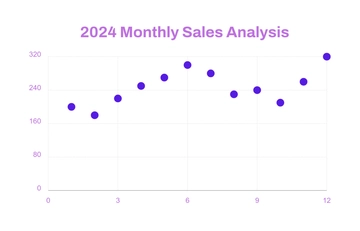
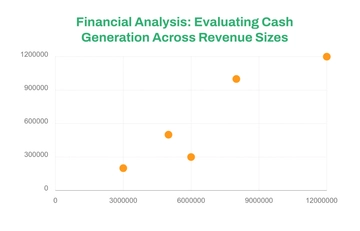
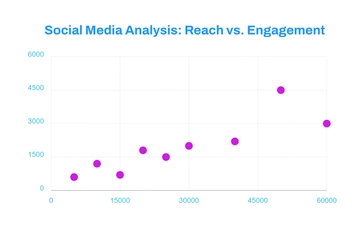
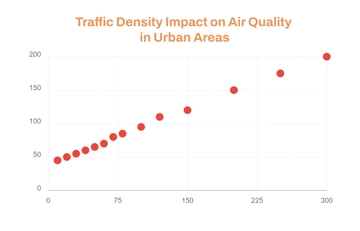
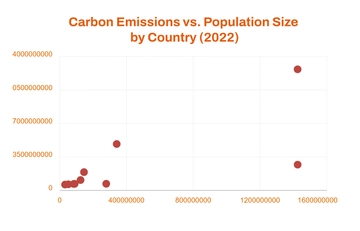
A clean scatter graph chart for environmental impact studies, professionally designed by Template.net, with a scatter plot, red data points and a chart title in vivid red, soft orange and white.
A clean scatter graph chart for environmental impact studies, professionally designed by Template.net, with a scatter plot, red data points and a chart title in vivid red, soft orange and white.