Table of Contents
How To Create/Build a Chart in Google Sheets
Charts are helpful visual representations of data and research findings that help targeted audiences understand a topic better. Various industries use this material, from corporations to academic institutions.
Build a Chart Template for Google Sheets – Step-by-Step Instructions
Google Sheets is similar to Microsoft Excel, however, this spreadsheet can be accessed online as long as the user has a Google account. It is one of the most widely used applications to create important documents such as surveys, budgets, and different kinds of charts.
-
Step 1: Log In to Your Gmail Account
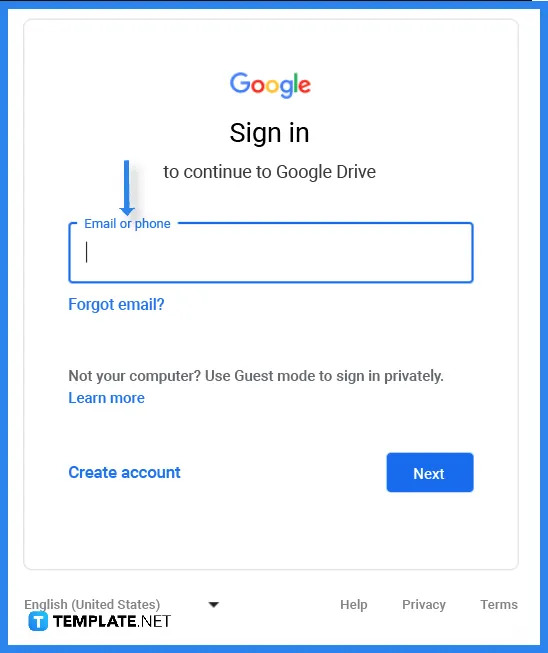 To access Google Sheets, the first step is to log into your Google account or Gmail. Type in your email address or phone number that is associated with your account.
 -
Step 2: Select a Chart Template (Option 1)
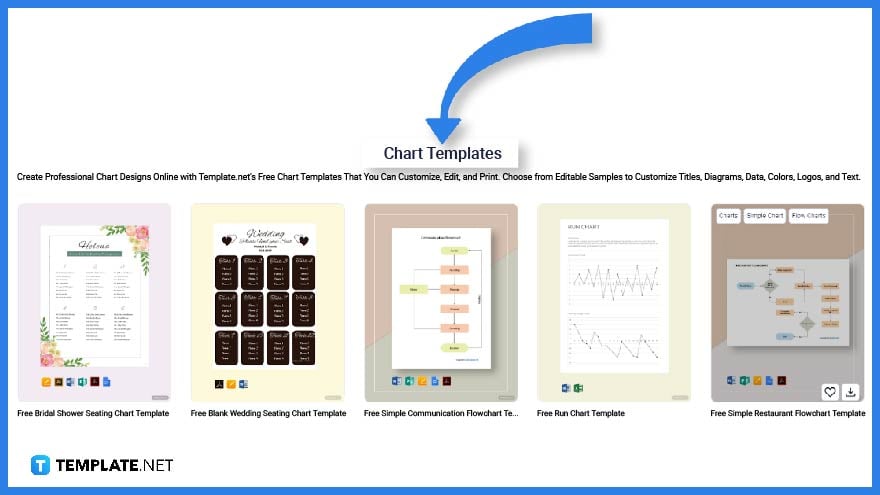 Head over to Template.net and you will find a wide variety of templates that you can use to create an organizational chart, flow chart, or a simple chart for your personal or business needs. Then select a specific chart template you can edit on Google Sheets.
 -
Step 3: Use the Search Text Box to Look for a Template (Option 2)
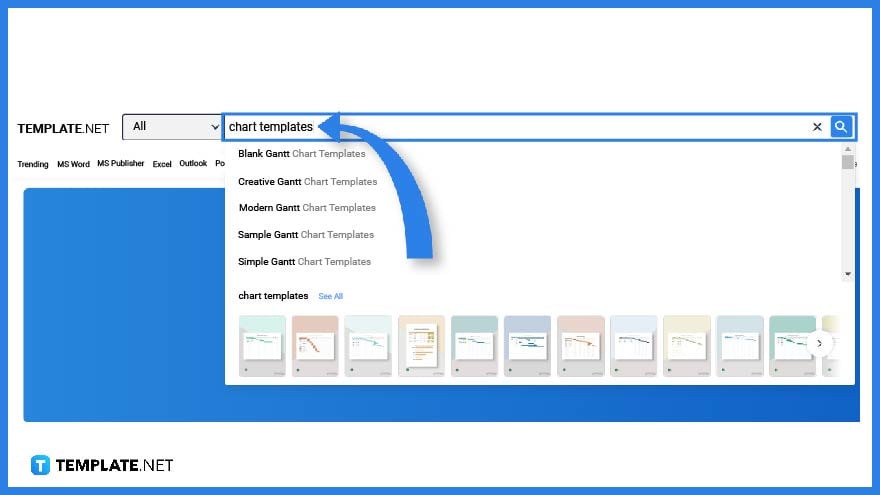 As an alternative option, you can also use the search text box to look for chart templates. Simply type in the keyword on the text box and click enter.
 -
Step 4: Select a Specific Chart Template to Customize
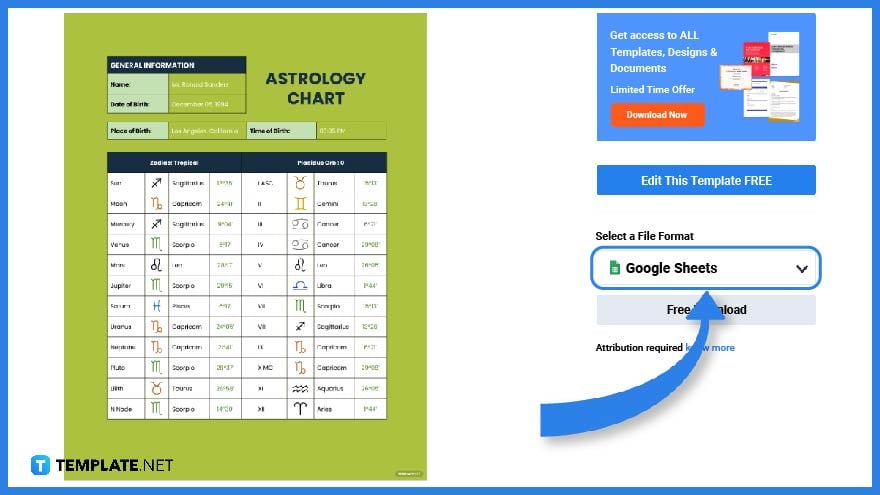 Charts can be used for various purposes such as projects, proposals, research and etc. That said, pick one specific chart template that fits your needs, click on the image to obtain a larger or better view. On the right-side portion of the screen, you can find an option to download the template.
 -
Step 5: Select a File Format and Download the Template
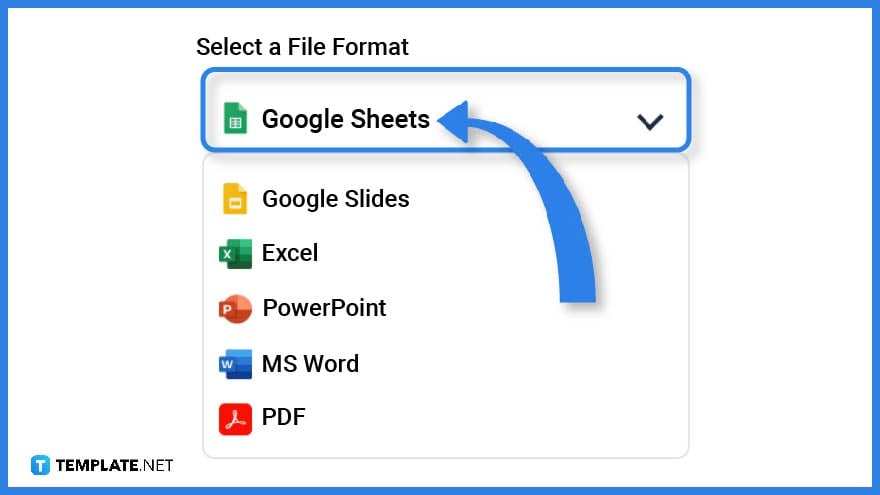 To fully access the template, make sure to select Google Sheets as its file format then download the file.
 -
Step 6: Make a Copy
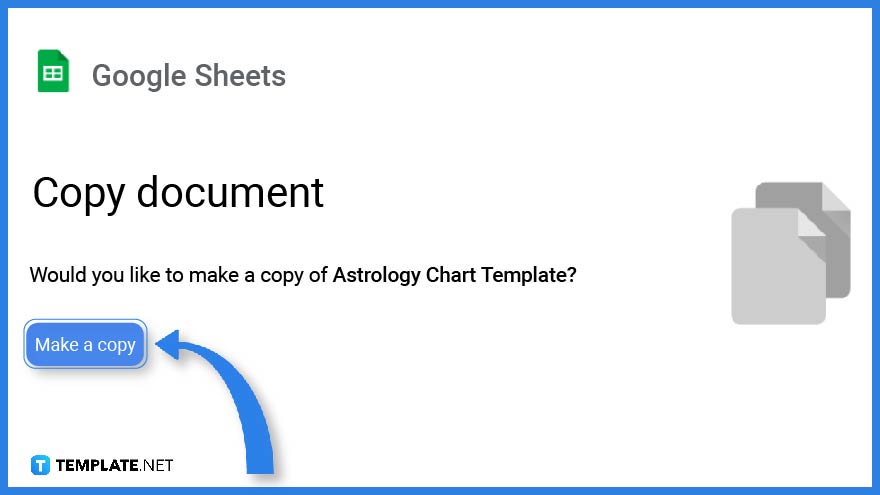 Right after that, you will find a reminder asking you to make a copy of the template. Click on the button to automatically open the file.
 -
Step 7: Chart Title
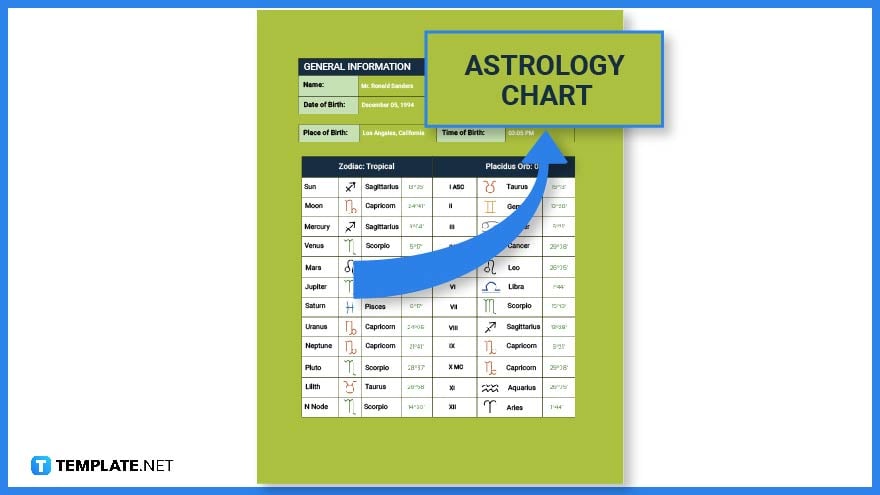 On the uppermost portion of the document is the chart title. This will help readers understand what the chart represents.
 -
Step 8: Add Descriptions or Information
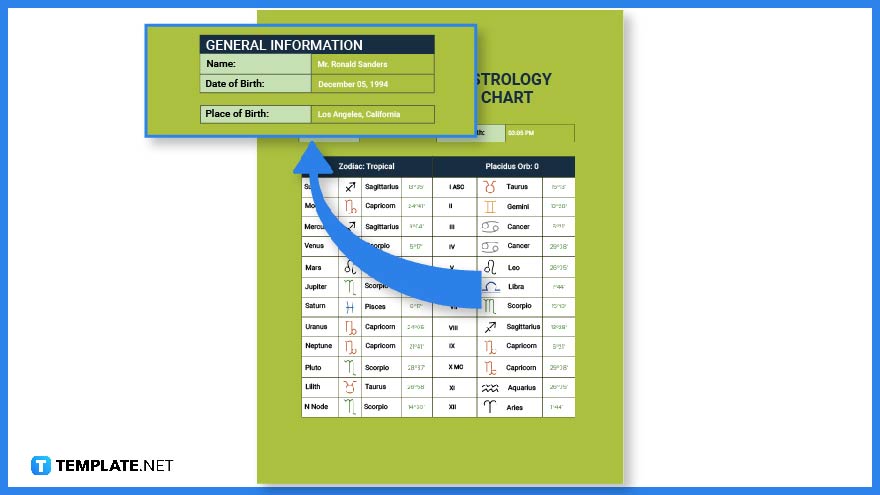 A brief description provides readers with sufficient information about what the document is all about or who it is intended for.
 -
Step 9: Add the Content and Use Different Kinds of Symbols
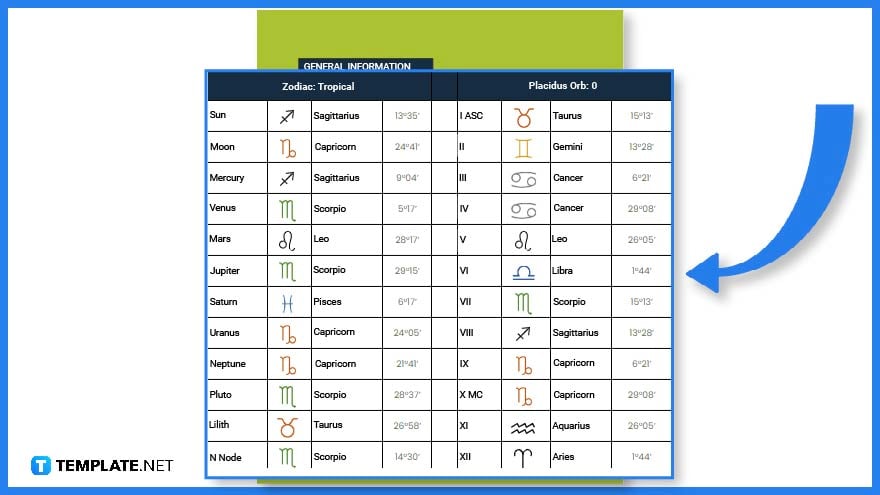 When creating a chart, data are visually represented by using various symbols such as tables, diagrams, graphs, bars, and lines. This is why it is ideal to create a chart using Google Sheets since it has features that enable its users to make use of spreadsheets, making it easier to arrange the data efficiently.
 -
Step 10: Use Color Codes
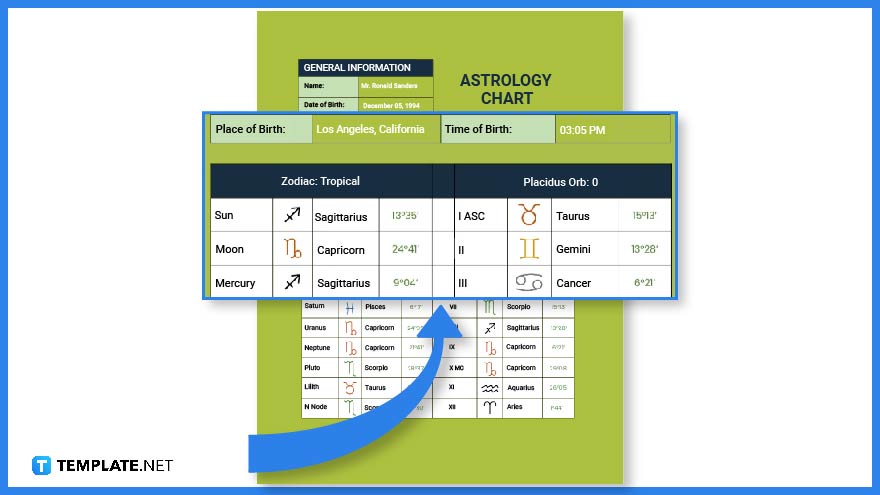 Adding various color codes to your chart will help readers single out, distinguish and highlight one data from another.
 -
Step 11: Chart Template Format
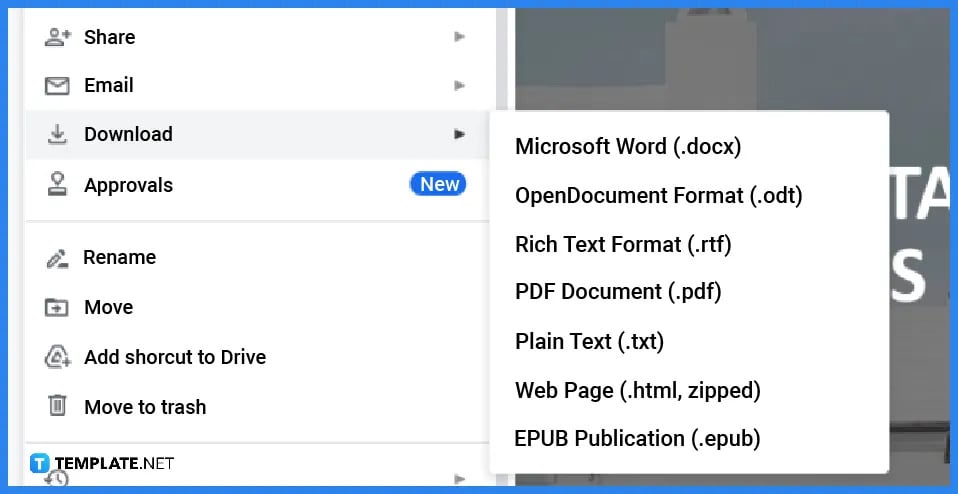 Right after you finish editing the template, make sure you download the file. You will find the download option from a drop-down menu on the File tab. From there you can select several file formats from PDF, .docx, EPUB and etc., whatever works best for you.
FAQs
How do I create a chart template in Google Sheets?
You can create a chart template in Google Sheets but downloading and copying a template from Template.net.
How do I find a chart template?
You can find a wide variety of chart templates on Templat.net
Why are charts important?
Charts are important because they condense information making it easier for readers to understand and visualize each piece of data.


