Table of Contents
Charts
Charts have been a part of the daily hustle and bustle of industries. It is a tool crucial for presenting and communicating ideas to your audience and getting your message across.
Download the Free Chart Article in PDF
File Format:
Chart Definition & Meaning
A chart is a visual representation of information and the relationship between data and insights.
Organizations customize and personalize the parts and elements of their charts depending on the purpose and their audience to convey their point successfully and motivate the best action.
What Is a Chart?
A chart utilizes graphic elements for presenting a structure, comparison, dependency, flow, trends, patterns, and other connections of concepts and numbers. Individuals generate charts to make data more digestible and memorable. This data visualization tool is often used for corporate or educational purposes.
10 Types Of Chart
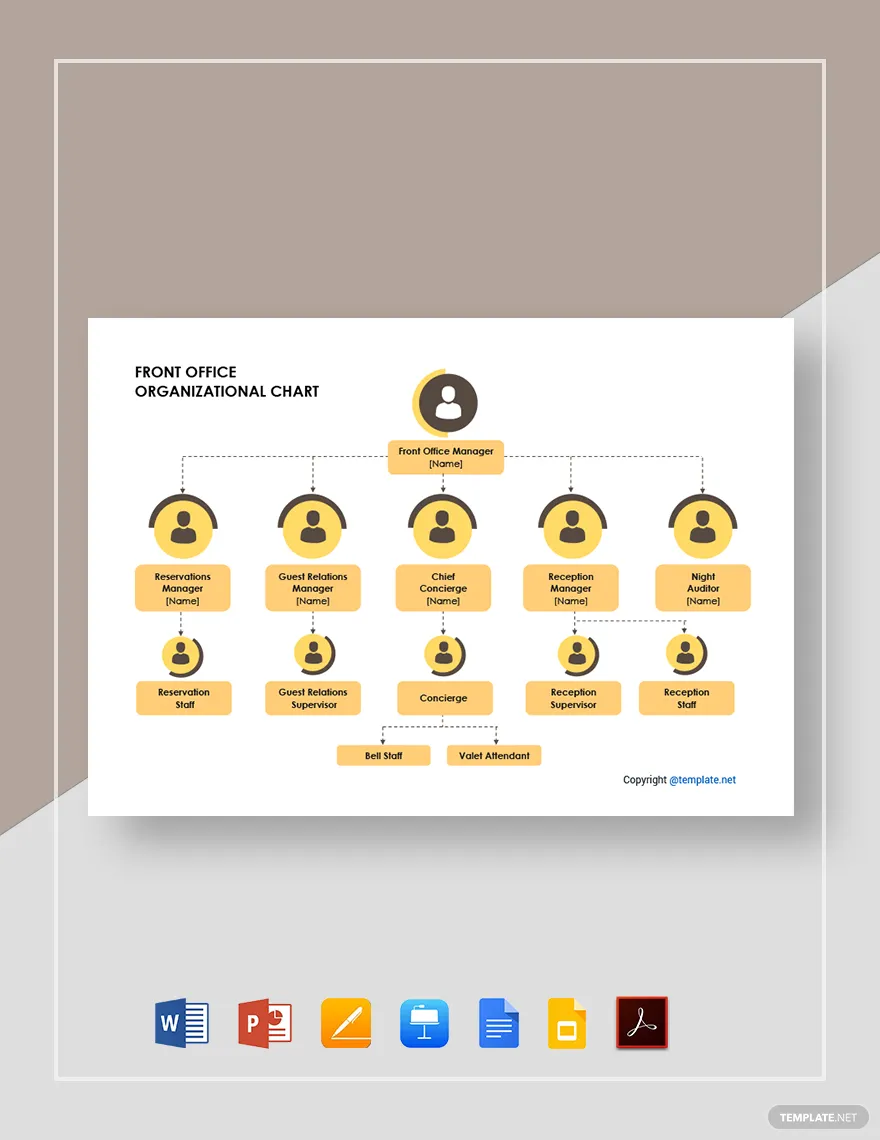
Organizational Chart
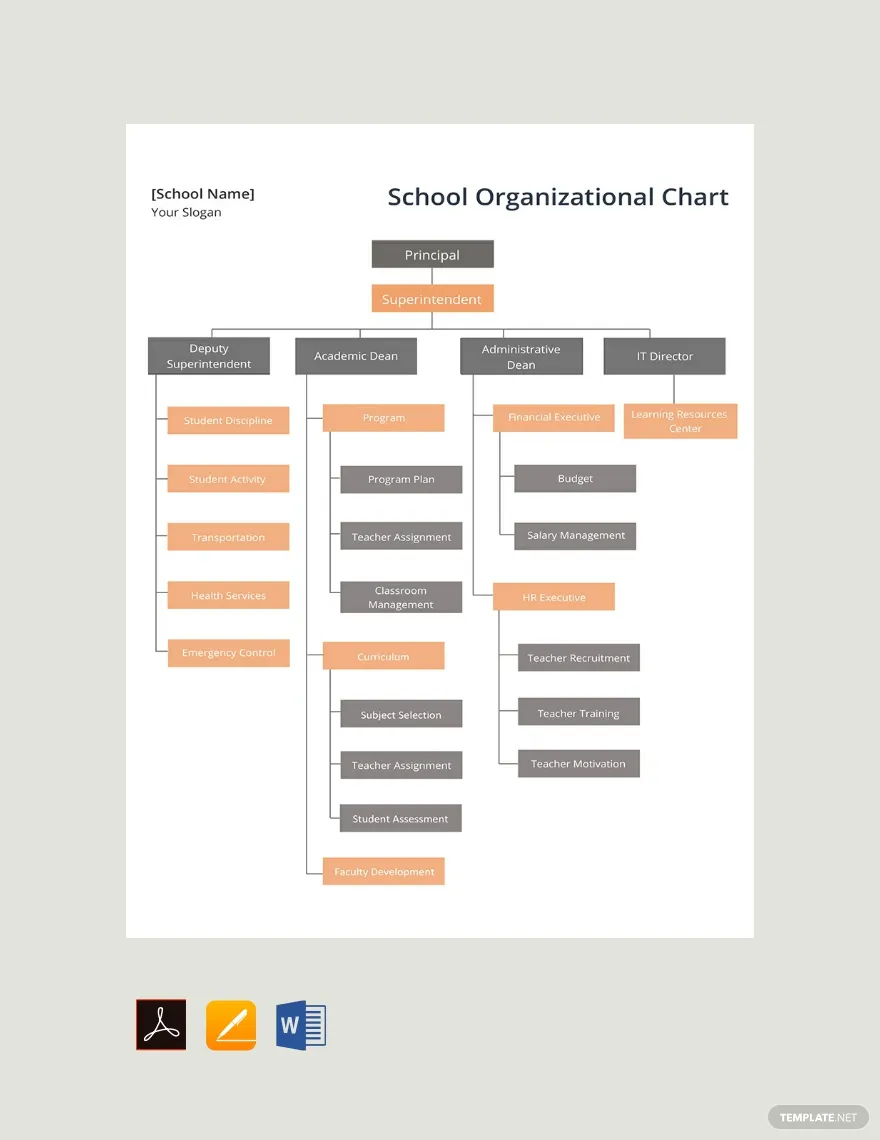
An organizational chart displays the hierarchy of the ranks or positions within the organization. It provides information regarding the roles and the workflows of the organizational members. In this chart, you can see information and images of employees inside a box and connected through lines.
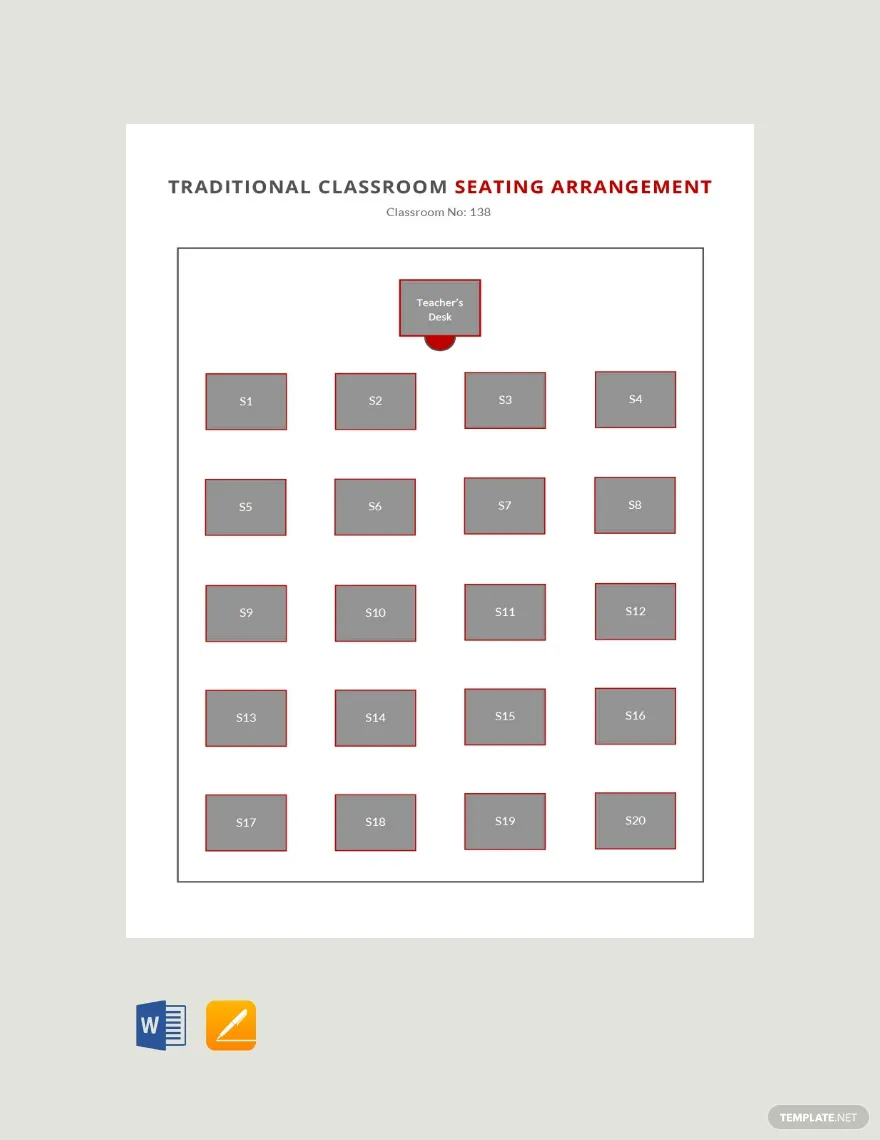
Seating Chart
Generating seating charts is an effective method of visualizing the seating arrangement during events and programs. In schools, this type of chart is also essential for mapping how students are positioned in the classroom. Assigning alphabets or numbers can work to make each seat easy to plot.
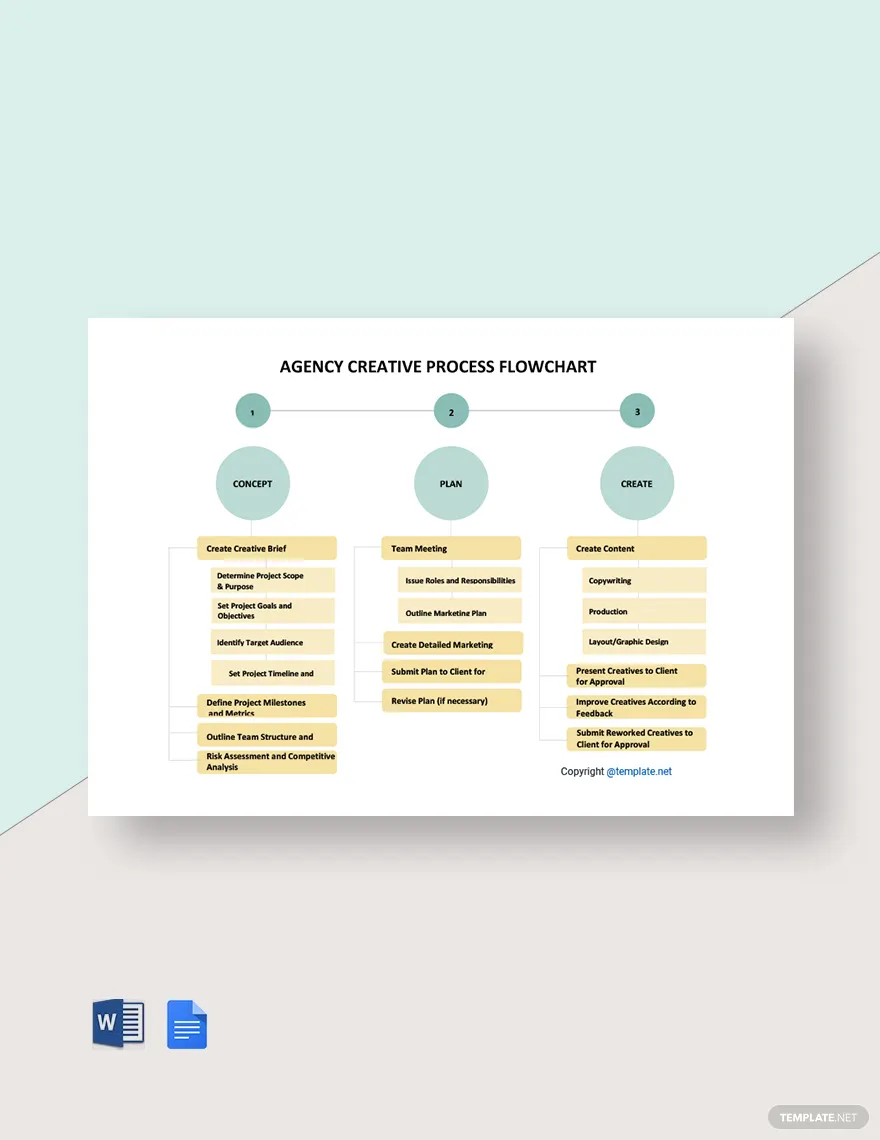
Flow Chart
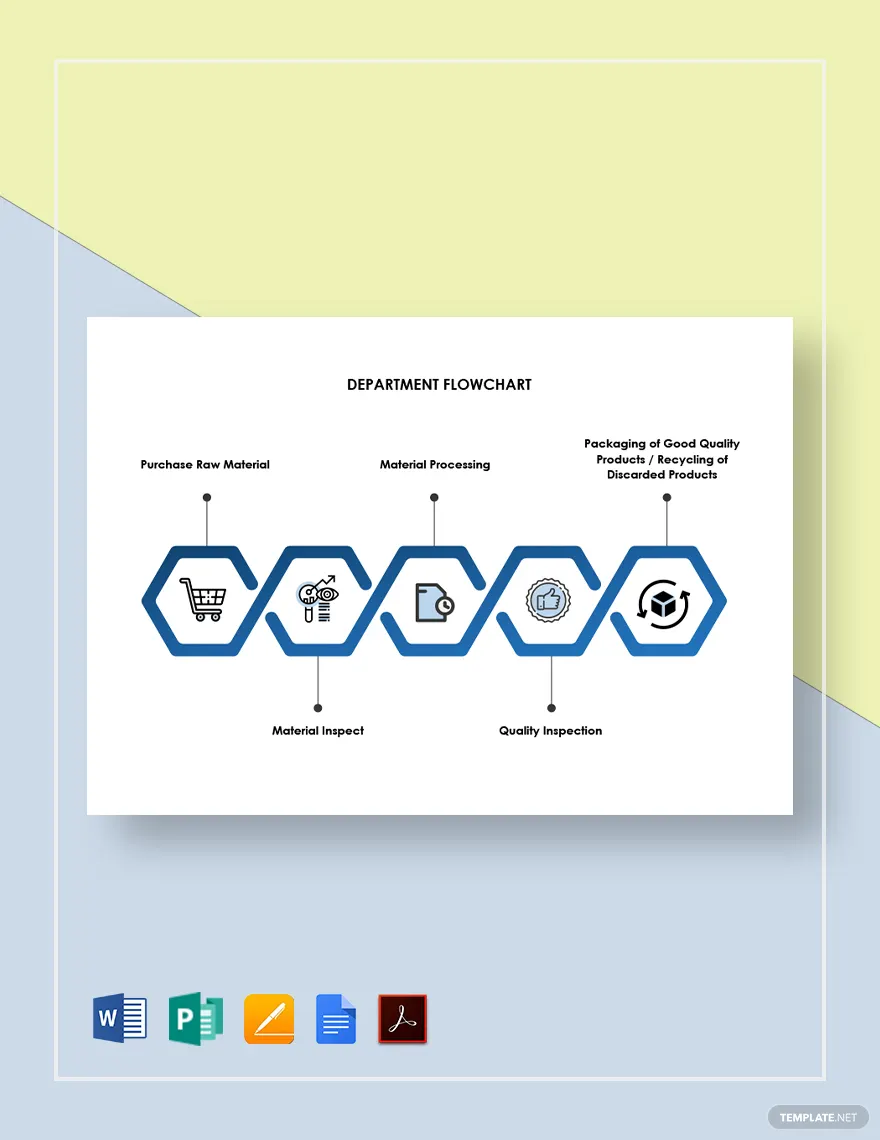
Flow charts become essential when teams want to clarify the steps or sequence to complete a process or procedure. Aside from that, it gives more insights into decision-making and problem-solving practices. When generating flow charts, you can use a variety of shapes and symbols and customize routes.
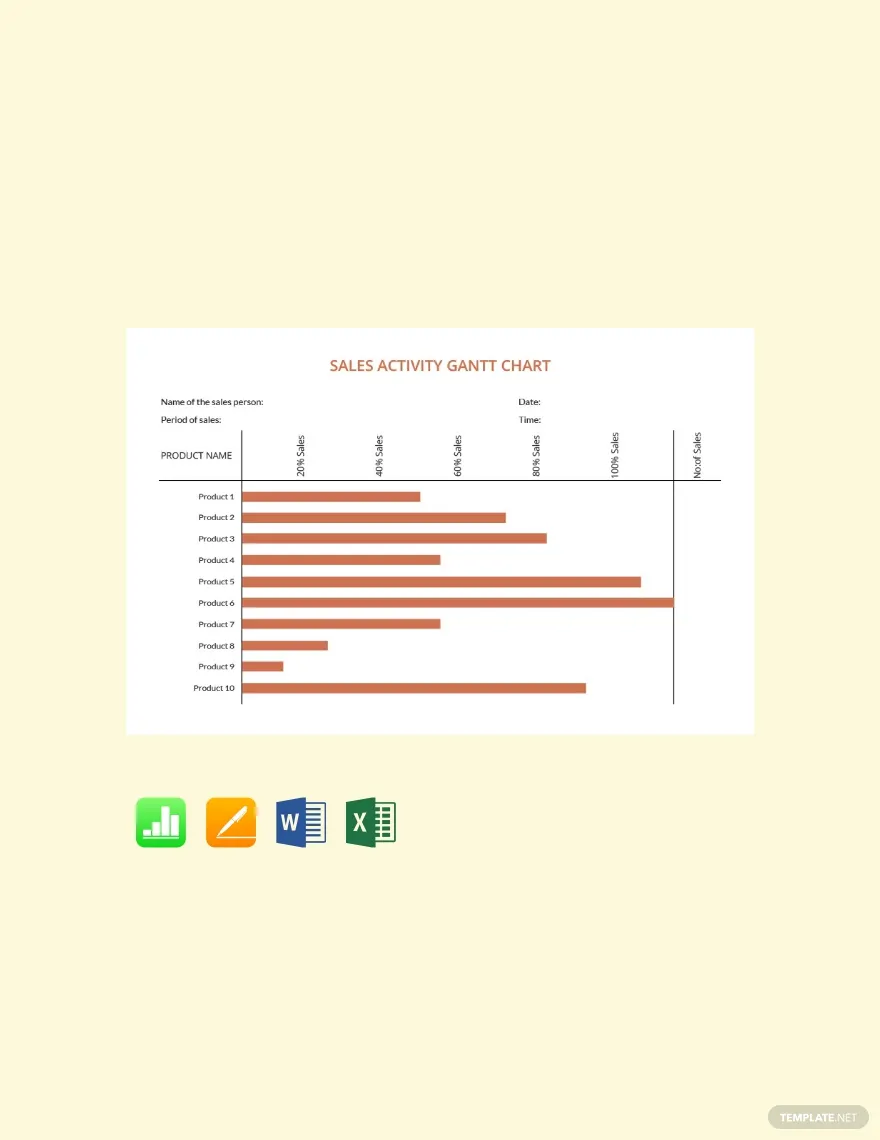
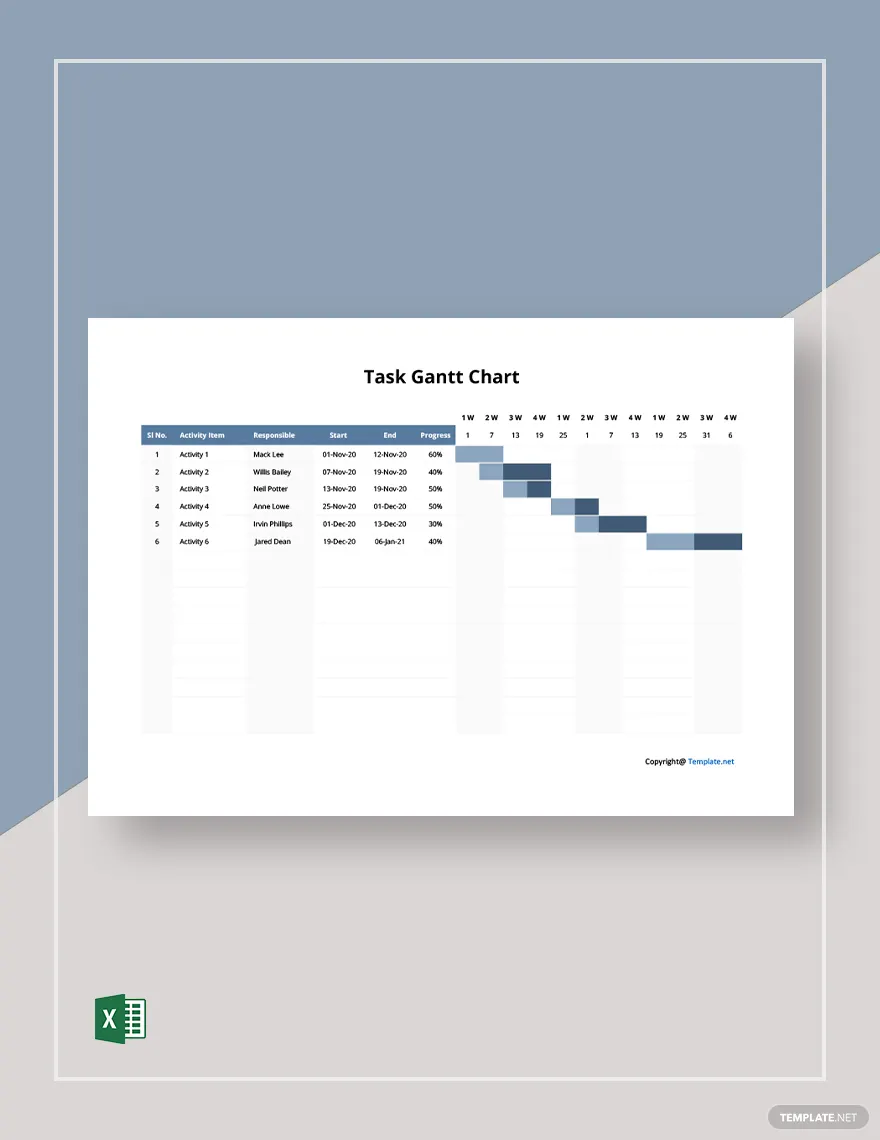
Gantt Chart
Gantt charts are partners of project managers that help reduce the weight of the workload for overseeing task delegation and tracking. It uses illustrations to present the status and timeline for project tasks. Using this chart helps with determining task dependency and enhances project scheduling practices.
Activity Chart
Activity charts have a similarity to flow charts in that they provide a graphical presentation of an activity or process. Although, it focuses more on untangling the complexities involved in the process and presenting requirements regarding coordination for each step. It includes breaking down tasks into varying categories.
Timeline Chart
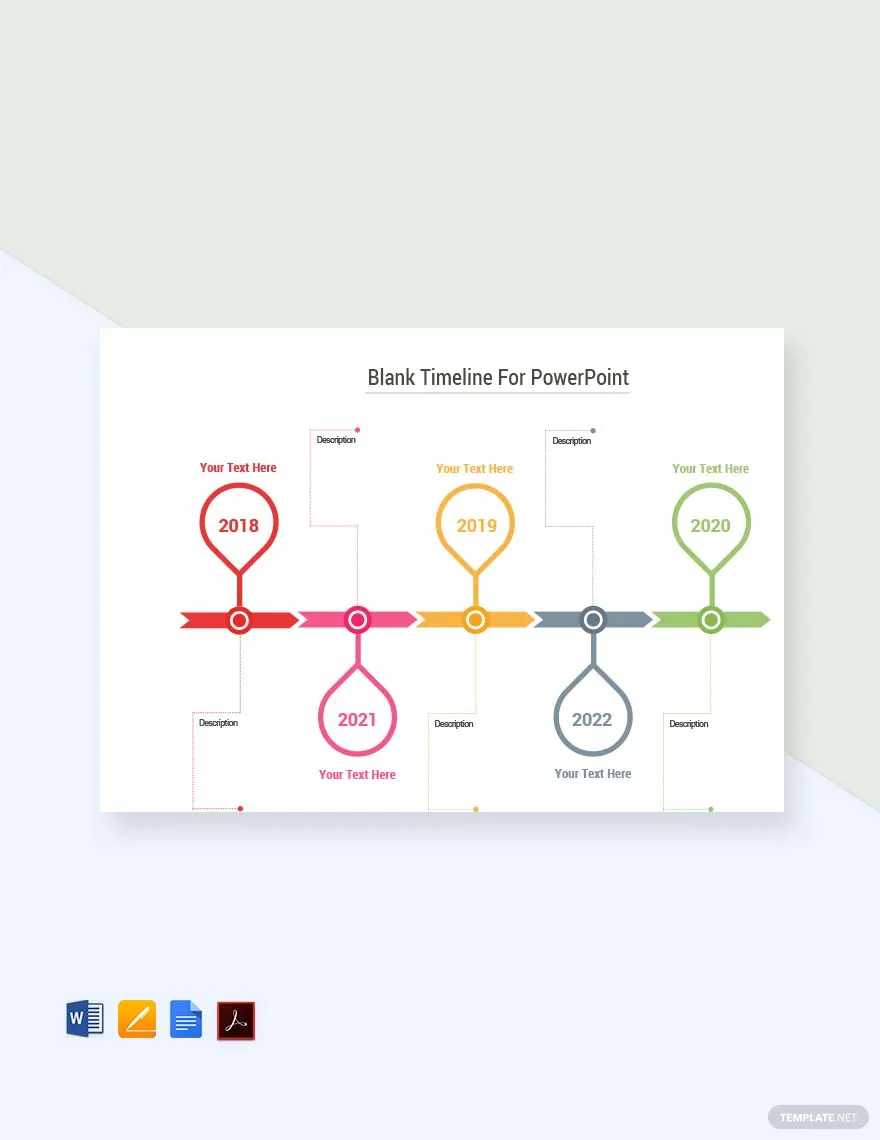
When you provide services to your clients, a timeline chart will help keep them updated regarding the project’s progress. Timeline charts arrange business tasks in chronological order and record the date started, completed, and its current status and assumed completion schedule if it is ongoing. Also, it helps you track and highlight milestones for better goal management.
Chore Chart
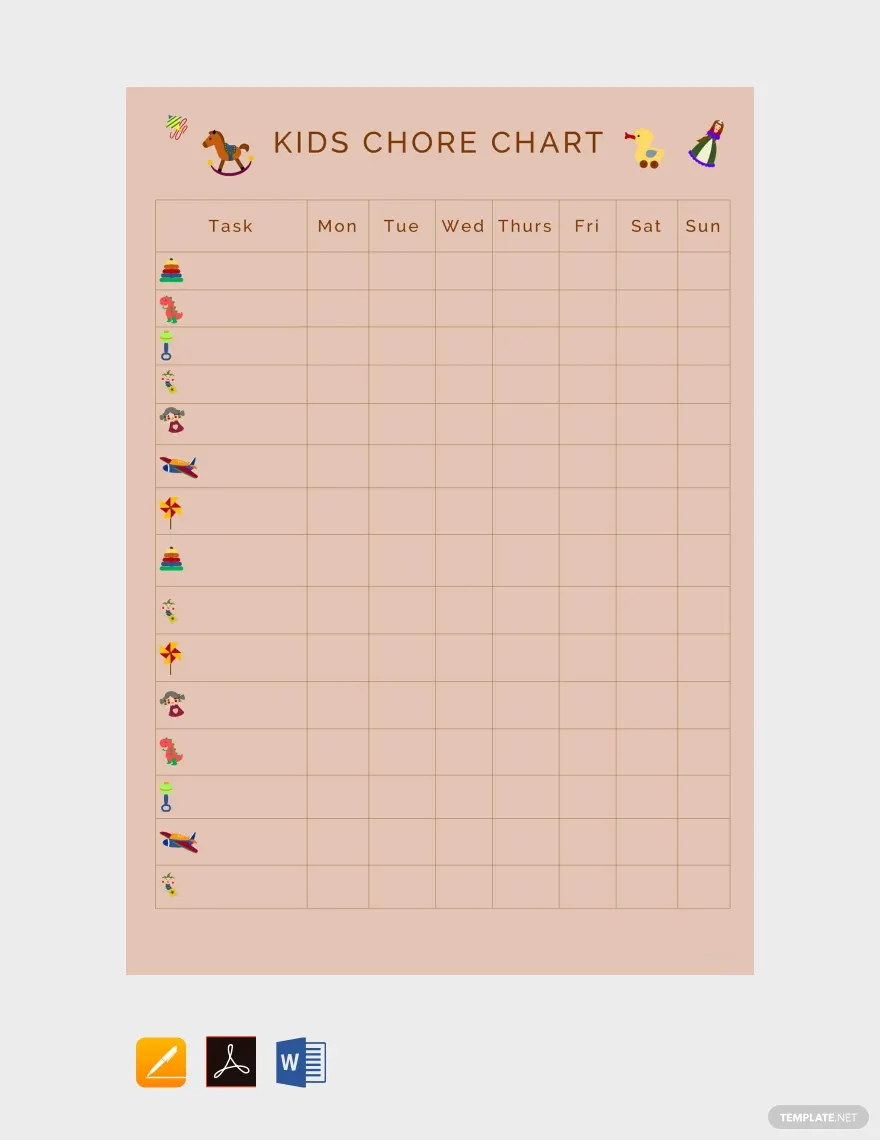
Chore charts often come in handy in most houses, classrooms, and also in some working environments. It provides details on instructions regarding the chores, the person responsible for them, and the day and time for their completion. Utilizing color coding and interesting drawings or icons keeps chore charts engaging.
School Chart
Educational institutions use school charts to guide students or parents through a process. Additionally, it comes into use when helping clients and stakeholders understand the organizational structure of the school. Administration members also use charts to present their ideas and convey a message during discussions.
Department Chart
Individuals in a department generate graphical elements combined with text and symbols to improve collaboration. With department charts, employees can undergo tasks with a clear direction and understanding of the strategy and their respective responsibilities. It keeps people on the same page.
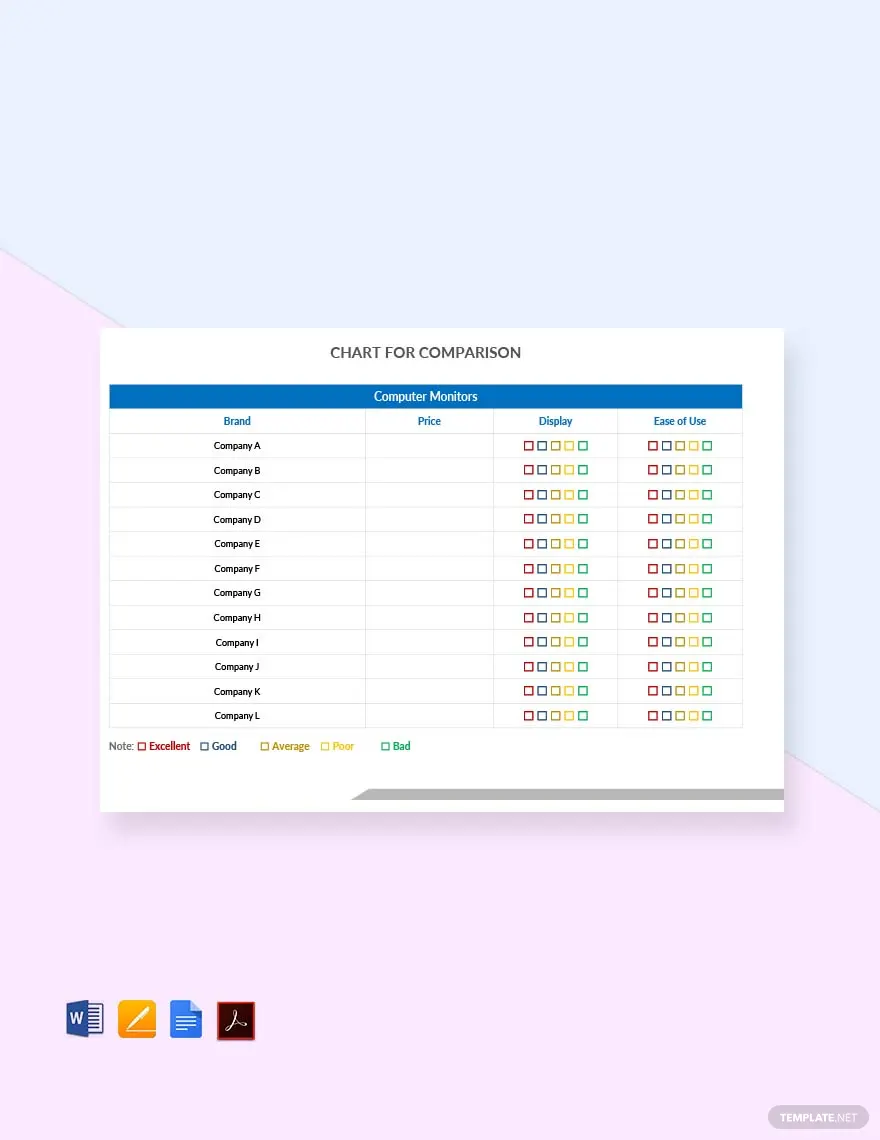
Comparison Charts
Comparison charts help you create a visual representation of data when comparing two or more things. It expands more on the similarities and differences of the objects involved with their features and varying factors. You can use it to discuss growth and changes in demand, identify areas for improvement, determine advantages and disadvantages, and have an extensive list of other things.
Chart Uses, Purpose, Importance
There is a wide variety of charts, and you can say it is flexible enough to fit varying situations and needs. That said, there are also differences in its usage for varying companies, organizations, and individuals, and sometimes it can overlap. The following are benefits and uses of charts that the general public can enjoy:
Emphasizes Crucial Points
When discussing a topic with a large audience, it is easy to get lost and confused with your points. Using charts keeps you on track, helping you deliver compelling points while following the ideal flow for maximum impact.
Fosters Better Connection With Audience
Stimulating the senses of your viewers using well-designed and organized charts makes your presentation more engrossing. It keeps your audience interested and helps you establish your desired connection with your audience.
Improves Team Collaboration
Explaining processes and instructions to team members can get taxing. In such cases, using a chart to write descriptions and describe workflows during activities and projects drives harmony within the team.
Streamlines Task Management
With all the moving parts involved when undergoing the varying phases of a project, monitoring the whos, whats, and when for task tracking can be complicated. Although, by devising a chart, you can eliminate these complexities and streamline task management.
Enhances Record-Keeping Activities
Considering how charts are helpful with making connections and explaining data, they also help keep records of historical data and other essential information. Incorporating charts into your documentation processes accelerates processes for locating and accessing necessary data.
What’s In A Chart? Parts?
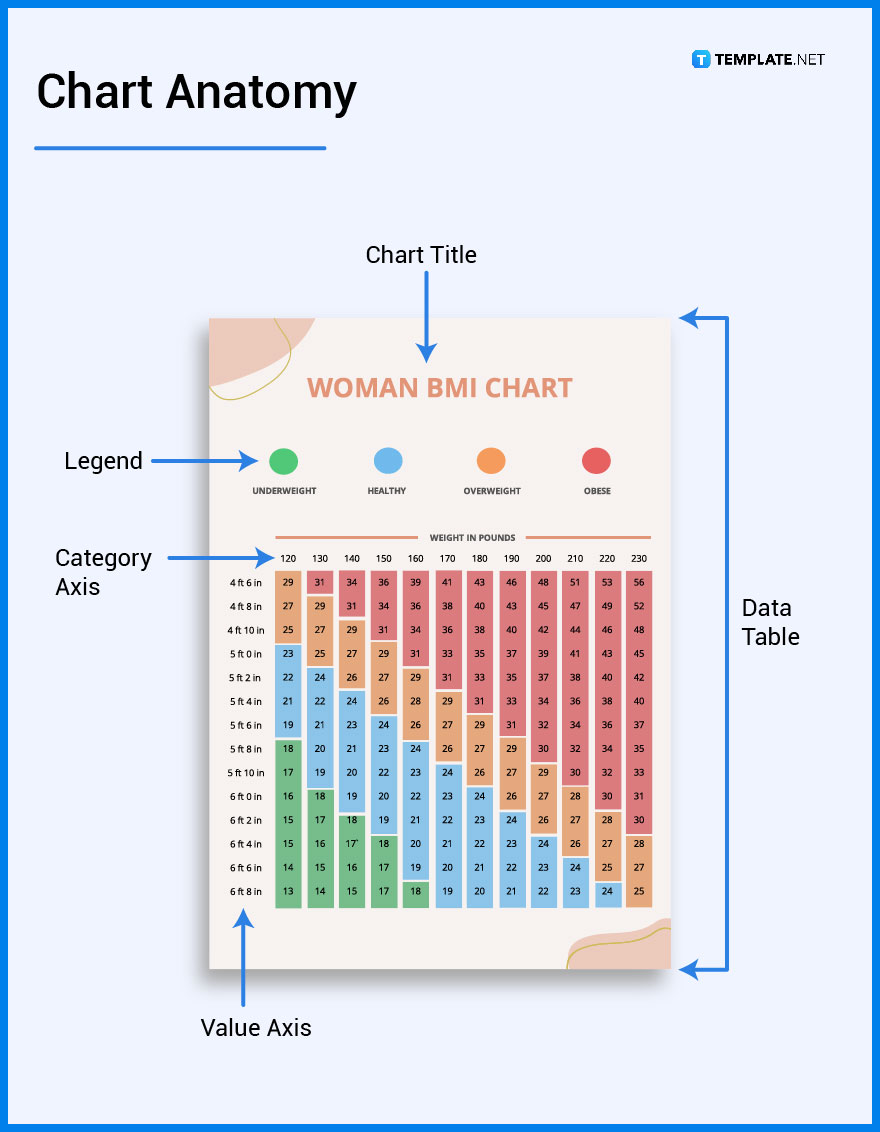
Chart Title
The chart title gives the viewers an idea of what the chart will be depicting.
Data Table
Your data table is the component where you display information in rows and columns using shapes or symbols of your choice.
Category Axis
This is the part of your chart where you label your data with their categories. It is also known as the X-axis and is essential for making the data easy to comprehend.
Value Axis
Value Axis is what others call the Y-axis. It is where you plot numerical values or percentages for measuring or comparing data.
Legend
The legend explains the colors, shapes, signs, symbols, and other elements used in the chart to avoid confusing the audience.
How to Design a Chart
1. Choose a Chart Size
2. Determine the purpose of your chart
3. Select the Chart Template
4. Customize its elements according to your preferences
5. Determine the channel to utilize for sharing your chart
6. Finalize and download
Give the following articles a read to discover how to make charts in other file formats:
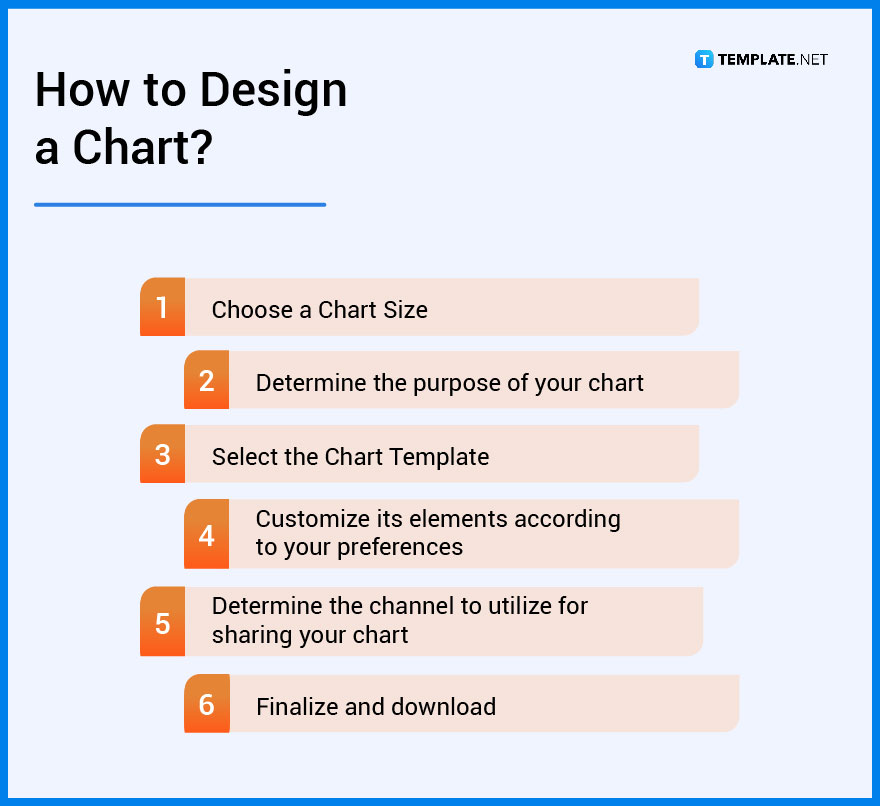
Chart Vs. Graph
Charts represent the meaning and relationship of data through varying forms including graphs.
A graph is a specific type of graph for presenting mathematical relationships for the data sets involved.
What’s the Difference Between a Chart, Flow Chart, and Diagrams?
Charts are tools incorporated into the method of using the tabular presentation of data.
Flow charts fall under the spectrum of charts, its key purpose is to help the audience visualize the sequence of a system or a process.
Diagrams primarily use images, drawings, icons, and other visual items to convey information.
Chart Sizes
The standard chart sizes for printing in the US measure 8.5” by 11”, and for other countries, including the UK, the standard paper size measures 8.3” by 11.7”. When using varying chart types, it is essential to adjust the size to ensure an optimal viewing experience for your target audience. The following is a list of other chart sizes that you should consider:
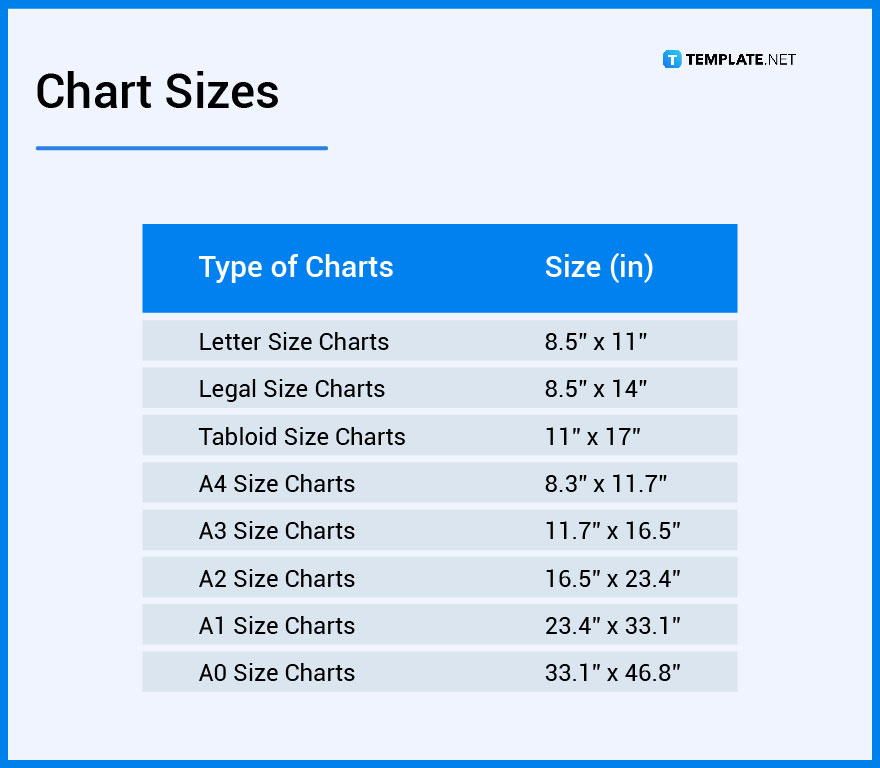
Chart Ideas & Examples
Get to know more about innovative chart styles and designs that will help you better express your thoughts and tell a story by looking into these chart ideas and examples.
- Chart Ideas and Examples
- Clothing Chart Ideas and Examples
- Table Chart Ideas and Examples
- Line Chart Ideas and Examples
- BMI Chart Ideas and Examples
- Blood Type Ideas and Examples
- Height Chart Ideas and Examples
- Qualitative Research Ideas and Examples
- Multiple Chart Ideas and Examples
- Social Chart Ideas and Examples
FAQs
What makes a chart effective?
Prioritizing clarity, relevance, and organization will improve your chart and make it more effective.
How do I create a new chart?
When using Google Docs or Microsoft Excel and PowerPoint, you need to click Insert, choose a chart, and then select the type of chart you plan to make.
Can I use charts offline?
When you print your charts or download them on your desktop or mobile devices after receiving them through emails or making one online using the internet, you can use them offline and have remote access to your charts.
Which chart type should I select to compare data?
When comparing values that usually need calculators, bar graphs and pie graphs are the most effective, and for making comparisons for concepts, you should use Venn diagrams.
Which charts are commonly used in business?
Most businesses buy and pay for plans to access and use templates, stock images, and digital tools for creating line graphs, organizational charts, bar graphs, and flow charts.
Which type of chart will be most effective?
Considering how each chart type can be effective when used appropriately, there is no specific type you can call most effective.
What is the chart range?
A dynamic chart range helps reflect changes made to the data source on the data range without much hassle.
Can a bar chart show continuous data?
When displaying continuous data, you should avoid using bar charts.
What is clustered column chart?
A clustered column chart demonstrates multiple data series using bars and clusters them into one category and separates them with other clusters.
What is the capability of line charts?
If an individual or a company wants to analyze stock chart trading patterns, line charts are helpful when presenting changes in value.
More in Chart


