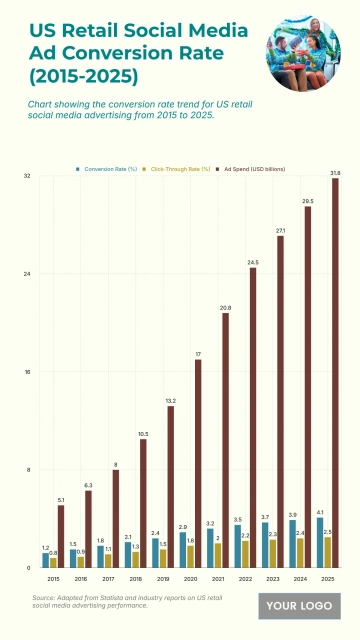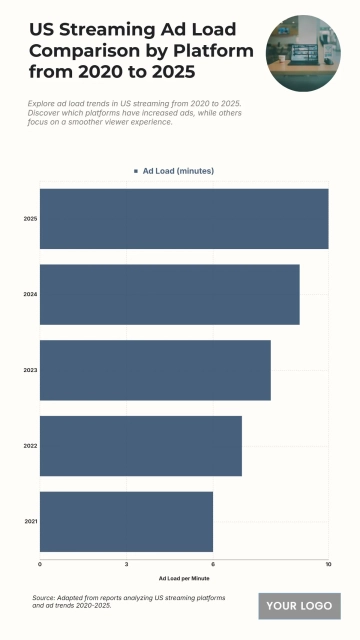
The chart displays the US Online Advertising Conversion Rate (%) from 2020 to 2025, indicating a clear and consistent increase in the rate over this six-year period. In 2020, the conversion rate was 2.3%. It then increased to 2.5% in 2021 and 2.8% in 2022. The rate crossed the 3% mark in 2023, reaching exactly 3%. The growth is projected to continue with 3.2% in 2024 and a peak of 3.4% in 2025. The total increase in the conversion rate from 2020 to 2025 is 1.1 percentage points ($\mathbf{3.4\% - 2.3\% = 1.1\%}$). This continuous upward trend suggests improvements in ad targeting, quality, and user experience, leading to more effective online advertising campaigns that successfully convert impressions into desired actions.
| Labels | Conversion Rate (%) |
| 2025 | 3.4 |
| 2024 | 3.2 |
| 2023 | 3 |
| 2022 | 2.8 |
| 2021 | 2.5 |
| 2020 | 2.3 |
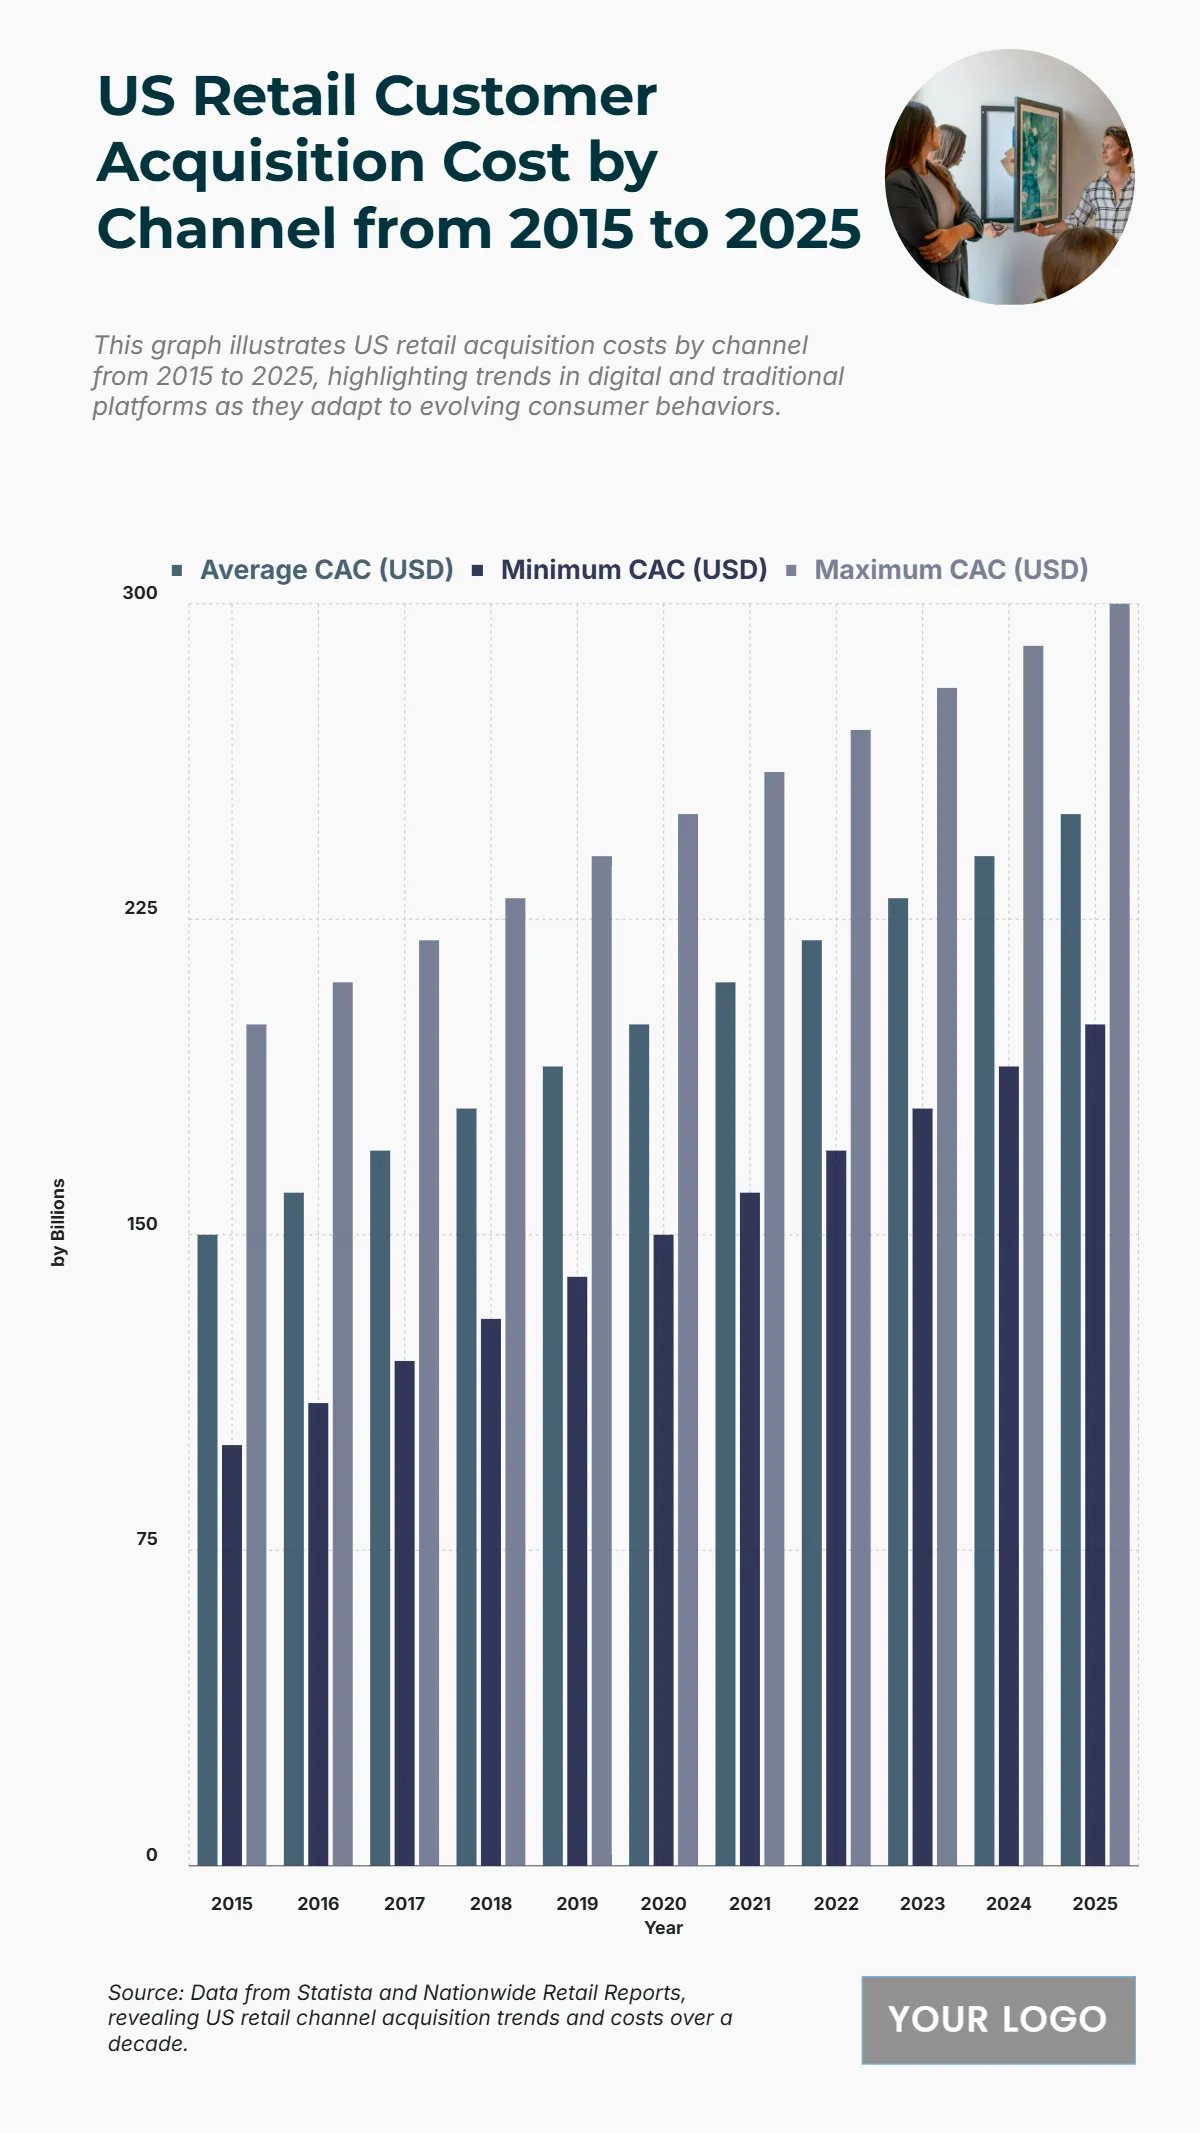
Free US Retail Customer Acquisition Cost by Channel from 2015 to 2025 Chart Template
Infographics Generator