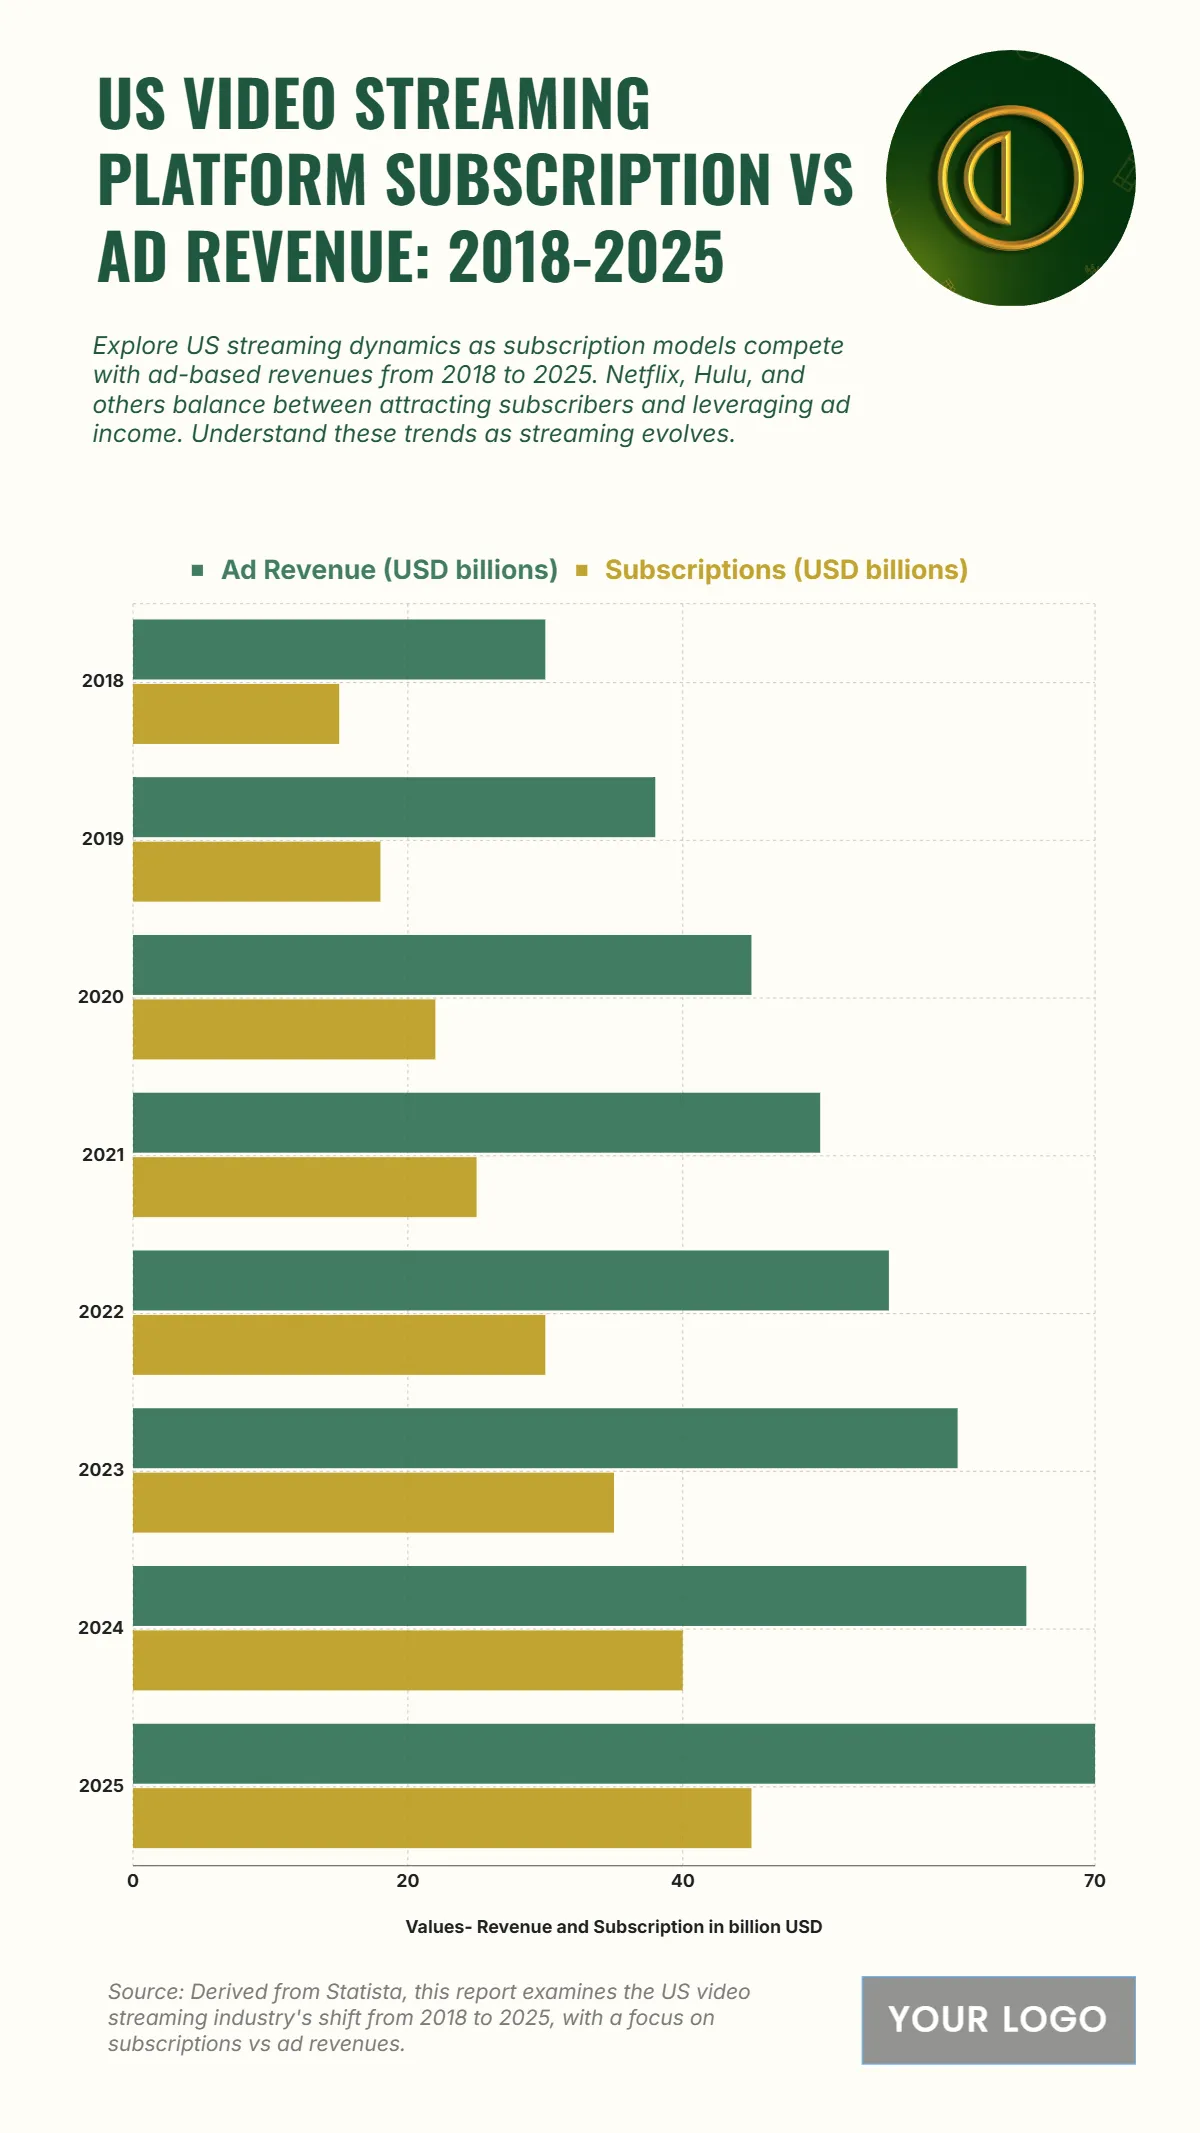
Free US Video Streaming Platform Subscription vs Ad Revenue from 2018 to 2025 Chart
The chart displays the US Video Streaming Platform Ad Revenue (USD billions) and Subscriptions (USD billions) from 2018 to 2025, illustrating a consistent and significant upward trend in both revenue streams. Ad Revenue (USD billions) grew faster, rising from 30 billion USD in 2018 to 70 billion USD in 2025. Subscriptions (USD billions) also increased substantially, moving from 15 billion USD in 2018 to 45 billion USD in 2025. In every year shown, Ad Revenue is significantly higher than Subscription Revenue, with the gap projected to be 25 billion USD in 2025 ($\mathbf{70 \text{ billion USD} - 45 \text{ billion USD} = 25 \text{ billion USD}}$). The data highlights the increasing importance of ad-supported models, even as subscription revenues continue to grow, underscoring the hybrid nature of the US video streaming market.
| Labels | Ad Revenue (USD billions) | Subscriptions (USD billions) |
| 2018 | 30 | 15 |
| 2019 | 38 | 18 |
| 2020 | 45 | 22 |
| 2021 | 50 | 25 |
| 2022 | 55 | 30 |
| 2023 | 60 | 35 |
| 2024 | 65 | 40 |
| 2025 | 70 | 45 |


