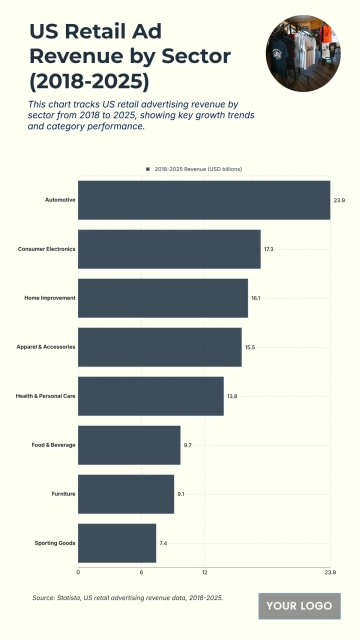
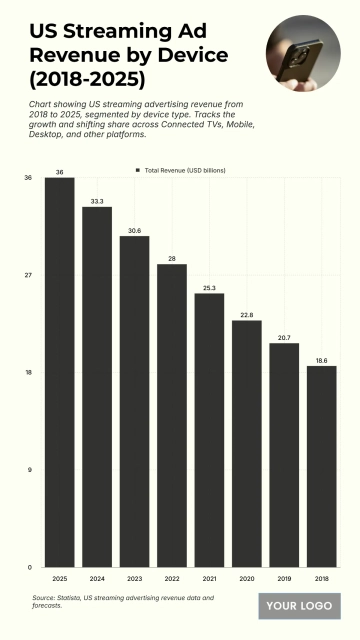
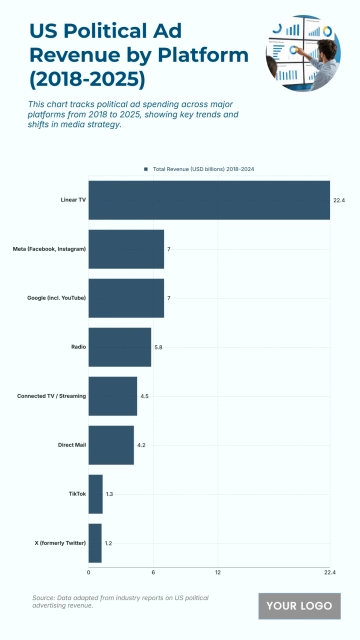
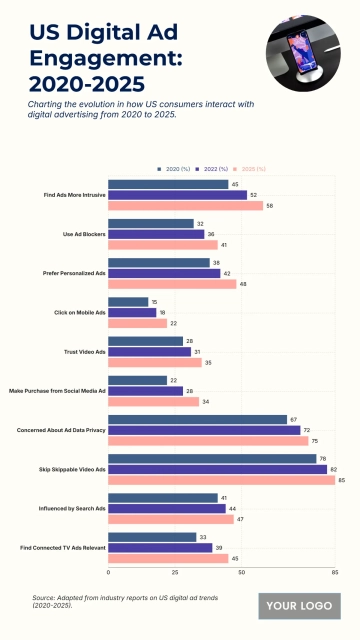
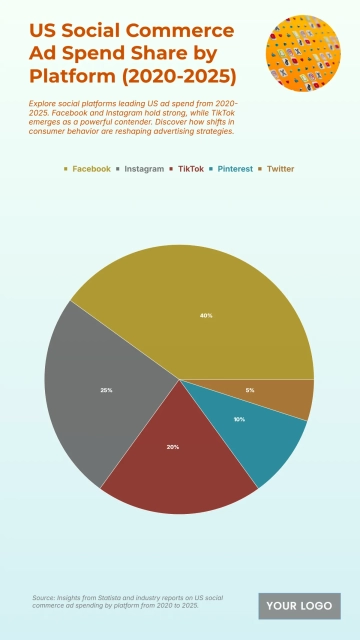
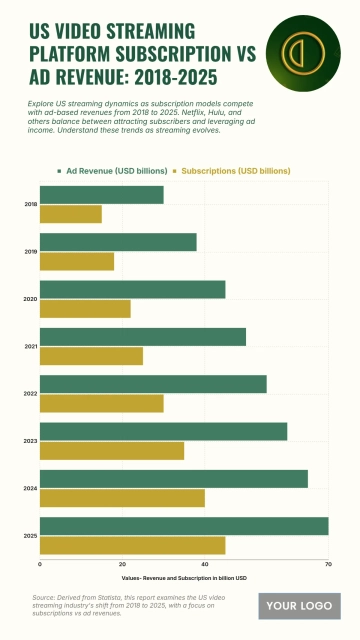
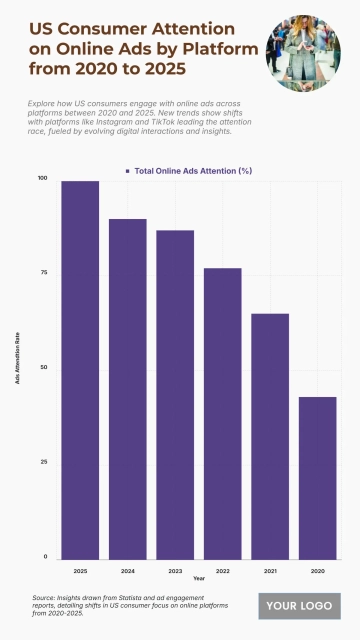
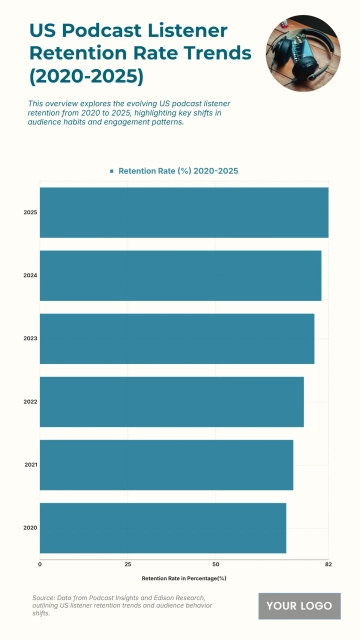
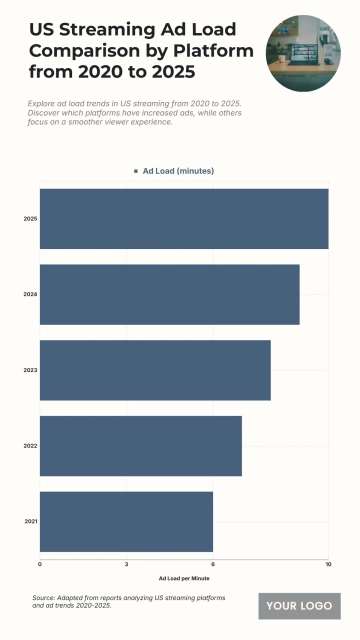
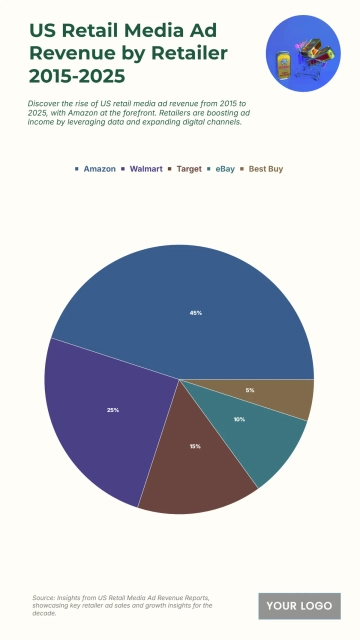
An informative 9:16 chart for comparing digital marketing spend across the top US states from 2018 to 2025, professionally designed by Template.net, with a large pie chart, a color-coded legend and a desk photo in brown, muted blue and dark teal.
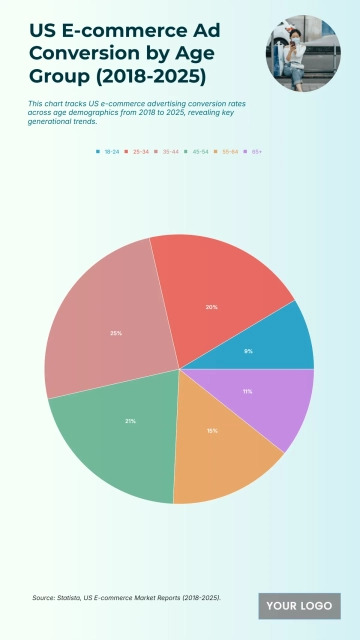
An informative 9:16 chart for comparing digital marketing spend across the top US states from 2018 to 2025, professionally designed by Template.net, with a large pie chart, a color-coded legend and a desk photo in brown, muted blue and dark teal.