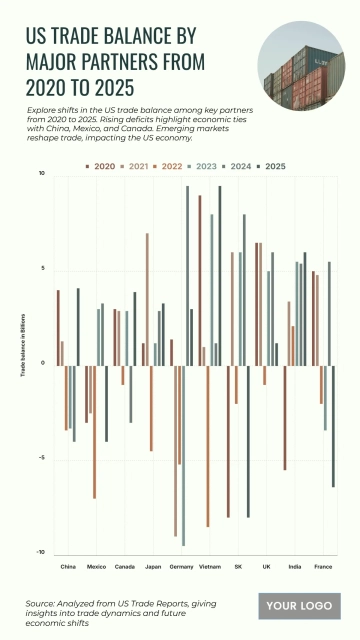
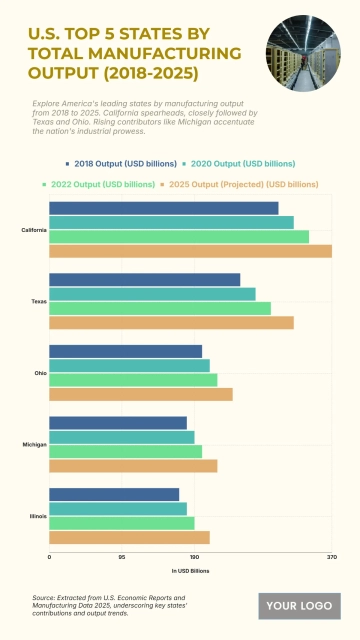
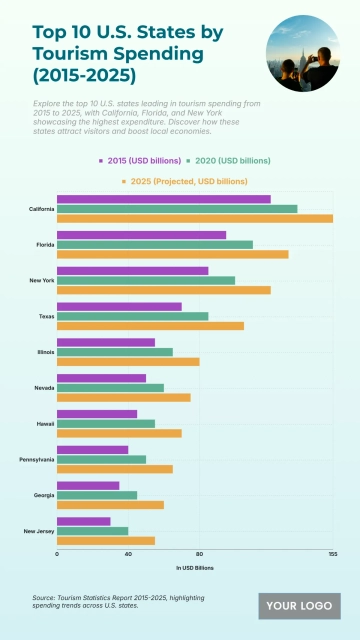
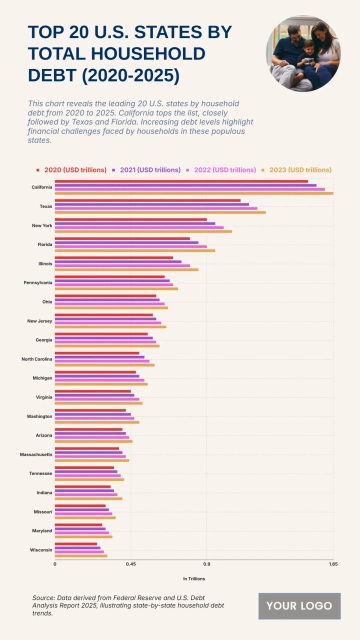
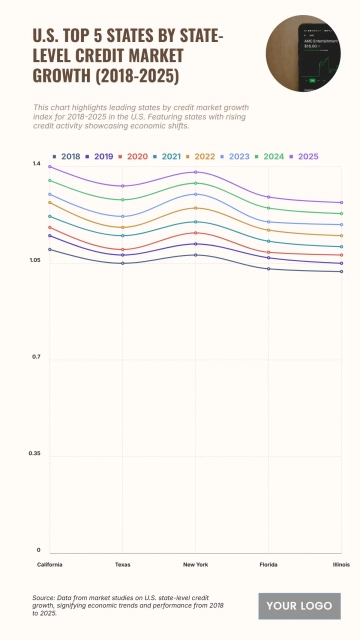
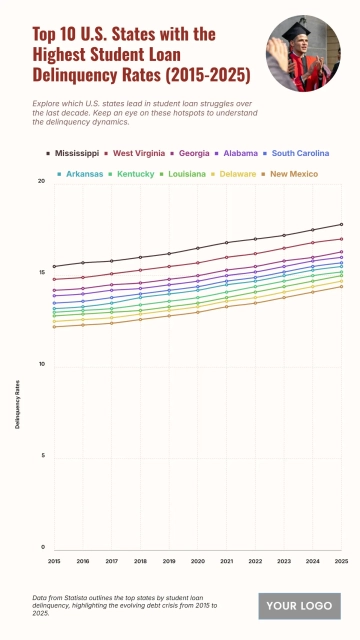
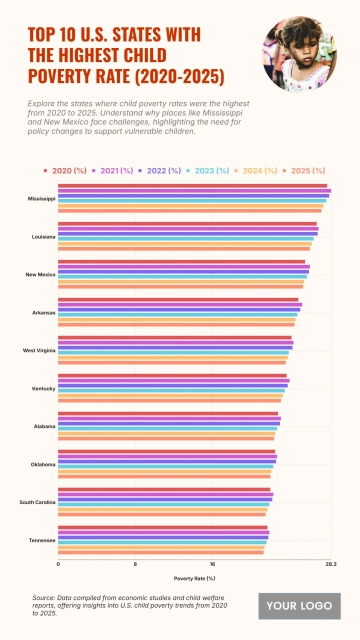
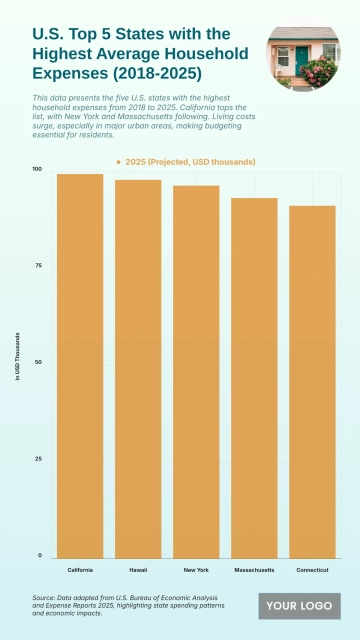
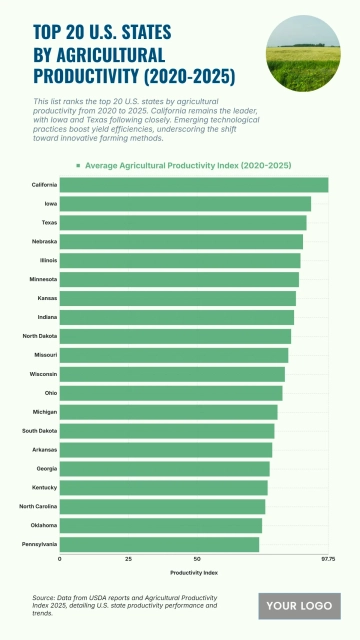
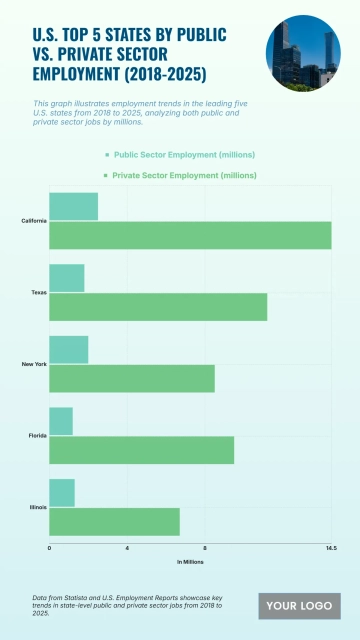
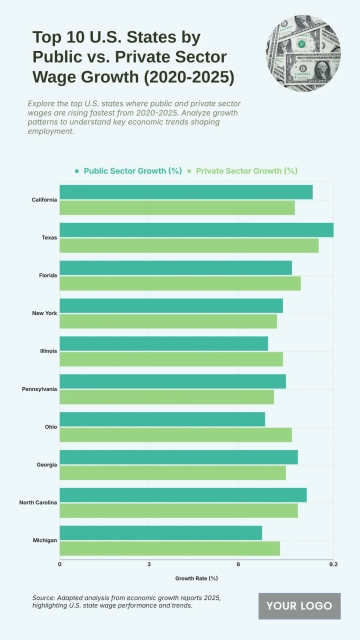
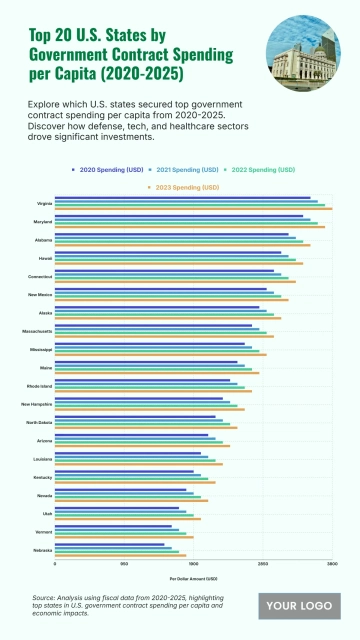
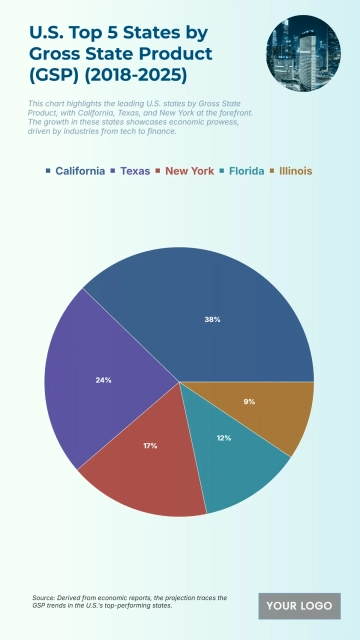
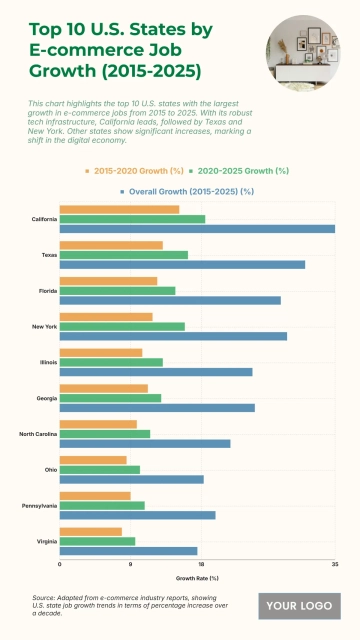
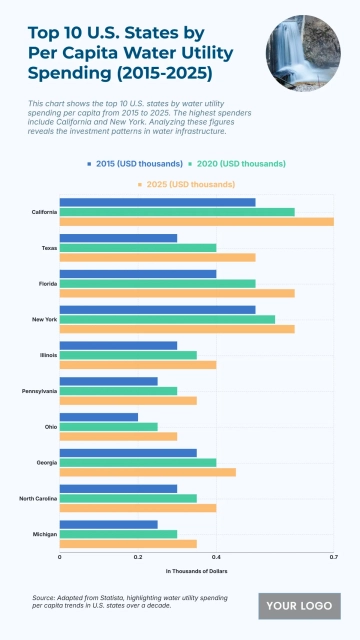
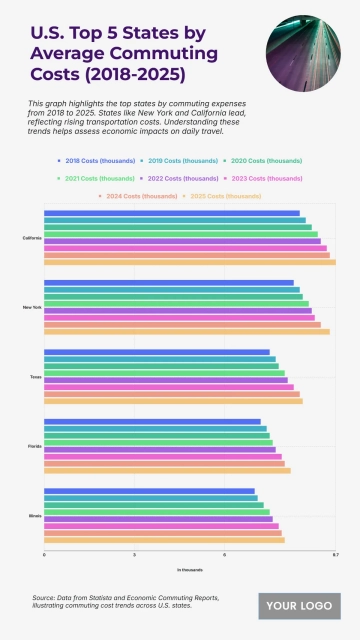
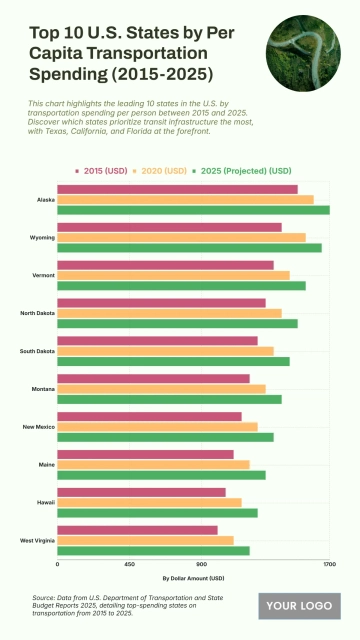
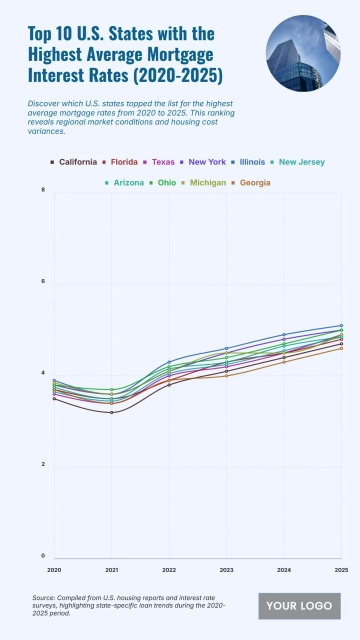
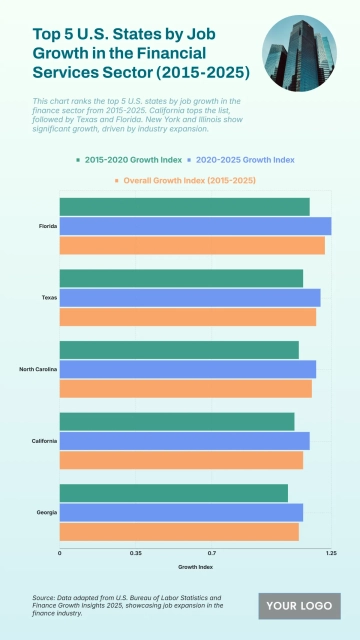
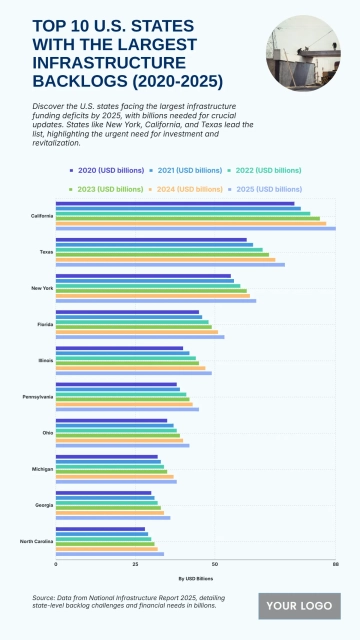
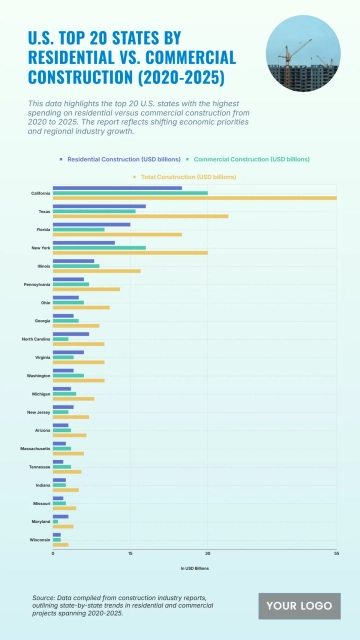
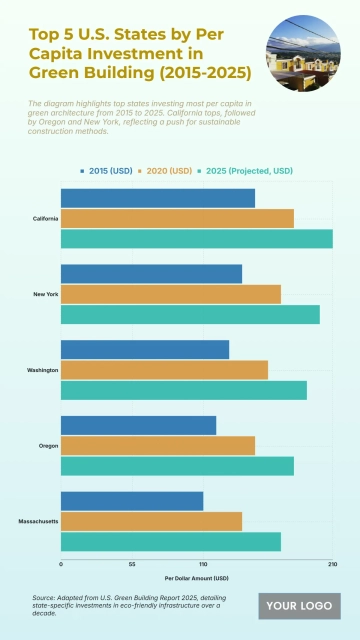
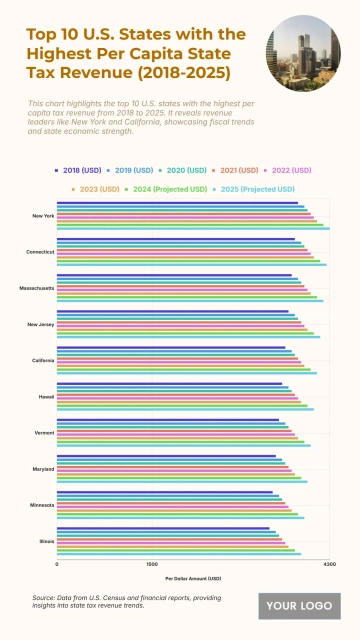
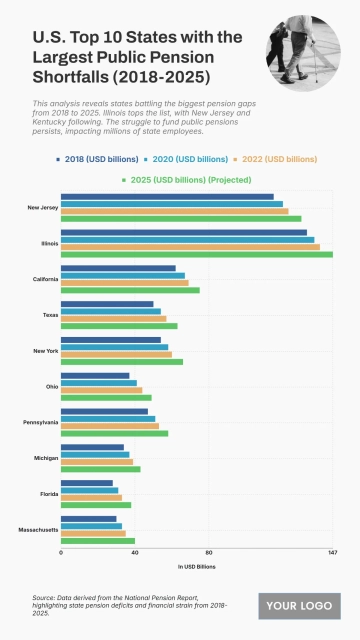
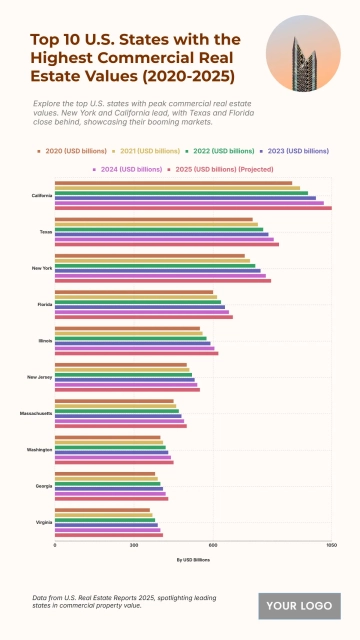
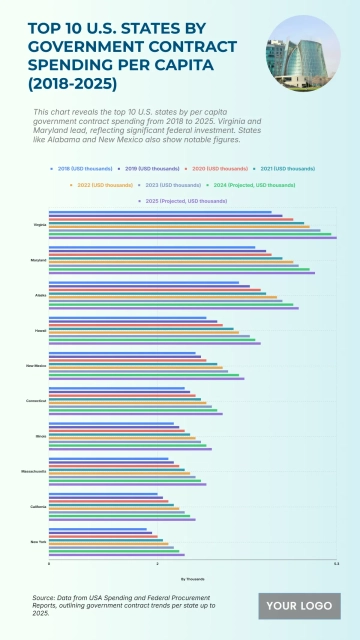
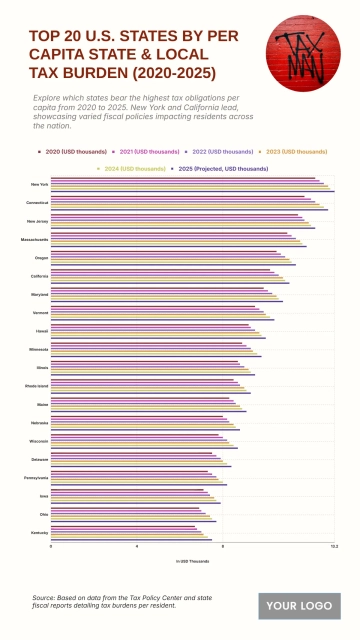
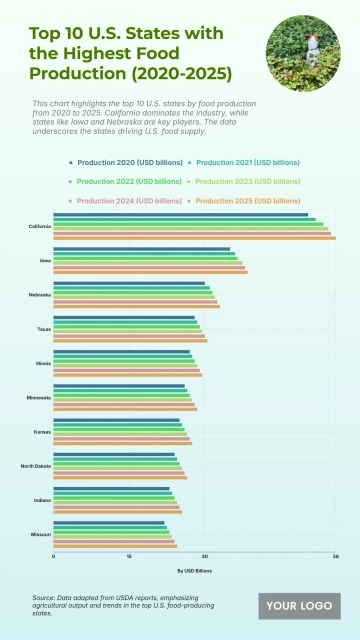
A professional 9:16 economy chart for presenting US investment inflows by sector, professionally designed by Template.net, with a grouped horizontal bar chart, a stock market photo and a summary paragraph in pastel pink, aqua blue and purple.
A professional 9:16 economy chart for presenting US investment inflows by sector, professionally designed by Template.net, with a grouped horizontal bar chart, a stock market photo and a summary paragraph in pastel pink, aqua blue and purple.