Free Top 10 U.S. States with the Highest Food Production (2020-2025)
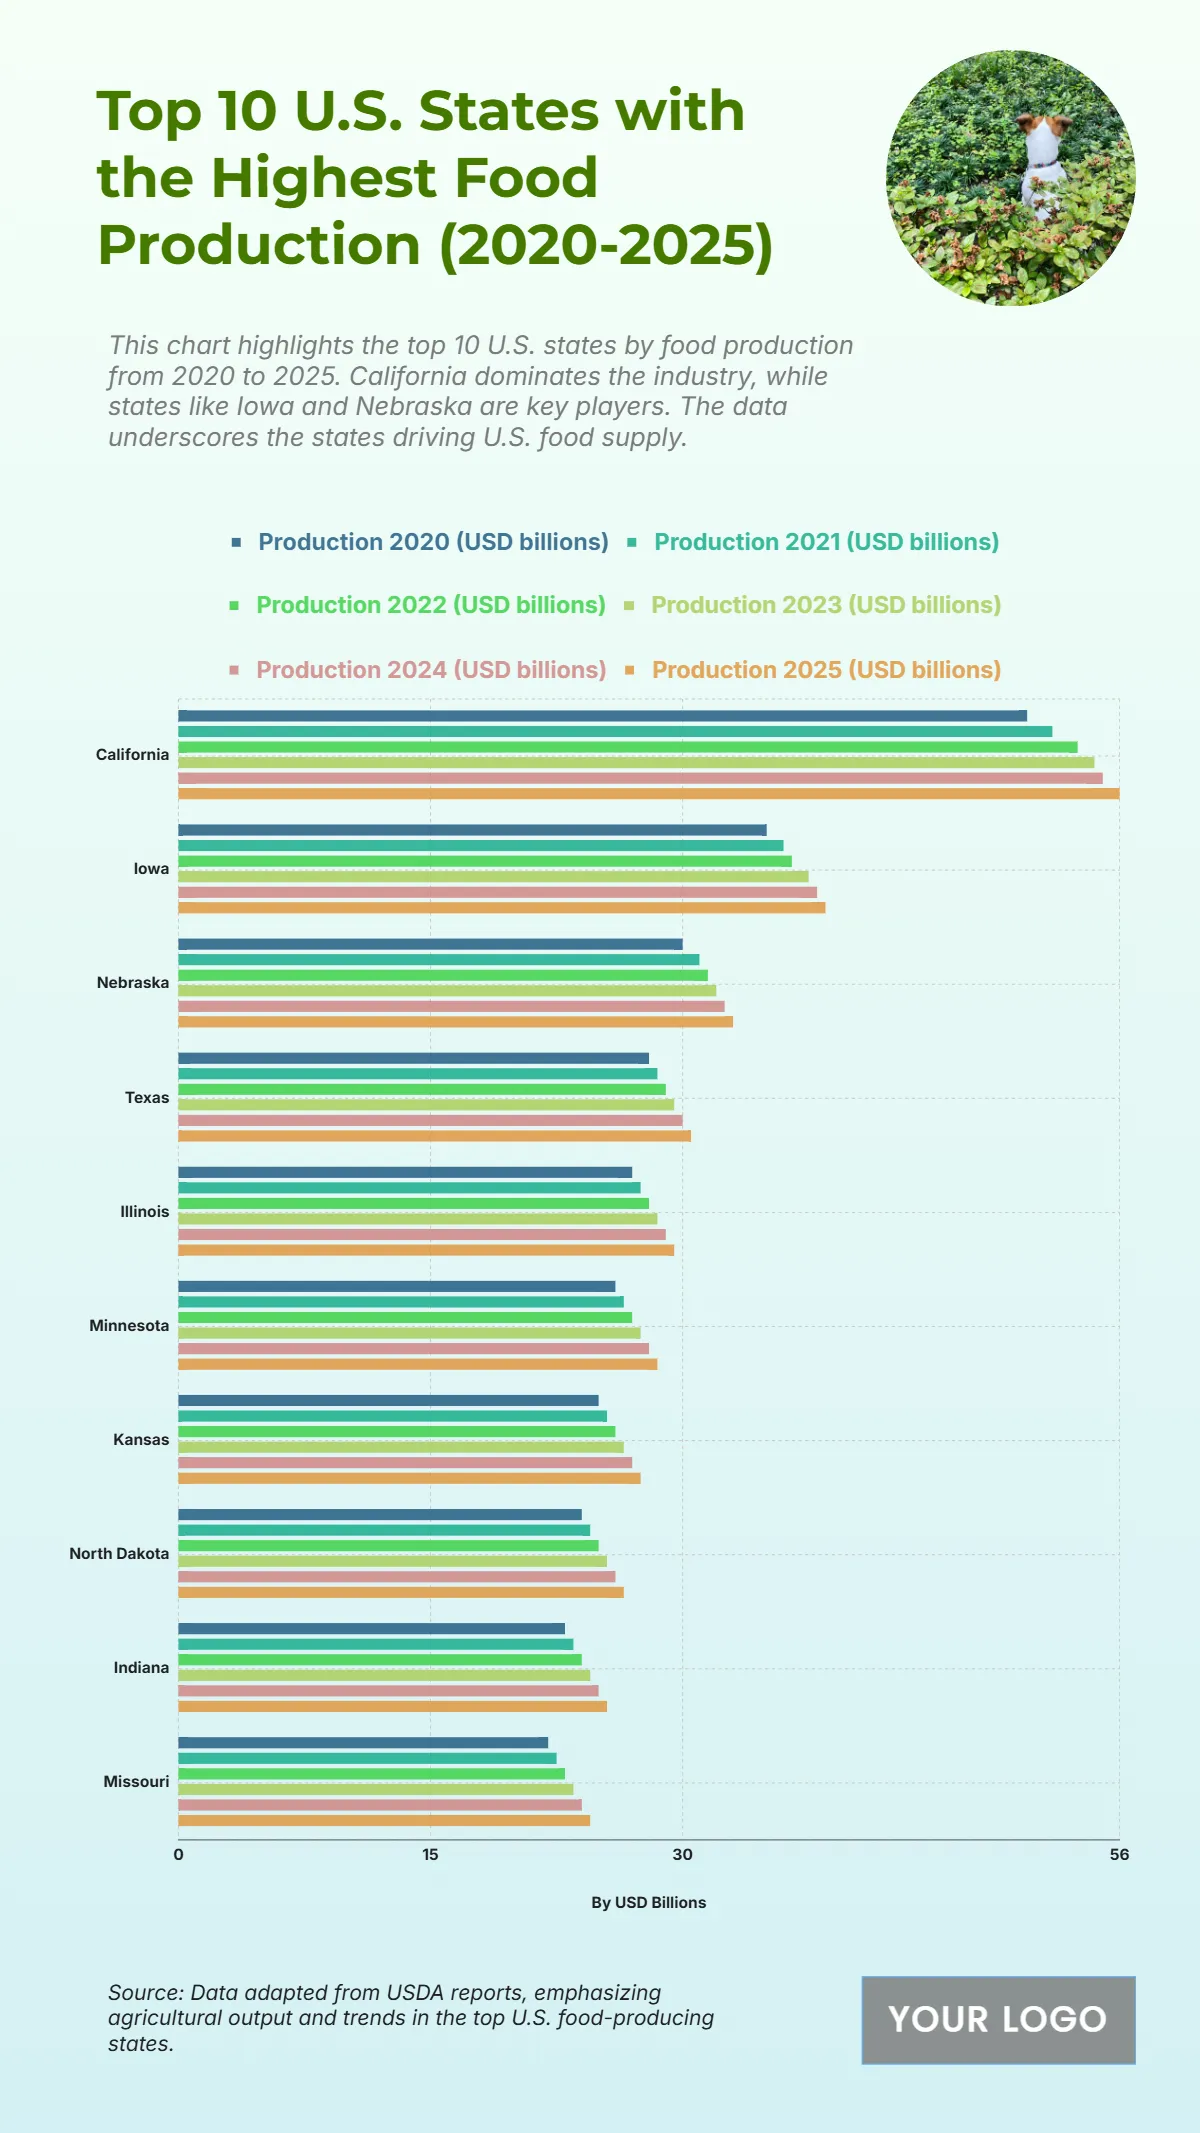
The chart shows the steady growth of food production among the top 10 U.S. states from 2020 to 2025, emphasizing their crucial roles in the national food supply. California leads significantly, increasing from $50.5 billion in 2020 to $56 billion in 2025, maintaining its dominance in agricultural output. Iowa follows, rising from $35 billion to $38.5 billion, while Nebraska grows from $30 billion to $33 billion. Texas and Illinois both show moderate but consistent increases, reaching $30.5 billion and $29.5 billion, respectively, by 2025. States like Minnesota, Kansas, and North Dakota also record steady growth, each adding roughly $1–2.5 billion over the period. Meanwhile, Indiana and Missouri display more gradual gains, reaching $24.5 billion by 2025. Overall, the data underscores California’s strong lead and reflects a healthy upward trend across all major food-producing states.
| Labels | 2020 | 2021 | 2022 | 2023 | 2024 | 2025 |
|---|---|---|---|---|---|---|
| California | 50.5 | 52 | 53.5 | 54.5 | 55 | 56 |
| Iowa | 35 | 36 | 36.5 | 37.5 | 38 | 38.5 |
| Nebraska | 30 | 31 | 31.5 | 32 | 32.5 | 33 |
| Texas | 28 | 28.5 | 29 | 29.5 | 30 | 30.5 |
| Illinois | 27 | 27.5 | 28 | 28.5 | 29 | 29.5 |
| Minnesota | 26 | 26.5 | 27 | 27.5 | 28 | 28.5 |
| Kansas | 25 | 25.5 | 26 | 26.5 | 27 | 27.5 |
| North Dakota | 24 | 24.5 | 25 | 25.5 | 26 | 26.5 |
| Indiana | 23 | 23.5 | 24 | 24.5 | 25 | 25.5 |
| Missouri | 22 | 22.5 | 23 | 23.5 | 24 | 24.5 |


