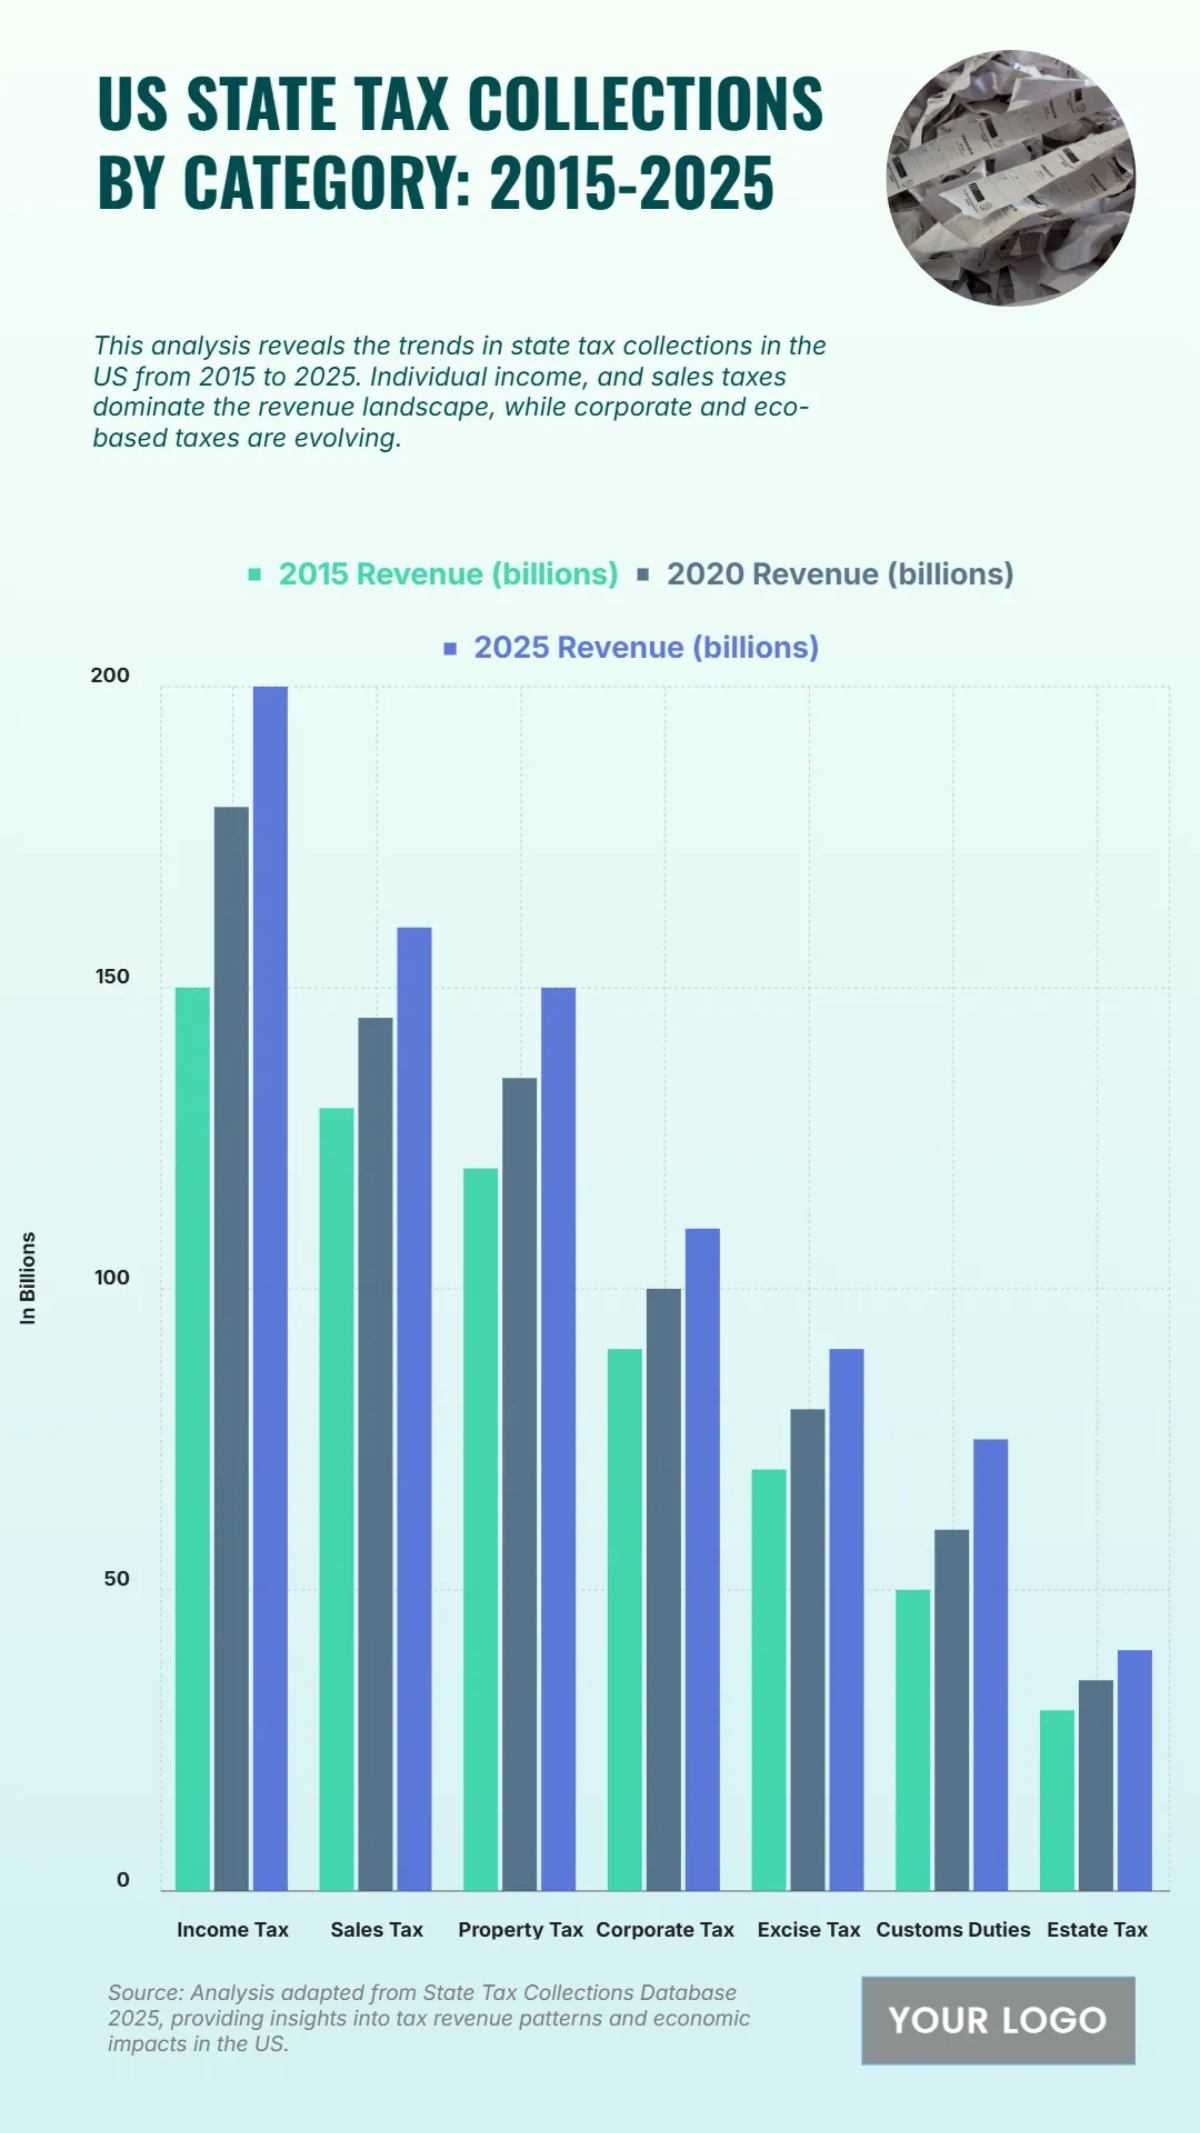
The chart provides an overview of US state tax collections by category from 2015 to 2025, revealing a consistent and significant upward trend across all major revenue sources. Income tax, sales tax, and property tax are the top three revenue generators, with income tax showing the largest growth from $150 billion in 2015 to $200 billion in 2025. Sales tax revenue also saw a strong increase from $130 billion to $160 billion, while property tax collections grew from $120 billion to $150 billion.