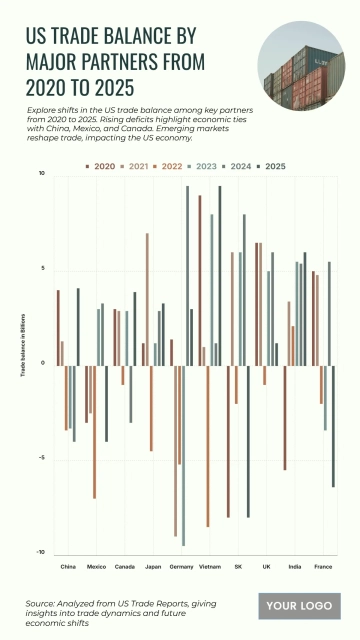
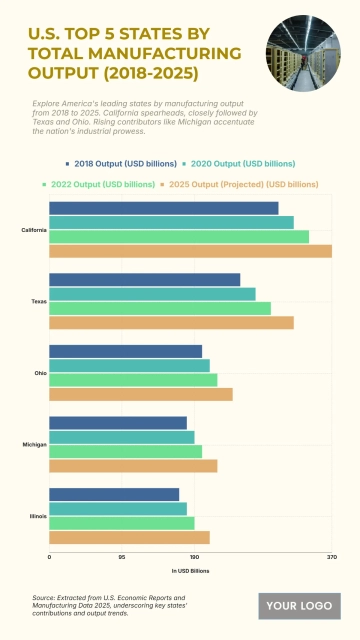
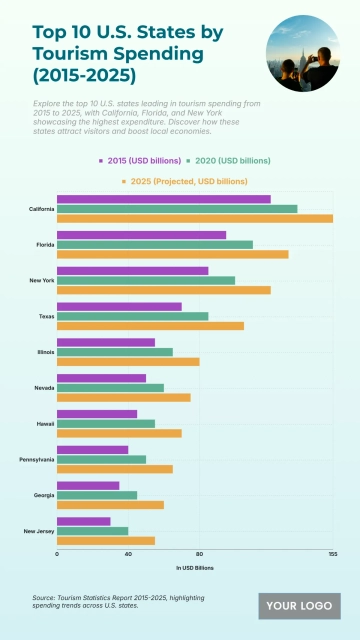
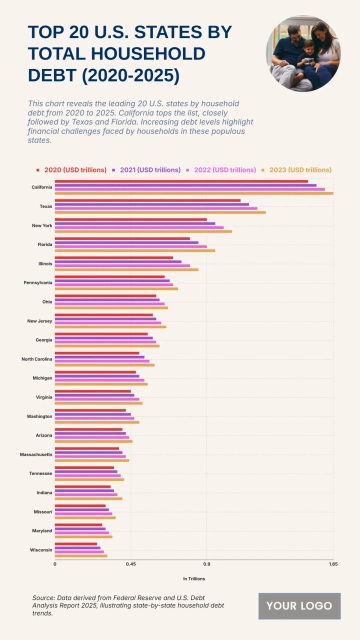
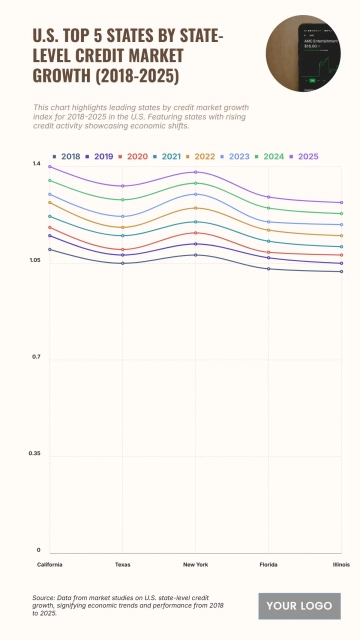
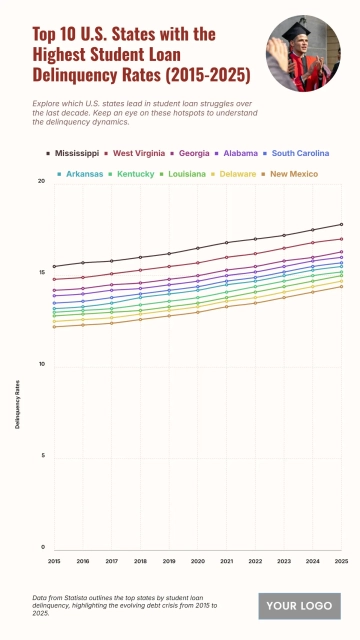
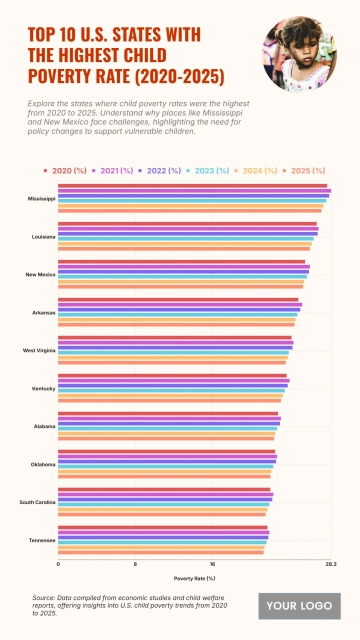
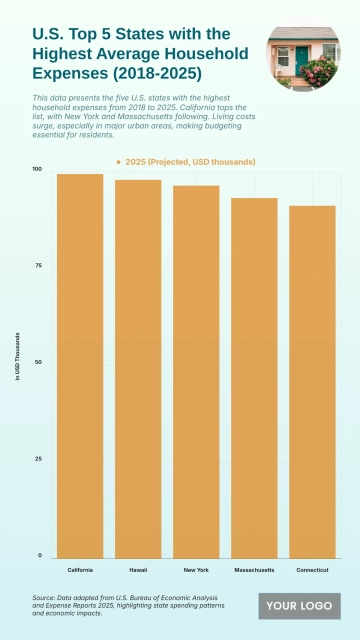
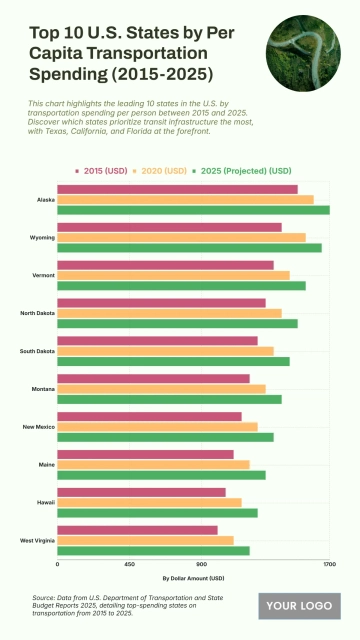
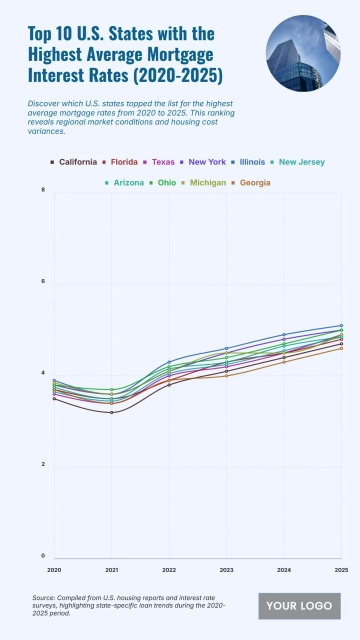
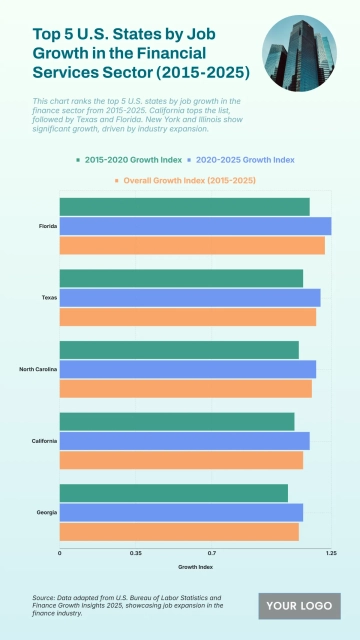
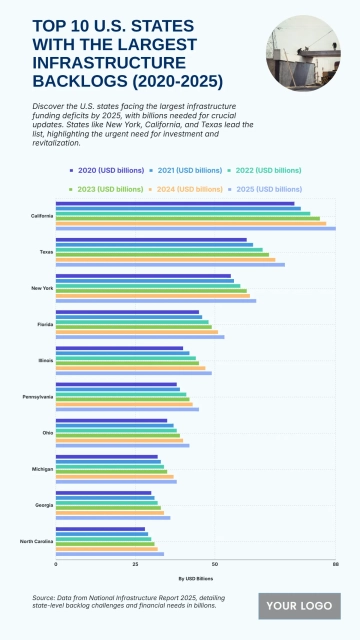
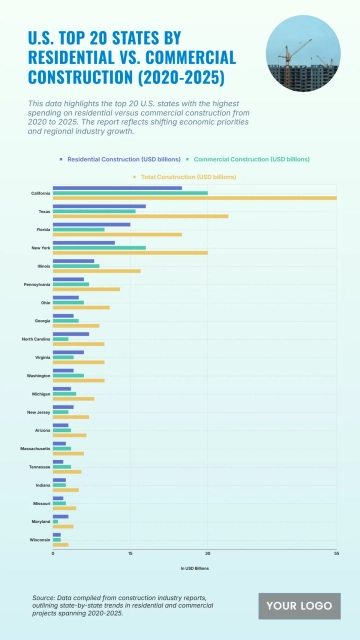
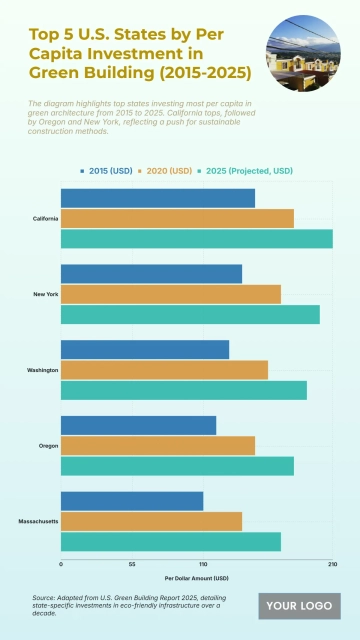
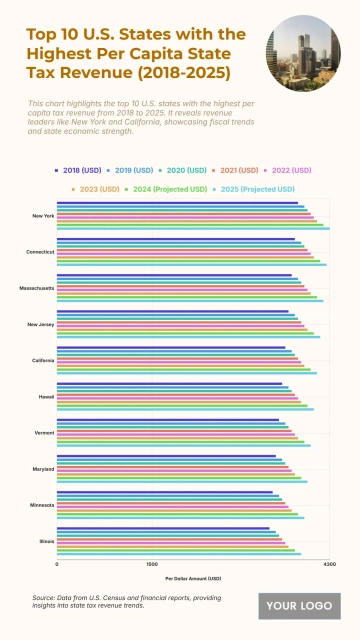
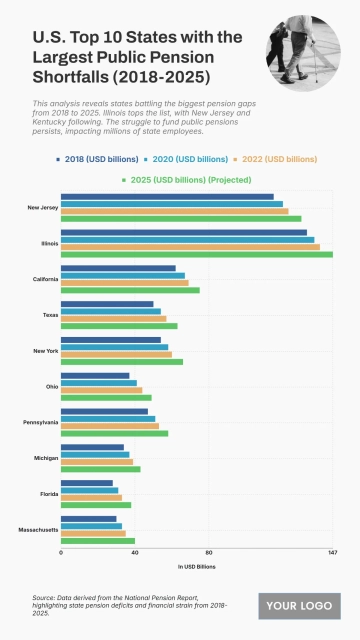
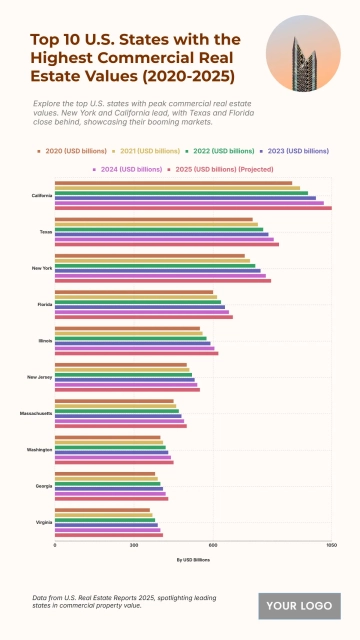
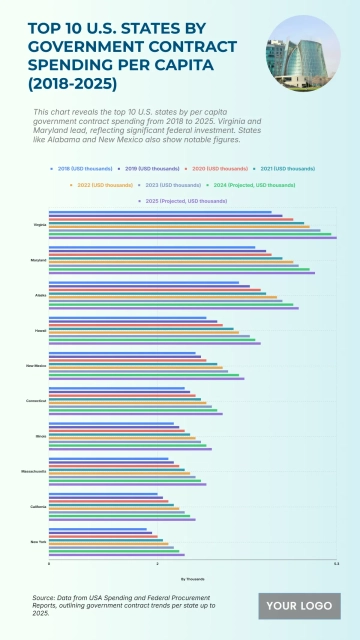
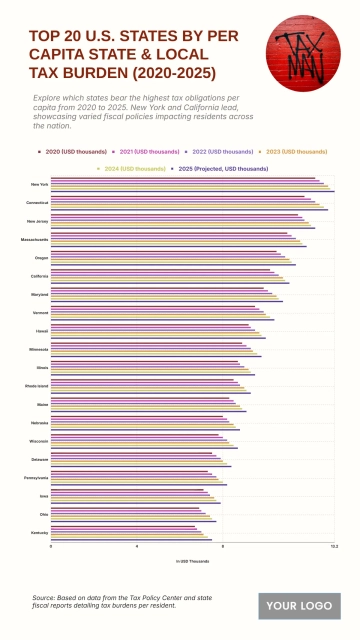
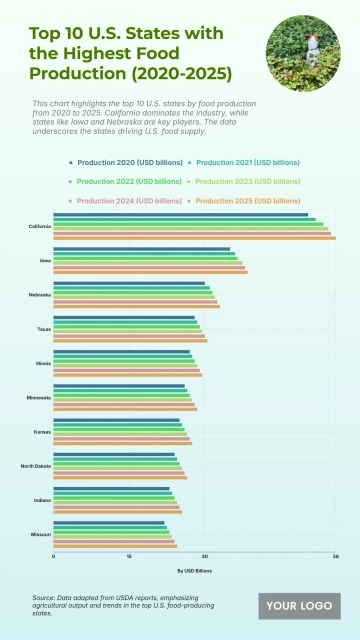
A professional 9:16 economy chart for comparing startup density across the top ten U.S. states, professionally designed by Template.net, with a ten-bar column chart, a circular photo and an intro paragraph in teal green, burnt orange and pale mint.
A professional 9:16 economy chart for comparing startup density across the top ten U.S. states, professionally designed by Template.net, with a ten-bar column chart, a circular photo and an intro paragraph in teal green, burnt orange and pale mint.