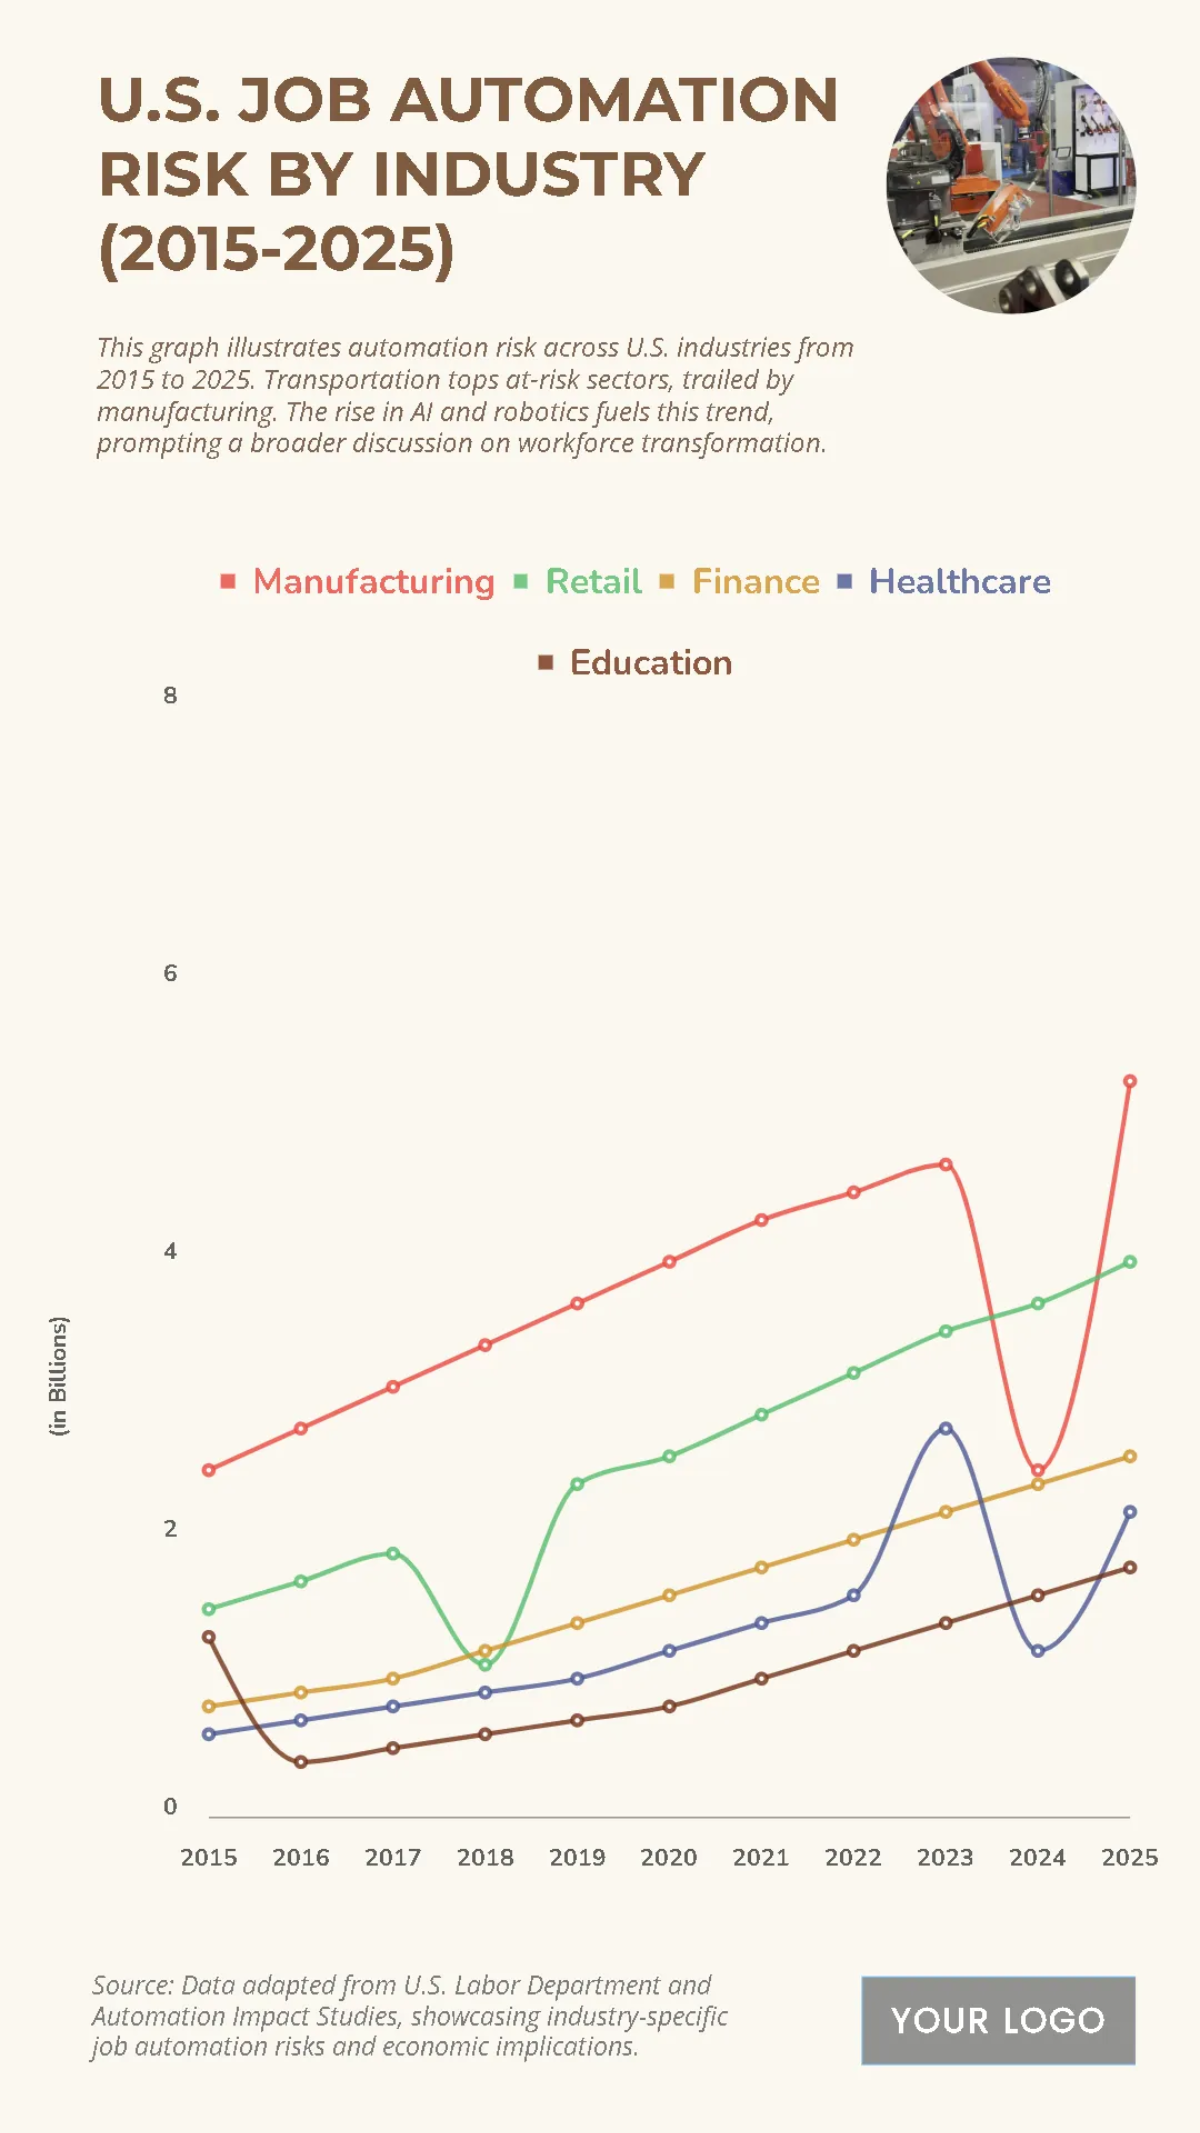
Based on the provided data, all sectors showed a consistent upward trend in contributions from 2015 to 2024, with some experiencing significant growth. Retail and Finance saw the most robust increases, with Retail growing from $1.5 billion to $3.7 billion, and Finance from $0.8 billion to $2.4 billion over the decade. Healthcare also showed steady growth, more than doubling its contributions from $0.6 billion to $1.2 billion. Manufacturing saw its numbers peak at $4.7 billion in 2023 before a sharp decline in the final year to $2.5 billion.